 Reliability, item functioning, and gender bias of the CES-D Scale in community-dwelling older adults: findings from the ELSA cohort
Abstract
Objective: To evaluate the item performance of the Center for Epidemiologic Studies Depression Scale.
Methods: The participants were adults aged ≥ 50 years from the English Longitudinal Study of Ageing. Using classical test theory and item response theory, data from 11,612 participants were analyzed to estimate reliability, item discrimination (a), and item difficulty (b). Differential item functioning analyses were used to determine whether men and women responded differently to items despite similar depressive symptom levels.
Results: The Center for Epidemiologic Studies Depression Scale demonstrated adequate internal consistency (α = 0.80; ω = 0.85), with marginal reliability (0.65). Around 60% of the participants reported at least one depressive symptom. All items showed moderate to high levels of discrimination (a > 0.66), with “slept restlessly” being the most frequently reported (b = 0.43), and “felt lonely” being the least (b = 1.59). Four items – “slept restlessly,” “felt lonely,” “felt sad,” and “could not get going” – had significant differential item functioning, with women more likely to report these items than men at equivalent symptom levels.
Conclusion: The Center for Epidemiologic Studies Depression Scale items showed acceptable reliability and effectively captured varying depression severity. Despite some differential item functioning, no substantial gender-related measurement bias was found, supporting the scale’s use for screening in older adult populations.
Keywords:
Depressive symptoms; Center for Epidemiologic Studies Depression; older adult; classical test theory; item response theory; differential item functioning
Introduction
Depressive disorder has a substantial impact on an individual’s emotional state, cognitive processes, and ability to engage in daily activities.1,2 Despite its significant burden, depressive states in older adults often go unrecognized and undertreated.3 Noticeably, depressive disorder manifests differently in older adults than younger adults, presenting distinct nuances in its clinical features.4-6 Likewise, older men and women also report a dissimilar profile of depressive symptoms,7 both in terms of prevalence and psychopathological presentation.8,9 Given the global trend in aging anticipated in the coming decades, it is essential to improve the detection of depressive states in older adults through cost-effective screening tools.
The Center for Epidemiologic Studies Depression Scale (CES-D) is an extensively validated instrument for assessing depressive symptoms, particularly in community-based settings.10-12 Its adaptability underscores its relevance for older adults,13-17 making it a practical and accessible tool for identifying those at risk of depression in this population. However, depression screening tools like the CES-D may require recalibration over time. Reexamining large-scale data through alternative perspectives can provide insight into how well the scale predicts the risk of depressive symptoms in aging cohorts.
The present study explored a large-scale dataset of the 8-item version of the CES-D scale from the perspective of classical test theory (CTT) and item response theory (IRT) to investigate its psychometric congruence. While CTT was used to provide straightforward insights into the overall reliability and validity of the instrument, IRT allowed for a deeper examination of individual item characteristics, such as difficulty and discrimination parameters. In addition, IRT analysis of differential item functioning (DIF) helps uncover items that work differently among individuals displaying depressive symptoms of similar severity. The integration of both methodologies allows a nuanced understanding of how the CES-D functions across diverse older adult populations, accounting for unique variations in symptom presentation and potential measurement biases.
This study analyzed self-reported depressive symptoms in community-dwelling older adults from the English Longitudinal Study of Ageing (ELSA) through item assessment of the CES-D scale. Such an analysis could improve the scale’s precision and ensure that it remains sensitive and reliable across different levels of depressive severity in the community. First, the CES-D’s psychometric properties and reliability for detecting depressive symptoms will be described. Second, the discrimination and difficulty levels of individual CES-D items will be analyzed using the CTT and IRT methods. Third, DIF analysis will be used to evaluate gender-related measurement bias regarding item endorsement. Finally, equivalences and misconceptions regarding the scale’s efficacy in older adults will be discussed.
Methods
Design and participants
This study is a secondary analysis of data from ELSA, an ongoing panel study designed to monitor individuals aged ≥ 50 years who reside in England. Recruitment for ELSA’s participant pool began in 2002 based on the Health Survey for England. Multi-stage stratified probability sampling was used to construct a nationally representative sample.18 ELSA follow-up interviews are conducted every 2 years. Additional information on the study design can be found elsewhere.15
The baseline wave (2002) included a cohort of 12,099 older adults. Of this group, 487 individuals were excluded due to invalid data or errors related to data collection or entry. The present analysis is based on a dataset of 11,612 valid questionnaires, representing 96% of the original sample after removing unreliable questionnaires. All participants completed a self-administered survey with closed-ended questions focusing on physical and mental health indicators, including the CES-D scale.
Within this sample, 6,502 individuals were identified as women, representing 56% of the participants. The overall mean age was 63.8 years (SD = 10.6). Sex differences in mean age were observed, with men slightly older than women (mean age 64.1 vs. 63.5 years; p < 0.001). Marital status was distributed as follows: 5.5% were single, 67.6% were married, 10.5% were divorced, and 16.4% were widowed.
The Center for Epidemiologic Studies Depression Scale
The 8-item CES-D is an abbreviated version of the 20-item CES-D, which was designed to detect symptoms indicative of depressive disorder.10,19 Respondents complete a self-report survey in which they are instructed to indicate the frequency of eight emotions they experienced in the past week: depressed (item 1), everything was an effort (item 2), restless sleep (item 3), happy (item 4), lonely (item 5), enjoyed life (item 6), sad (item 7), and unable to get going (item 8). Positive statements (items 4 and 6) were reversely coded. In general, each CES-D item is scored as a dichotomized variable to identify possible cases of depression above threshold scores > 4.10,20 We used binary scoring (yes/no) to indicate the absence or presence of depressive symptoms. Total scores range from 0 to 8, indicating the presence of no symptoms or all symptoms. Higher scores indicate greater depression symptoms.
Regarding criterion validity, the CES-D’s sensitivity and specificity were 56.2%-70.2% and 84.7%-94%, respectively, in the Health and Retirement Study when compared against the Composite International Diagnostic Interview – Short Form as the gold standard,17 and its sensitivity of and specificity were 29%-82% and 39%-92%, respectively, in the Longitudinal Aging Study in India.21 Agreement on depression classification between the CES-D and the Composite International Diagnostic Interview – Short Form was poor or weak (κ range = 0.04-0.44).17,21 Variability across studies and populations has led to inconsistencies and limitations in depression classification, requiring careful interpretation in research and clinical settings. Further studies are needed to examine symptom-related and contextual factors.
In the ELSA cohort, a substantial proportion of community-dwelling respondents (41.1%) scored zero on the CES-D. A total of 16.2% of participants scored above a cutoff of 4, indicating the potential presence of depressive disorder. While no correlation was found between age and total score, the mean CES-D score differed significantly between women and men (1.8 vs. 1.3; p < 0.001). Although the CES-D is not designed to diagnose clinical depression, its alignment with standardized clinical interviews has been well-supported for older populations.13,22
Statistical analysis
The initial analysis assessed the dispersion and homogeneity of individual scale items and overall scores. We examined key parameters such as mean, SD, Pearson’s coefficient of variation, and Cronbach’s alpha (α) to ensure internal consistency. In addition, we estimated McDonald’s omega (ω) coefficients under the congeneric measurement model. Both the CTT and IRT statistical frameworks were used to examine the CES-D data.
In CTT, two methods of item analysis were considered: the biserial point correlation (rpbis) and the proportion of endorsement (%e). The rpbis measures evaluate the relationship between observed and expected values to determine the item’s discriminative ability.23 To interpret the results, a correlation range of 0 to 0.14 was considered weak, 0.15 to 0.25 moderate, 0.26 to 0.35 good, and > 0.35 very good.24,25 The %e corresponds to the endorsement proportion or item difficulty26 and ranges from 0 to 1.0. Values close to 1.0 indicate items with low difficulty, values ≅ 0.5 indicate moderate difficulty, and values close to 0 indicate high difficulty.24,25
Unidimensionality within the IRT framework was evaluated using confirmatory factor analysis to examine the covariance structure of the CES-D. As expected, given the large sample size, the chi-square test was statistically significant (χ2 [20] = 1440.94, p < 0.001), which should not be interpreted in isolation as evidence of model fit. Instead, model evaluation was based on a combination of fit indices. The comparative fit index (0.97) and the Tucker-Lewis index (0.95) both indicated good fit to a unidimensional model, whereas the root mean squared error of approximation (0.08) suggested borderline fit. Taken together, these results provide overall support for the adequacy of a unidimensional structure, while also acknowledging some limitations in fit.
Local independence among the 8 CES-D items was evaluated using Yen’s Q3 residual correlations derived from the IRT model. Q3 values ranged from -0.295 to 0.162, with most item pairs showing residual correlations below |0.20|, indicating that items were largely locally independent. A few item pairs (1/6, 2/4, 2/7) had slightly higher correlations (-0.261 to -0.295), suggesting only mild local dependence. Overall, these findings support the assumption of local independence and provide evidence that IRT analyses of the CES-D are unlikely to be substantially biased by violations of this assumption.
Monotonicity of the 8 CES-D items was evaluated using Mokken scale analysis. The instrument’s overall scalability was medium-to-strong (H = 0.469), indicating a coherent unidimensional structure. Item-level scalability coefficients (Hi) ranged from 0.394 to 0.541, showing that all items scaled adequately with the latent trait. Pairwise item scalability coefficients (Hij) were all positive and moderate-to-high (0.325-0.636), supporting consistent item behavior across levels of depression severity. These results indicate that the probability of reporting each symptom increased with higher latent depression severity, providing robust evidence that the monotonicity assumption is satisfied for the CES-D scale.
In IRT, measurement precision is captured by the test information function, which reflects how much information the scale provides and how it relates to measurement error. Based on this function, we calculated the marginal reliability, a summary index that averages measurement precision across the full distribution of the latent trait theta (θ) and provides an overall estimate of the scale’s reliability. To complement this, we generated a conditional reliability curve, which depicts reliability at specific θ values along the latent trait continuum. Conditional reliability, derived from the test information function, illustrates how measurement precision varies across different levels of the trait and is inversely related to the standard error of measurement – with higher reliability indicating lower error.
The CES-D items were examined using a two-parameter logistic IRT model with dichotomized scores. The model estimates item discrimination (ai) and difficulty (bi) parameters. The magnitude of the ai parameter illustrates an item’s ability to discriminate the construct being analyzed, and the bi score positions an item along the latent variable θ, which represents the difficulty (or severity) of the construct being assessed by the CES-D items. Both parameters were plotted as item characteristic curves over θ. Sharp slopes indicated high discriminative ability (ai), whereas flat slopes indicated low discriminative ability.
To evaluate whether CES-D items function equivalently between genders, a DIF analysis was used to compare men (reference group) and women (focal group), with dichotomized item responses (0 = absence, 1 = presence). Significant DIF was initially flagged using Lord’s chi-square test with a Bonferroni-adjusted alpha level of 0.01. Logistic regression models then determined whether bias was uniform or non-uniform across severity levels (θ). The classification of the type of DIF was based on fit change across nested logistic regression models, accounting for group membership and latent trait level θ. Item responses were the dependent variable, while independent variables included θ of depressive symptoms, gender, and their interactions. Three models (baseline, uniform DIF, and full DIF) were compared through the analysis of variance function to determine the best fit. Uniform DIF reflects consistent item response differences across gender groups along the latent trait continuum (θ), while non-uniform DIF depends on the θ level. Thus, uniform DIF indicates a group effect, and non-uniform DIF reflects an interaction with θ.
The magnitude of impact of flagged DIF was evaluated using delta R-squared (ΔR2), which estimates additional variance explained by group-related predictors. The ΔR2 is computed by subtracting the McFadden pseudo-R2 of the baseline model and the extended model. A higher ΔR2 indicates that the DIF had a stronger impact on item interpretation, typically with values above 0.01.27 If the group effect was statistically significant and substantial, it was considered to have affected the interpretation of the underlying construct.
Difficulty-by-discrimination and item response were presented visually through a graphical representation created using SPSS 20.0 and an Excel spreadsheet. We calculated the IRT and DIF parameters and plots using the mirt and lordif packages in R, and the test information curve was plotted in MPlus 5.0.
Ethics statement
Ethical approval and experimental protocols for the ELSA study were granted by the Multi-center Research and Ethics Committee (protocol #MREC/01/2/91). All participants provided informed consent for their involvement in the study. We confirm that all research and methodologies adhered to approved guidelines and regulations.
Results
Table 1 presents the psychometric analysis of responses from 11,612 individuals who completed the CES-D 8. The mean total score was 1.58 (SD = 1.99; coefficient of variation = 1.26). Data distribution was left-skewed, mostly with item 3 “slept restlessly” showing the highest mean score (mean = 0.41). Intermediate means (mean ≅ 0.2) were observed for items 2, 8, 7, and 1, respectively, for “everything was an effort,” “unable to get going,” “sad,” and “depressed.” Low means were observed for items 5, 4, and 6 (mean = 0.10 to 0.13), respectively, for “lonely,” “happy,” and “enjoyed life.” The wide data dispersion of 1.99 suggested that response bias could have affected score accuracy.
Psychometric characteristics of the 8-item CES-D scale for older adults from the ELSA cohort (N = 11,612)
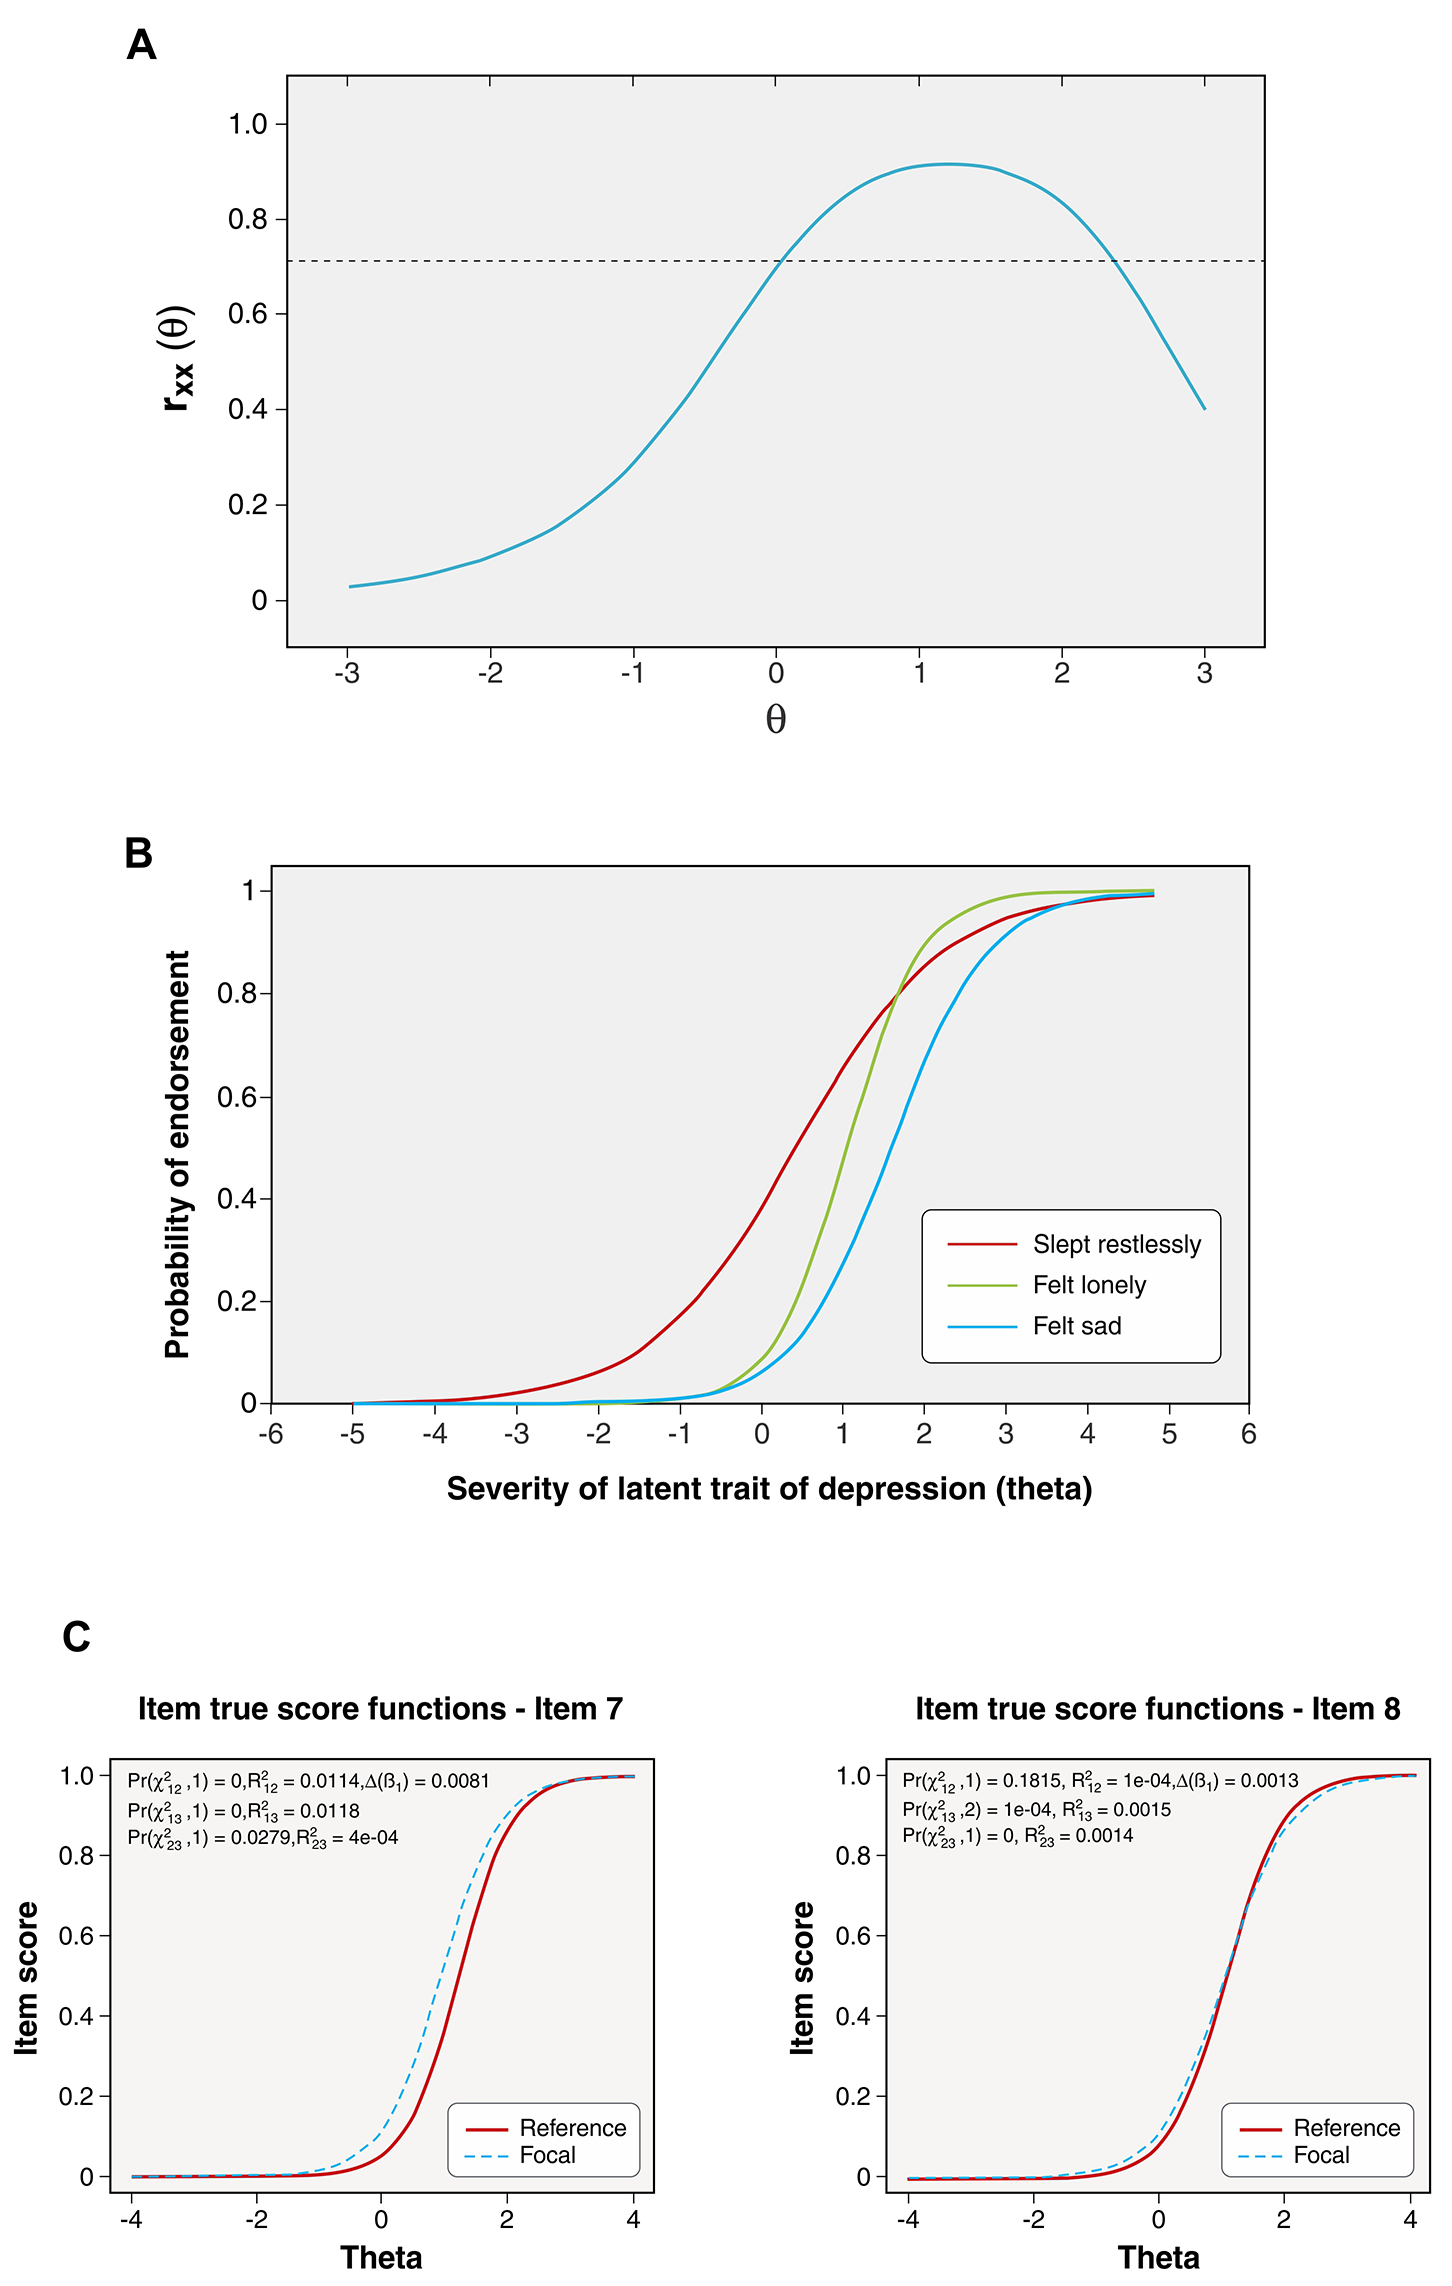
The CES-D showed acceptable internal consistency (Cronbach’s α = 0.80). Considering item loadings and error variances, the alternative McDonald’s ωt (0.85) also indicated adequate reliability. Meanwhile, the conditional reliability of the IRT model displayed substantial variability along the θ dimension. The range of satisfactory reliability (> 0.8) was θ = 0.5 to 2.0 (Figure 1A). This interval indicated that the scale works most reliably among individuals with intermediate or high levels of θ (i.e., severity of depressive symptoms). The marginal reliability (0.62) suggested that the scale may not efficiently assess a homogeneous construct across the entire θ continuum. These findings suggested that non-symptomatic/oligosymptomatic individuals and severely depressed individuals would not be reliably identified.
A) Conditional reliability curve (marginal reliability = 0.62) of the Center for Epidemiologic Studies Depression 8-item version across the θ continuum (n = 11,612). A threshold > 0.8 is considered acceptable reliability. B) Item characteristic curves for selected items: slept restlessly (item 3), felt lonely ( item 5), and felt sad (item 7) using the item response theory approach. C) Differential item functioning - uniform (item 7) and non-uniform (item 8).
Table 2 presents a comparison of item indicators in the CES-D from both the CTT and IRT perspectives. The discrimination (rpbis) and difficulty index (%e) of each item were shown alongside their corresponding IRT discrimination (ai) and difficulty parameter (bi) values. For the total CES-D score, the mean discrimination index achieved through the CTT approach was rpbis = 0.65 (range: 0.57-0.74), with a mean difficulty index of %e = 19.6 (range: 9-40). Half of the items (1, 2, 7, and 8) effectively distinguish depressive states (rpbis > 0.65), but the items’ difficulty levels varied. While the CES-D had favorable item indicators, the precision of CTT-derived estimates is a concern.
Parameters of item difficulty and item discrimination of the CES-D, comparison between the CTT and IRT models
Three items with varying degrees of difficulty were chosen to illustrate the outcomes of the CTT and IRT methods. These items consist of item 3 “slept restlessly,” which was the least difficult, item 7 “sad,” which was of moderate difficulty, and item 5 “lonely,” which was the most difficult. The response patterns for each item through CTT item response were displayed in slopes, where the y-axis indicates the probability of endorsement and the x-axis the severity level or range of the total score (Supplementary Figure S1). Item 3 showed higher endorsement at low severity levels and a decreasing slope toward the next severity level. Conversely, items 5 and 7 showed consistently low endorsement or high levels of difficulty throughout the continuum.
According to traditional CCT analysis, none of the CES-D items were classified as easy to endorse based on the level of difficulty and discrimination plot (Supplementary Figure S2). Item 3 had the lowest severity or difficulty level (%e = 40%), while items 1, 4, 5, and 6 were considered the most severe or difficult to endorse (%e < 20%). Our results show that the difficulty parameters (bi) and depression severity varied widely in the model, ranging from bi = 0.4 to 1.6 on θ (Table 2). In this study of older adults, items 5 and 6 reflected higher levels of depression severity or were more difficult to endorse (bi > 1.5), while items 3 and 2 had the lowest severity level or were more easily endorsed (bi < 1.0). The remaining items (4, 1, 7, and 8) had moderate severity (1.0 ≥ bi ≤ 1.5). Based on 1,000 bootstrapped samples, a significant correlation emerged between difficulty indicators %e and bi (r = -0.96, 95%CI -0.92 to -0.99, p < 0.001). Consequently, there was considerable agreement between the outcomes of both methods, and most CES-D items identified individuals exhibiting moderate-to-high severity of the depressive construct under assessment.
Item discrimination parameters ranged from ai = 0.66 to 2.09. The items with the highest ability to discriminate the construct under study were 1, 6, 4, and 2 (ai range = 1.39-2.09). In contrast, item 3 was the least discriminating item (ai = 0.66). The remaining items, 7, 8, and 5 (ai range = 1.0-1.31), showed acceptable discriminative ability.
Figure 1B displays the item characteristic curves of three selected depressive symptoms (items 3, 5, and 7). The curves show the slopes of item discrimination (ai) and item difficulty (bi) along the continuum θ. The S-shaped curves depict varying degrees of monotonicity and depict the probability of responding in a specific category or higher based on the latent trait level. Visually, item 3 was positioned on the left side of θ, item 7 around the midpoint, and item 5, which was on the right side, had the highest difficulty. The correlation between discrimination parameters in CTT and IRT (rpbis and ai) yielded a robust association (r = 0.75; p < 0.032).
Importantly, the narrow standard error of estimates of IRT parameters from this large sample (Table 2) underscores the accuracy of the indicators. Furthermore, the test information curve and standard error estimates (Supplementary Figure S3) allow examination of the range in which the CES-D provides optimal information about depression symptom severity, which falls between 1 and 1.5 in θ.
Differential item functioning analysis
Table 3 shows the results of the DIF analysis between male and female respondents. Taking men as the reference group, four of the eight CES-D items demonstrated evidence of DIF at the 0.01 significance threshold: item 3 (slept restlessly), item 5 (felt lonely), item 7 (felt sad), and item 8 (could not get going). Regression models (data not shown) classified some items as exhibiting both uniform and non-uniform DIF (item 3), uniform DIF (items 5 and 7), and non-uniform DIF (item 8). Figure 1C illustrates uniform (item 7) and non-uniform DIF (item 8). These findings suggest measurement bias for these items, indicating that the interpretation of these symptoms differs between genders, even when the overall severity of depressive symptoms is comparable. Women overestimated symptom severity in half of the CES-D items.
The effect of differential expression of depressive complaints was assessed using McFadden’s pseudo-R2 difference (ΔR2). Of the four items flagged for DIF, only item 7 (felt sad) yielded a ΔR2 above 0.01 (Supplementary Table S1), indicating that group membership had a small effect on item response. While items 3, 5, and 8 also showed DIF, their ΔR2 values remained below 0.01. Therefore, the overall effect on measurement validity for most flagged items appeared minimal.
Discussion
This study conducted item analysis in the context of depression research in older adults, applying CTT and IRT frameworks. For the first time, a large dataset of 8-item CES-D responses from a nationwide survey was analyzed, focusing on scale reliability, item discrimination, difficulty parameters, and gender-related measurement invariance. Both methods confirmed that the CES-D has reasonable reliability, high discriminative capacity, and varying levels of item endorsement difficulty, which supports its effectiveness in screening for depressive states in community-dwelling older adults. The IRT framework enhanced the precision of psychometric parameter estimation and helped identify the range in which the scale performed best, yielding a refined understanding of item functioning. Furthermore, IRT provided additional perspective on item measurement bias, contributing to a more comprehensive interpretation of the scale’s application in older populations.
Our reliability analysis offers further insight into the performance of the CES-D. The scale’s internal consistency, assessed using various methods (e.g., Cronbach’s α and McDonald’s ω), was comparable to findings from previous studies.22,28,29 However, IRT-based reliability analyses suggested that it performs optimally for individuals with multiple depressive symptoms, particularly in the θ range of +0.5 to +2. Marginal reliability values indicated potential heterogeneity among certain CES-D items, which warrants further attention.
The eight CES-D items showed variable discriminative ability. In IRT analysis, discrimination parameters ranged from moderate to very high,30 while CTT analysis indicated consistently good discrimination.24 The items on depressed mood (depressed) and loss of pleasure (enjoyed life) were the most discriminatory in both models, aligning with core DSM-5 criteria31 for major depressive disorder. The items “lonely,” “enjoyed life,” and “happy” required more severe depression for endorsement. “Lonely” was particularly prevalent among ELSA participants, highlighting its role as a social determinant of depression and its impact on the well-being of older adults.32,33 Conversely, “slept restlessly” showed the lowest discrimination and difficulty in older adults, a pattern consistent in CTT and IRT. Sleep problems are common among older individuals and often lack specificity in psychiatric associations.34,35 Many unique features of depression severity in older adults are captured by scale items.
Previous studies on CES-D measurement bias using large datasets have yielded mixed results. Using multi-group confirmatory factor analysis, data from the multi-country European Social Survey found consistent gender differences in depression despite eliminating measurement bias,28 while a later wave of the survey reported invariance between the sexes in factor structure, intercepts, residuals, and loadings.22 The Survey of Health, Ageing and Retirement indicated that the CES-D’s depression construct was comparable across age and country groups, supporting substantive interpretations of symptom correlations.29 These findings highlight the importance of psychometric evaluation in ensuring fairness and accuracy in mental health assessments, particularly in epidemiological studies and clinical settings that rely on group comparisons for diagnostic and research purposes.
In the IRT framework, the DIF in four of the eight CES-D items reinforces concerns about the scale’s measurement bias between genders. Women were more likely to endorse item 3 (slept restlessly), possibly due to biological or psychosocial influences on sleep-related complaints.36,37 Similarly, the DIF in item 5 (felt lonely) may reflect gender differences in social connectedness or emotional reporting.7,38 The DIF of item 7 (felt sad) suggested that women endorsed it more frequently, possibly due to sociocultural influences on emotional expressiveness rather than genuine differences in depressive severity.9,39 Finally, the DIF of item 8 (could not get going) indicated a higher likelihood of endorsement by women, possibly related to fatigue, motivation, or gender-specific daily demands.7,8 These unequal effects could be interpreted in light of the mental health consequences of accumulating work and family roles at various life stages among women. As a consequence, the presence of DIF may suggest that the inflated depression scores among women were not due to actual differences in latent trait depression, but rather to biased item responses.40,41 This underscores the importance of considering DIF when using patient-reported outcome measures in diverse populations.42,43
Potential limitations should be kept in mind when interpreting the results of our study. First, the narrow demographic characteristics of participants aged ≥ 50 years preclude the generalizability of the results to younger groups. This selection bias could be addressed by recruiting a more inclusive sample. Second, the self-report characteristics of the CES-D may be influenced by the participants’ level of education and mental health stigma. Third, there was no external validator, such as a structured interview, to confirm the diagnosis of major depression or its severity. Longitudinal data studies should be conducted to confirm the stability of our item analysis.
The 8-item CES-D is a brief and reliable self-report measure for identifying depressive symptoms in older adults. The use of multiple item analysis methods offered a comprehensive evaluation of its performance in a community setting. Therefore, the CES-D’s ability to screen individuals suspected of depressive disorders is confirmed. Our findings also reveal gender-related measurement bias in the CES-D, although it had a small effect. These findings underscore the importance of routinely evaluating item performance before implementing psychometric tools in survey research.
Supplementary Materials
Supplementary Material
Data availability statement
The data that support this study are available from the authors upon request.
References
- 1 Snyder HR. Major depressive disorder is associated with broad impairments on neuropsychological measures of executive function: a meta-analysis and review. Psychol Bull. 2013;139:81-132.
- 2 Otte C, Gold SM, Penninx BW, Pariante CM, Etkin A, Fava M, et al. Major depressive disorder. Nat Rev Dis Primers. 2016;2:16065.
- 3 Gundersen E, Bensadon B. Geriatric depression. Prim Care. 2023;50:143-58.
- 4 Byers AL, Yaffe K, Covinsky KE, Friedman MB, Bruce ML. High occurrence of mood and anxiety disorders among older adults: the national comorbidity survey replication. Arch Gen Psychiatry. 2010;67:489-96.
- 5 Taylor WD. Clinical practice. Depression in the elderly. N Engl J Med. 2014;371:1228-36.
- 6 Haigh EAP, Bogucki OE, Sigmon ST, Blazer DG. Depression among older adults: a 20-year update on five common myths and misconceptions. Am J Geriatr Psychiatry. 2018;26:107-22.
- 7 Alcalde E, Rouquette A, Wiernik E, Rigal L. How do men and women differ in their depressive symptomatology? A gendered network analysis of depressive symptoms in a French population-based cohort. J Affect Disord. 2024;353:1-10.
- 8 Kuehner C. Why is depression more common among women than among men? Lancet Psychiatry. 2017;4:146-58.
- 9 Lai CH. Major depressive disorder: gender differences in symptoms, life quality, and sexual function. J Clin Psychopharmacol. 2011;31:39-44.
- 10 Radloff LS. The CES-D scale: a self-report depression scale for research in the general population. Appl Psychol Meas. 1977;1:385-401.
- 11 Kim G, Decoster J, Huang CH, Chiriboga DA. Race/ethnicity and the factor structure of the center for epidemiologic studies depression scale: a meta-analysis. Cultur Divers Ethnic Minor Psychol. 2011;17:381-96.
- 12 Shafer AB. Meta-analysis of the factor structures of four depression questionnaires: Beck, CES-D, Hamilton, and Zung. J Clin Psychol. 2006;62:123-46.
- 13 Turvey CL, Wallace RB, Herzog R. A revised CES-D measure of depressive symptoms and a DSM-based measure of major depressive episodes in the elderly. Int Psychogeriatr. 1999;11:139-48.
- 14 Zivin K, Llewellyn DJ, Lang IA, Vijan S, Kabeto MU, Miller EM, et al. Depression among older adults in the United States and England. Am J Geriatr Psychiatry. 2010;18:1036-44.
- 15 Steptoe A, Breeze E, Banks J, Nazroo J. Cohort profile: the English longitudinal study of ageing. Int J Epidemiol. 2013;42:1640-8.
- 16 Briggs R, Tobin K, Kenny RA, Kennelly SP. What is the prevalence of untreated depression and death ideation in older people? Data from the Irish longitudinal study on aging. Int Psychogeriatr. 2018;30:1393-401.
- 17 Dang L, Dong L, Mezuk B. Shades of blue and gray: a comparison of the center for epidemiologic studies depression scale and the composite international diagnostic interview for assessment of depression syndrome in later life. Gerontologist. 2020;60:e242-53.
- 18 Mindell J, Biddulph JP, Hirani V, Stamatakis E, Craig R, Nunn S, et al. Cohort profile: the health survey for England. Int J Epidemiol. 2012;41:1585-93.
- 19 Schlechter P, Ford TJ, Neufeld SAS. The eight-item center for epidemiological studies depression scale in the English longitudinal study of aging: longitudinal and gender invariance, sum score models, and external associations. Assessment. 2023;30:2146-61.
-
20 Steffick DE. Documentation of affective functioning measures in the health and retirement study [Internet]. 2000 [cited 2025 Oct 16]. hrs.isr.umich.edu/sites/default/files/biblio/dr-005_0.pdf
» hrs.isr.umich.edu/sites/default/files/biblio/dr-005_0.pdf - 21 Muhammad T, Lee S, Kumar M, Sekher TV, Varghese M. Agreement between CES-D and CIDI-SF scales of depression among older adults: a cross-sectional comparative study based on the longitudinal aging study in India, 2017-19. BMC Psychiatry. 2025;25:244.
- 22 Karim J, Weisz R, Bibi Z, Ur Rehman S. Validation of the eight-item center for epidemiologic studies depression scale (CES-D) among older adults. Curr Psychol. 2015;34:681-92.
- 23 Glass GV, Hopkins KD. Statistical methods in education and psychology. Boston, MA: Allyn and Bacon;1996.
- 24 Escudero EB, Reyna NL, Morales MR. The level of difficulty and discrimination power of the Basic Knowledge and Skills Examination (EXHCOBA). Rev Electron Investig Educ. 2000;2:2.
- 25 Sim SM, Rasiah RI. Relationship between item difficulty and discrimination indices in true/false-type multiple choice questions of a para-clinical multidisciplinary paper. Ann Acad Med Singap. 2006;35:67-71.
- 26 Crocker L, Algina J. Introduction to classical and modern test theory. New York: Holt, Rinehart, and Winston;1986.
- 27 Jodoin MG, Gierl MJ. Evaluating type I error and power rates using an effect size measure with the logistic regression procedure for DIF detection. Appl Meas Educ. 2001;14:329-49.
- 28 Van de Velde S, Bracke P, Levecque K, Meuleman B. Gender differences in depression in 25 European countries after eliminating measurement bias in the CES-D 8. Soc Sci Res. 2010;39:396-404.
- 29 Missinne S, Vandeviver C, Van de Velde S, Bracke P. Measurement equivalence of the CES-D 8 depression-scale among the ageing population in eleven European countries. Soc Sci Res. 2014;46:38-47.
- 30 Baker F. The basis of item response theory. Vol. 2. College Park: ERIC Clearinghouse on Assessment and Evaluation;2001.
- 31 American Psychiatric Association. Diagnostic and Statistical Manual of Mental Disorders, Fifth Edition (DSM-5). Arlington: American Psychiatric Publishing;2013.
- 32 Domènech-Abella J, Lara E, Rubio-Valera M, Olaya B, Moneta MV, Rico-Uribe LA, et al. Loneliness and depression in the elderly: the role of social network. Soc Psychiatry Psychiatr Epidemiol. 2017;52:381-90.
- 33 Erzen E, Çikrikci Ö. The effect of loneliness on depression: a meta-analysis. Int J Soc Psychiatry. 2018;64:427-35.
- 34 Krystal AD. Psychiatric disorders and sleep. Neurol Clin. 2012;30:1389-413.
- 35 Freeman D, Sheaves B, Waite F, Harvey AG, Harrison PJ. Sleep disturbance and psychiatric disorders. Lancet Psychiatry. 2020;7:628-37.
- 36 Fatima Y, Doi SAR, Najman JM, Mamun AA. Exploring gender difference in sleep quality of young adults: findings from a large population study. Clin Med Res. 2016;14:138-44.
- 37 Zeng LN, Zong QQ, Yang Y, Zhang L, Xiang YF, Ng CH, et al. Gender difference in the prevalence of insomnia: a meta-analysis of observational studies. Front Psychiatry. 2020;11:577429.
- 38 Pinquart M, Sörensen S. Gender differences in self-concept and psychological well-being in old age: a meta-analysis. J Gerontol B Psychol Sci Soc Sci. 2001;56:P195-213.
- 39 Lopez Molina MA, Jansen K, Drews C, Pinheiro R, Silva R, Souza L. Major depressive disorder symptoms in male and female young adults. Psychol Health Med. 2014;19:136-45.
- 40 Bares C, Andrade F, Delva J, Grogan-Kaylor A, Kamata A. Differential item functioning due to gender between depression and anxiety items among Chilean adolescents. Int J Soc Psychiatry. 2012;58:386-92.
- 41 Marrie RA, Lix LM, Bolton JM, Fisk JD, Fitzgerald KC, Graff LA, et al. Assessment of differential item functioning of the PHQ-9, HADS-D and PROMIS-depression scales in persons with and without multiple sclerosis. J Psychosom Res. 2023;172:111415.
- 42 Broekman BFP, Nyunt SZ, Niti M, Jin AZ, Ko SM, Kumar R, et al. Differential item functioning of the geriatric depression scale in an Asian population. J Affect Disord. 2008;108:285-90.
- 43 Teresi JA, Ocepek-Welikson K, Kleinman M, Eimicke JP, Crane PK, Jones RN, et al. Analysis of differential item functioning in the depression item bank from the Patient Reported Outcome Measurement Information System (PROMIS): an item response theory approach. Psychol Sci Q. 2009;51:148-80.
-
How to cite this article:
Sá-Junior AR, Petrilli-Mazon VA, Schneider I, Wang YP, Oliveira C. Reliability, item functioning, and gender bias of the CES-D Scale in community-dwelling older adults: findings from the ELSA cohort. Braz J Psychiatry. 2026;48:e20254401. Epub 2025 Oct 5. http://doi.org/10.47626/1516-4446-2025-4401
Edited by
-
Handling Editor:
Leonardo Baldaçara