
 Comparison of optical coherence tomography findings in patients with major depressive disorder and bipolar disorder in remission
Abstract
Objective: This study aimed to examine the peripapillary retinal nerve fiber layer (RNFL) thickness, macular thickness (MAC), ganglion cell layer (GCL) thickness, and inner plexiform layer (IPL) thickness using optical coherence tomography (OCT) in patients with euthymic bipolar disorder (BD) and recurrent major depressive disorder (MDD) in remission, and to compare these measurements with those of a healthy control group (CG).
Methods: The study included 51 patients with BD, 50 patients with MDD, and 52 individuals in the CG. Comprehensive ophthalmologic examinations were performed on all participants, and only the right eye was analyzed. OCT findings were compared among the groups.
Results: There were no significant differences among the groups in terms of age, gender, smoking status, RNFL, or IPL measurements. The CG showed significantly greater MAC central and inner temporal (IT) thickness compared to both the MDD and BD groups (all p < 0.05). However, there was no significant difference in MAC central thickness between the MDD and BD groups (p = 0.084). The MAC IT thickness was significantly greater in the MDD group than in the BD group (p = 0.046). MAC inner inferior thickness was significantly higher in the CG compared to both the MDD and BD groups (p = 0.003 and p < 0.001, respectively), with no significant difference between the MDD and BD groups (p = 0.141). GCL IT thickness was also significantly higher in the CG than in both patient groups (p = 0.049 and p = 0.044, respectively).
Conclusion: The observed differences between the MDD and BD groups may reflect disorder-specific retinal structural changes. Further studies with larger sample sizes and longitudinal follow-up are needed to validate these findings and clarify the implications for retinal structure and function in mood disorders.
Bipolar affective disorder; major depression; ganglion cell layer; inner plexiform layer; peripapillary retinal nerve fiber layer; optical coherence tomography
Introduction
Bipolar disorder (BD) and major depressive disorder (MDD) are chronic, recurrent, and debilitating psychiatric illnesses that significantly impair quality of life and functioning across social, cognitive, and occupational domains.1,2 BD is often initially misdiagnosed and is characterized by recurrent episodes of mania or hypomania alternating with depressive phases. The bipolar spectrum has a lifetime prevalence of approximately 2.4% and ranks among the top 10 leading causes of disability worldwide.1
MDD is a prevalent psychiatric disorder defined by persistent depressed mood, anhedonia, lack of motivation, fatigue, sleep disturbances, impaired concentration, and feelings of hopelessness lasting for at least 2 weeks. Globally, MDD affects roughly 11% of the population.3 Recurrent depressive episodes appear to be associated with more severe cerebral impairments than initial episodes.4 Although the underlying pathophysiology of both MDD and BD remains incompletely understood, increasing attention has been given to their neurodegenerative components.1,5
Optical coherence tomography (OCT) is a relatively new, non-invasive, radiation-free imaging technique that enables detailed in vivo visualization of retinal layers.6 Although originally developed for ophthalmologic assessments, OCT has also been applied in the evaluation of neurodegenerative disorders such as Alzheimer’s disease, Parkinson’s disease, and multiple sclerosis due to its capacity to detect retinal degeneration.7
Because the retina is an anatomical and developmental extension of the central nervous system, and that neurodegenerative processes are common in psychiatric disorders, OCT has emerged as a promising tool for investigating the pathophysiology of conditions such as BD and MDD.8 Thinning of the retinal nerve fiber layer (RNFL) observed on OCT – suggestive of molecular pathway involvement in neurotransmission – has been interpreted as structural evidence of neuronal loss.9 In diseases such as Alzheimer’s and Parkinson’s, RNFL thinning has been correlated with cognitive decline, and similar retinal changes may occur in mood disorders as markers of underlying neurodegeneration.10
The retina is connected to the brain via the optic nerve, which comprises the axons of ganglion cells.11 Abnormalities in the ganglion cell layer among patients with MDD may be associated with dysfunction in dopaminergic or serotonergic neurotransmission.11 Neuroimaging studies of BD have revealed neurodegenerative findings, including enlarged lateral ventricles, increased white matter hyperintensities, reduced volumes in the subgenual prefrontal cortex, thalamus, and hippocampus, and evidence of disrupted cellular integrity in the prefrontal and striatal regions.12 Likewise, meta-analyses of studies using magnetic resonance imaging in MDD have demonstrated volume reductions in the frontal lobes and hippocampus, supporting the presence of neurodegeneration.13 Some studies have also suggested that the severity of mood disorders correlates with retinal degeneration.14,15 Furthermore, neuronal atrophy in the cerebral cortex may be accompanied by retinal layer thinning detectable through OCT.16
Although previous studies have separately compared detailed OCT findings in patients with BD and MDD with healthy controls, to our knowledge, no study has directly compared these two clinical populations during their remission phases. The present study aimed to compare peripapillary RNFL (ppRNFL) thickness, macular thickness (MAC), ganglion cell layer (GCL) thickness, and inner plexiform layer (IPL) thickness measured by OCT in patients with BD, MDD, and a healthy control group (CG). We hypothesized that, based on the neurodegenerative features of BD and MDD, OCT findings would differ between the patient and control groups. We also investigated whether disease duration and the number of episodes were correlated with OCT parameters in the BD and MDD groups.
Methods
Study design and setting
This study was designed as a controlled, cross-sectional study with prospectively collected data. Patients were selected consecutively by a psychiatrist according to predefined inclusion and exclusion criteria. Ophthalmologic evaluations were performed by the study ophthalmologist. The CG consisted of healthy volunteers who visited either the ophthalmology or psychiatry clinic and met the exclusion criteria following a psychiatric interview.
Participants
The study included three groups: 50 patients with recurrent MDD in remission, 51 patients with BD in remission, and 52 individuals in the CG, all aged between 18 and 65 years. Participants were recruited from a psychiatry outpatient clinic.
Inclusion and exclusion criteria
Inclusion criteria were age between 18 and 65 years; for the BD group, a confirmed diagnosis of BD type I according to DSM-5 criteria and at least 6 months in remission; for the MDD group, at least two prior depressive episodes and remission for at least 6 months; literacy; and absence of other psychiatric diagnoses. Remission was defined as the absence of a current affective episode for at least 6 months, confirmed by clinical interview and standardized rating scales. Euthymia was defined as a score of ≤ 7 on the Hamilton Depression Rating Scale (HAM-D) and ≤ 4 on the Young Mania Rating Scale (YMRS), in accordance with accepted thresholds.
Exclusion criteria were age < 18 or > 65 years; illiteracy; presence of any psychiatric disorder other than MDD or BD type I, as determined by the Structured Clinical Interview for DSM-5 Disorders (SCID-5); refractive error > 5 diopters (D) spherical equivalent and/or astigmatism > 2 D; best-corrected visual acuity < 0.3 logarithm of the minimum angle of resolution; optic nerve disease or anomaly; history of ocular trauma, previous ocular surgery, or laser photocoagulation; organic eye disease including glaucoma, retinal pathology, or corneal/vitreous opacity; neurological diseases; and unwillingness to participate. Individuals with diabetes, hypertension, thyroid disorders, cerebrovascular disease, or known hereditary diseases were also excluded.
Procedure
Psychiatric evaluation
All diagnoses were made by an experienced psychiatrist using DSM-5 criteria. The SCID-5, a structured diagnostic interview with established validity and reliability,17 was administered to all participants. Only patients in remission for at least 6 months were enrolled. MDD severity was assessed using the HAM-D, originally developed by Hamilton for clinical research.18 The Turkish version has been validated by Akdemir et al.19 Manic symptoms were evaluated using the YMRS, developed by Young et al.,20 with the Turkish validation conducted by Karadağ et al.21 Patients were included only if they scored ≤ 7 on the HAM-D and ≤ 4 on the YMRS.
Ophthalmological evaluation
All participants underwent a comprehensive ophthalmologic examination, including anterior segment and fundus evaluations. OCT scans were obtained for all subjects by the same experienced technician using the Heidelberg Spectralis OCT system (Heidelberg Engineering, Heidelberg, Germany), 30 minutes after pupil dilation with 1% tropicamide. Although both eyes were scanned, only the right eye was included in the analysis to avoid statistical interdependence between eyes, a common practice in similar studies.
The assessment of OCT included measurement of ppRNFL thickness (μm) in seven regions, MAC (μm) in nine regions, GCL thickness (μm) in nine regions, and IPL thickness (μm) in nine regions (Figure 1). As shown in Figure 2, MAC, GCL, and IPL measurements were taken from a macula-centered circle (1 mm in diameter), the inner ring (3 mm diameter) comprising the inner superior (IS), inner nasal (IN), inner temporal (IT), and inner inferior (II) quadrants, and the outer ring (6 mm diameter) comprising the outer superior, outer nasal, outer temporal, and outer inferior quadrants. In addition to layer-specific thickness, volumes of the macula, GCL, and IPL were also recorded.
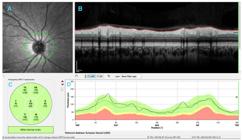
Measurement of RNFL thickness using OCT. A) En face image of the optic disc with the peripapillary scan circle. B) Cross-sectional OCT view of RNFL. C) Sectoral classification of RNFL thickness. D) RNFL thickness profile. G = global; INF = inferior; N = nasal; NAS = nasal; NI = nasal inferior; NS = nasal superior; OCT = optical coherence tomography; RNFL = retinal nerve fiber layer; SUP = superior; T = temporal; TI = temporal inferior; TMP = temporal; TS = temporal superior.
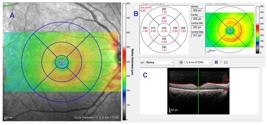
Measurement of macular thickness using OCT. A) Macular area. B) Automated thickness measurements of macula. C) Cross-sectional B-scan of macula. OCT = optical coherence tomography.
Statistical analysis
Data were analyzed using IBM SPSS Statistics for Windows, version 22. A power analysis was conducted using analysis of variance (ANOVA) to test the study’s main hypothesis. Based on an effect size of Cohen’s d = 0.27 – calculated from the findings of Kalender et al.15 – and assuming a significance level of α = 0.05 and power of 80%, a total sample size of 138 participants was determined to be necessary.
Descriptive statistics for categorical variables are presented as counts (n) and percentages (%). Comparisons between categorical variables were conducted using the chi-square test or Fisher’s exact test, as appropriate based on cell counts. For continuous variables, data are expressed as mean ± standard deviation (SD) or median (min-max), depending on the distribution. Normality was assessed using the Kolmogorov-Smirnov test, histograms, and Q-Q plots.
Correlations between continuous variables were evaluated using Pearson’s or Spearman’s correlation coefficients, depending on data distribution. Partial correlation analyses were performed to control for the effect of age. Levene’s test was used to assess homogeneity of variances across groups.
For comparisons involving three independent groups, one-way ANOVA was applied when the data were normally distributed; otherwise, the Kruskal-Wallis test was used. Post hoc comparisons following ANOVA were conducted using Tukey’s or Games-Howell tests, depending on the assumption of equal variances. For non-normally distributed data, the Dunn-Bonferroni test was used after the Kruskal-Wallis test to identify group differences. Multiple regression analysis was also performed to assess relationships among independent variables. A p-value < 0.05 was considered statistically significant.
Ethics statement
Ethical approval was obtained from the Clinical Research Ethics Committee of the Faculty of Medicine at Hitit University, Turkey (Approval No. 332, Date: 07.10.2020). The study was conducted in accordance with the principles of the Declaration of Helsinki. All participants provided written informed consent after being informed about the nature and objectives of the study.
Results
Data from 153 participants were included in the analysis: 50 (32.7%) with MDD, 51 (33.3%) with BD, and 52 (34.0%) individuals in the CG. Of the total sample, 55.6% (n=85) were female and 44.4% (n=68) were male. Gender distribution did not differ significantly among the groups (p=0.230). The overall mean age was 39.52 ± 11.51 years (range: 18-69), with no statistically significant difference in mean age between the groups (p = 0.173).
Sociodemographic and clinical characteristics across the groups are summarized in Table 1. Educational status, smoking habits, and family history of psychiatric illness were comparable between groups (p = 0.085, p = 0.224, and p = 0.371, respectively). However, the BD group had significantly longer illness duration as well as higher numbers of hospitalizations and episodes, compared to the MDD group (all p < 0.001).
Statistical findings for the comparison of sociodemographic and clinical characteristics between study groups
In the MDD group, 38 out of 50 patients were using one or more antidepressants, with selective serotonin reuptake inhibitors (SSRIs) being the most commonly prescribed. A total of 15 patients were also taking antipsychotic medications – primarily quetiapine – in addition to antidepressants. A total of 12 patients had a history of antidepressant use but were not receiving pharmacological treatment at the time of assessment.
In the BD group, 25 patients were using lithium, 16 were taking valproate, four were on both lithium and valproate, and 10 were not using any mood stabilizers. Additionally, 19 individuals with BD were using SSRIs and 23 were on antipsychotics alongside mood stabilizers.
Visual acuity and refraction values did not differ significantly among the groups (p = 0.141 and p = 0.188, respectively).
There were no statistically significant differences among the groups in the following ppRNFL regions: nasal-superior (NS), nasal-inferior (NI), nasal (N), temporal-superior (TS), temporal-inferior (TI), temporal (T), and global thickness (p > 0.05 for all comparisons) (Table 2).
Similarly, the following MAC parameters showed no significant group differences: inner superior (IS), inner nasal (IN), superior (DS), nasal (DN), temporal (DT), and inferior (DI) (p > 0.05 (Table 2).
However, significant differences were found in MAC central, MAC inner temporal (IT), and MAC inner inferior (II) thicknesses among the groups (p = 0.001, p < 0.001, and p < 0.001, respectively). Post hoc analysis revealed that the CG had significantly greater MAC central thickness compared to both the MDD (p = 0.039) and BD (p < 0.001) groups, while no significant difference was observed between the MDD and BD groups (p = 0.084).
MAC IT thickness in the CG was significantly greater than in both the MDD (p = 0.025) and BD (p < 0.001) groups. Additionally, MAC IT thickness in the MDD group was significantly higher than in the BD group (p = 0.046). For MAC II measurements, the CG also showed significantly higher values than the MDD (p = 0.003) and BD (p < 0.001) groups; however, there was no significant difference between the MDD and BD groups (p = 0.141).
There were no statistically significant differences among the groups in the following parameters: GCL central, GCL IS, GCL II, GCL DS, GCL DN, GCL DT, and GCL DI as well as IPL central, IPL IS, IPL IN, IPL IT, IPL II, IPL DS, IPL DN, IPL DT, and IPL DI (p > 0.05 for all comparisons; Table 3).
GCL IT thickness differed significantly among the study groups (p = 0.023). Post hoc analysis revealed that GCL IT measurements in the CG were significantly higher than those in both the MDD (p = 0.049) and BD (p = 0.044) groups. No significant difference was observed between the MDD and BD groups for GCL IT measurements (p > 0.05) (Table 3).
Findings from the correlation analysis between selected clinical variables and ocular measurements are presented in Table 4. A weak but statistically significant inverse correlation was found between age and the following parameters: ppRNFL global thickness (r = -0.256, p = 0.001), macular volume (r = -0.338, p = 0.001), GCL volume (r = -0.332, p = 0.001), and IPL volume (r = -0.236, p = 0.017). No significant association was found between age of onset and ppRNFL global thickness (p > 0.05).
However, weak inverse correlations were observed between age of onset and macular volume (r = -0.284, p = 0.004), GCL volume (r = -0.238, p = 0.016), and IPL volume (r = -0.222, p = 0.026). Nonetheless, after adjusting for age using partial correlation analysis, these associations were no longer statistically significant (p > 0.05 for all; Table 4).
No significant correlations were found between disease duration, number of hospitalizations, or number of episodes and any of the following: ppRNFL global thickness, macular volume, GCL volume, or IPL volume (p > 0.05) (Table 4).
The results of the correlation analysis conducted separately for the MDD and BD groups are presented in Table 5. In the MDD group, a weak but statistically significant inverse correlation was observed between age and ppRNFL global thickness (r = -0.300, p = 0.035).
A weak but statistically significant inverse correlation was found between age of onset and both macular volume (r = -0.323, p = 0.022) and GCL volume (r = -0.318, p = 0.025). However, after controlling for patient age using partial correlation analysis, these associations were no longer statistically significant (p > 0.05; Table 5). No significant associations were observed between disease duration, number of hospitalizations, number of episodes, and any ocular measurements (p > 0.05; Table 5).
In the BD group, age was inversely and significantly correlated with ppRNFL global thickness, macular volume, GCL volume, and IPL volume (r = -0.311, p = 0.027; r = -0.406, p = 0.003; r = -0.428, p = 0.002; and r = -0.297, p = 0.034, respectively). No significant associations were found between age of onset and ppRNFL global thickness or macular volume (p > 0.05). However, weak but statistically significant inverse correlations were observed between age of onset and both GCL volume (r = -0.322, p = 0.021) and IPL volume (r = -0.362, p = 0.009). These correlations also lost significance after controlling for patient age (p > 0.05; Table 5). No significant relationships were found between disease duration, number of hospitalizations, or number of episodes and any ocular measurements in the BD group (p > 0.05; Table 5).
The results of the multiple regression analysis are presented in Table 6. The initial model, which included group, age, and duration of illness, was statistically significant (p = 0.027). In this model, group and duration of illness were not significant predictors of ppRNFL global thickness (p = 0.575 and p = 0.797, respectively), while age was a significant predictor (p = 0.013). Consequently, a simplified regression model including only age was constructed and is shown in Table 6.
Discussion
As hypothesized at the outset of this study, we expected that longer disease duration would be associated with increased neurodegeneration and, consequently, with thinning of the RNFL. However, based on our regression analysis, age emerged as the only significant predictor of RNFL thinning, independent of diagnostic group (BD or MDD) or disease duration (Table 6). This finding aligns with prior meta-analyses conducted in BD and schizophrenia populations, which have yielded inconsistent results – some studies reporting a significant negative correlation between RNFL thickness and disease duration, while others have found no such association.22
The literature on OCT findings in patients with MDD and BD is notably heterogeneous. These discrepancies may stem from the complex pathophysiology of both disorders, involving processes such as neurodegeneration and neuroinflammation as well as variations in the clinical phase during which OCT measurements were taken (e.g., acute episode vs. remission), or the influence of psychotropic medications. Some studies have reported no significant differences in RNFL, GCL, or IPL thickness between patients with MDD and healthy controls.11,13 In contrast, others have demonstrated significantly thinner RNFL, GCL, and IPL layers in patients with BD compared to controls.23
A study comparing RNFL thickness across BD, MDD, and CG – without stratifying by clinical phase – found RNFL to be significantly thinner in the BD group compared to the MDD group.24 In our study, however, no significant differences in RNFL thickness were observed among the three groups (Table 2). This may be due to the relatively modest sample size or the fact that all patients were in remission at the time of evaluation.
Participants continued using antidepressants and mood stabilizers during the time of OCT assessment, which may have influenced the findings. The use of mood stabilizers or antipsychotics in patients with BD and antidepressants in patients with MDD could have exerted neuroprotective effects on retinal structures. Although disease duration, number of episodes, and number of hospitalizations were significantly higher in the BD group than in the MDD group, no corresponding differences were found in RNFL, GCL, or IPL thickness between the two groups.
Most patients with BD in our sample were being treated with lithium or valproate. Preclinical studies suggest these agents may have protective effects on retinal ganglion cells and optic nerves.14,25 However, results from animal models have not always been confirmed in human studies. For instance, a study in patients with BD found no significant relationship between RNFL thickness and variables such as disease duration, symptom severity, or current mood episode (e.g., depressive, manic, or remission). Nonetheless, differences were observed based on the specific mood stabilizer used, with lithium showing greater protective effects on RNFL compared to valproic acid.26
SSRIs, the most commonly used antidepressants, have also been implicated in retinal changes. Some reports suggest that prolonged SSRI use may lead to structural alterations in retinal layers such as the RNFL and GCL.27 Kalenderoğlu et al.,15 in a study comparing first-episode, drug-naïve patients and patients with recurrent MDD using antidepressants with healthy controls, reported significant OCT differences between both patient groups and controls. Interestingly, RNFL thickness in patients with recurrent MDD did not differ significantly from that in first-episode patients or in overall patients with MDD compared to controls. Moreover, the same study found no significant RNFL differences among patients with recurrent MDD based on whether they used antipsychotics, SSRIs, or serotonin-norepinephrine reuptake inhibitors. However, antipsychotic use was associated with a significant reduction in GCL volume.15
These findings suggest that psychotropic medications may influence retinal morphology and potentially mask underlying structural alterations related to the psychiatric condition itself. The neuroprotective or neurotoxic effects of these medications remain an area of ongoing debate, and further research is needed to clarify their impact on retinal structure.
A significant thinning was observed in the MAC central, MAC IT, and MAC II regions in both the BD and MDD groups compared to the CG. Additionally, the MAC IT thickness was significantly lower in the BD group compared to the MDD group (Table 2). In terms of GCL, only the GCL IT region was significantly thinner in both clinical groups compared to individuals in the CG, with no significant difference between the BD and MDD groups. No significant differences were found in IPL measurements among any of the groups. These findings may reflect distinct pathophysiological characteristics of each disorder.
Anatomically, the macula lutea contributes to the total retinal thickness, while the GCL and IPL represent specific retinal layers. The GCL consists of ganglion cell bodies, the IPL contains dendritic processes, and the RNFL is composed of ganglion cell axons.28 In a study examining drug-naïve, newly diagnosed patients with generalized anxiety disorder, significant thinning was observed in macular layers, but RNFL thickness did not differ from that of healthy controls.28
One of the most noteworthy findings in our study was the effect of age on OCT parameters in both MDD and BD groups. Although no significant differences were found between groups in overall macular, GCL, and IPL volumes, a significant negative correlation was observed between these volumes and both chronological age and age of disease onset across the entire sample (Tables 4 and 5). However, when controlling for age through partial correlation analysis, these associations were no longer statistically significant. This contrasts with earlier studies by highlighting that age may play a more dominant role than disease duration in driving neurodegenerative retinal changes – an aspect not addressed in prior research.
It is well established that RNFL, GCL, and IPL thickness decline progressively with age, with an estimated average loss of 1-2 µm per decade.29,30 Age-related degeneration involves numerous cellular mechanisms that contribute to the pathogenesis of neurodegenerative disorders.31 Thus, our findings regarding the impact of aging on retinal structures are consistent with the broader literature.
Kalenderoğlu, in two separate studies,15,23 reported significant negative correlations between disease duration and both GCL and IPL thickness in patients with BD and MDD. However, the role of age of onset was not considered. In contrast, Khalil et al.32 found no significant associations between OCT parameters and clinical variables such as disease duration or symptom severity in patients with BD. Importantly, disease duration is inherently age-related, and the failure to adjust for age in these studies may have introduced confounders.
To the best of our knowledge, this is the first study to compare OCT findings between patients with BD and MDD during remission as well as with individuals in a CG. Nevertheless, several limitations should be acknowledged. First, the cross-sectional design precludes causal inference. Second, the modest sample size and the heterogeneity of pharmacological treatment may have influenced the results. Third, axial length was not measured, which could potentially affect OCT parameters.
Although all patients were in remission, the concurrent use of psychotropic medications may have confounded OCT findings. The neuroprotective or neurotoxic effects of these drugs cannot be entirely ruled out. Moreover, most patients in chronic stages of BD or recurrent MDD are likely to have a history of psychotropic medication use, regardless of whether they were on treatment at the time of assessment. Therefore, even studies limited to medication-free participants may be subject to bias stemming from prior exposure.
The use of different classes of medications – lithium, valproate, or antipsychotics in patients with BD, and antidepressants in patients with MDD – limits direct comparisons between groups, both in terms of disease and pharmacological profiles. Further research with medication-naïve or stratified cohorts is warranted to clarify these effects. Nonetheless, despite the potential confounding effects of medication use, the inclusion of typical treatment profiles in our sample enhances the external validity of our findings, as it more accurately reflects the broader clinical population.
The strengths of this study include strict exclusion criteria, a well-powered design based on prior power analysis, and the use of detailed statistical comparisons across three age-, sex-, and smoking-matched groups.
In this study, no significant differences were observed among the MDD, BD, and CG in RNFL and IPL regions, nor in the overall volumes of the macula, GCL, and IPL. However, MAC measurements – specifically MAC central, MAC IT, and MAC II – were significantly reduced in both the MDD and BD groups compared to individuals in the CG. Notably, no significant differences were found between the MDD and BD groups in MAC central and MAC II measurements. Correlation and regression analyses indicated that disease duration and number of episodes were not significantly associated with OCT findings. These negative results may be due to the limited sample size, distinct etiological features of each disorder, and/or the influence of psychotropic medications. A key finding of this study is the prominent role of age in OCT parameters, suggesting that age may be a more critical factor than disease-specific variables in retinal structural changes. Given the chronic and multifactorial nature of both BD and MDD, and the absence of clearly defined disorder-specific neuroimaging markers, OCT may serve as a valuable adjunct tool in the longitudinal monitoring of neurodegeneration in psychiatric populations. Its non-invasive, reproducible nature allows for the detection of subtle structural alterations that may otherwise go unnoticed with conventional neuroimaging. To establish more definitive conclusions, future multicenter studies with larger, stratified cohorts and extended follow-up periods are needed. These studies should consider age-related effects and carefully control for medication use to further elucidate the potential role of OCT in the clinical assessment of BD and MDD.
Data availability statement
Data supporting the findings of this study are available from the corresponding author upon reasonable request.
References
-
1 Jain A, Mitra P. Bipolar disorder. In: StatPearls [Internet]. Treasure Island: StatPearls Publishing; 2024 [cited 2025 Sep 24].https://www.ncbi.nlm.nih.gov/books/NBK558998/
» https://www.ncbi.nlm.nih.gov/books/NBK558998/ - 2 Kessler RC. The costs of depression. Psychiatr Clin North Am.2012;35:1-14.
- 3 Abdoli N, Salari N, Darvishi N, Jafarpour S, Solaymani M, Mohammadi M, et al. The global prevalence of major depressive disorder (MDD) among the elderly: A systematic review and meta-analysis. Neurosci Biobehav Rev.2022;132:1067-73.
- 4 Takami H, Okamoto Y, Yamashita H, Okada G, Yamawaki S. Attenuated anterior cingulate activation during a verbal fluency task in elderly patients with a history of multiple-episode depression. Am J Geriatr Psychiatry.2007;15:594-603.
- 5 Han KM, Tae WS, Kim A, Kang Y, Kang W, Kang J, et al. Serum FAM19A5 levels: A novel biomarker for neuroinflammation and neurodegeneration in major depressive disorder. Brain Behav Immun.2020;87:852-9.
- 6 Machoy M, Seeliger J, Szyszka-Sommerfeld L, Koprowski R, Gedrange T, Woźniak K. The use of optical coherence tomography in dental diagnostics: a state-of-the-art review. J Healthc Eng.2017;2017:7560645.
- 7 Satue M, Obis J, Rodrigo MJ, Otin S, Fuertes MI, Vilades E, et al. Optical coherence tomography as a biomarker for diagnosis, progression, and prognosis of neurodegenerative diseases. J Ophthalmol.2016;2016:8503859.
- 8 Tan A, Schwitzer T, Conart JB, Angioi-Duprez K. Study of retinal structure and function in patients with major depressive disorder, bipolar disorder or schizophrenia: A review of the literature. J Fr Ophtalmol.2020;43:e157-66.
- 9 Kennedy KG, Mio M, Goldstein BI, Brambilla P, Delvecchio G. Systematic review and meta-analysis of retinal microvascular caliber in bipolar disorder, major depressive disorder, and schizophrenia. J Affect Disord.2023;331:342-51.
- 10 Mirzaei M, Gupta VB, Chick JM, Greco TM, Wu Y, Chitranshi N, et al. Age-related neurodegenerative disease associated pathways identified in retinal and vitreous proteome from human glaucoma eyes. Sci Rep.2017;7:12685.
- 11 Yıldız M, Alim S, Batmaz S, Demir S, Songur E, Ortak H, et al. Duration of the depressive episode is correlated with ganglion cell inner plexiform layer and nasal retinal fiber layer thicknesses: Optical coherence tomography findings in major depression. Psychiatry Res Neuroimaging.2016;251:60-6.
- 12 Gokcinar NB, Buturak SV, Ozkal F, Ozcicek G, Yumusak ME, Turgal E. Optical coherence tomography neurodegenerative findings in patients with bipolar disorder. Asia Pac Psychiatry.2020;12:e12394.
- 13 Schönfeldt-Lecuona C, Schmidt A, Kregel T, Kassubek J, Dreyhaupt J, Freudenmann RWet al. Retinal changes in patients with major depressive disorder: a controlled optical coherence tomography study. J Affect Disord.2018;227:665-71.
- 14 Liu Q, Li H, Yang J, Niu X, Zhao C, Zhao L, et al. Valproic acid attenuates inflammation of optic nerve and apoptosis of retinal ganglion cells in a rat model of optic neuritis. Biomed Pharmacother.2017;96:1363-70.
- 15 Kalenderoglu A, Çelik M, Sevgi-Karadag A, Egilmez OB. Optic coherence tomography shows inflammation and degeneration in major depressive disorder patients correlated with disease severity. J Affect Disord.2016;204:159-65.
- 16 Ong YT, Hilal S, Cheung CY, Venketasubramanian N, Niessen WJ, Vrooman H, et al. Retinal neurodegeneration on optical coherence tomography and cerebral atrophy. Neurosci Lett.2015;584:12-6.
- 17 Elbir M, Topbaş ÖA, Bayad S, Kocabaş T, Topak OZ, Çetin Ş, et al. DSM-5 Bozuklukları için Yapılandırılmış Klinik Görüşmenin Klinisyen Versiyonunun Türkçeye Uyarlanması ve Güvenilirlik Çalışması. Turk Psikiyatri Derg.2019;30:51-6.
- 18 Hamilton M. A rating scale for depression. J Neurol Neurosurg Psychiatry.1960;23:56-62.
- 19 Akdemir A, Örsel S, Dağ İ, Türkçapar HM, İşcan N, Özbay H. Hamilton Depresyon Derecelendirme Ölçeği (HDDÖ)’nin geçerliği, güvenirliği ve klinikte kullanımı. Psikiyatr Psikol Psikofarmakol Derg.1996;4:251-9.
- 20 Young RC, Biggs JT, Ziegler VE, Meyer DA. A rating scale for mania: reliability, validity and sensitivity. Br J Psychiatry.1978;133:429-35.
- 21 Karadağ F, Oral T, Yalçin FA, Erten E. Young mani derecelendirme ölçeğinin Türkiye’de geçerlik ve güvenilirliği. Turk Psikiyatri Derg.2002;13:107-14.
- 22 Lizano P, Bannai D, Lutz O, Kim LA, Miller J, Keshavan M. A meta-analysis of retinal cytoarchitectural abnormalities in schizophrenia and bipolar disorder. Schizophr Bull.2020;46:43-53.
- 23 Kalenderoglu A, Sevgi-Karadag A, Celik M, Egilmez OB, Han-Almis B, Ozen ME. Can the retinal ganglion cell layer volume be a new marker to detect neurodegeneration in bipolar disorder? Compr Psychiatry.2016;67:66-72.
- 24 Liu Y, Tong Y, Huang L, Chen J, Yan S, Yang F, et al. Factors related to retinal nerve fiber layer thickness in bipolar disorder patients and major depression patients. BMC Psychiatry.2021;21:301.
- 25 Azuchi Y, Kimura A, Guo X, Akiyama G, Noro T, Harada C, et al. Valproic acid and ASK1 deficiency ameliorate optic neuritis and neurodegeneration in an animal model of multiple sclerosis. Neurosci Lett.2017;639:82-7.
- 26 Kurt A, Zor KR, Yıldırım Biçer G, Küçük E, Erşan EE. Optical coherence tomography findings in bipolar disorder patients and the related factors. Psychiatry Clin Psychopharmacol.2023;33:254-63.
- 27 Agarwal A, Aggarwal K, Kumar A, Gupta V. Bilateral cystoid macular edema misdiagnosed as pars planitis in a patient on sertraline therapy. Am J Ophthalmol Case Rep.2018;11:135-8.
- 28 Ozisik GG, Kiraz S. Evaluation of retinal thickness measured by optical coherence tomography in patients with generalized anxiety disorder. Photodiagnosis Photodyn Ther.2023;44:103766.
- 29 Leung CK, Yu M, Weinreb RN, Ye C, Liu S, Lai G, et al. Retinal nerve fiber layer imaging with spectral-domain optical coherence tomography: a prospective analysis of age-related loss. Ophthalmology.2012;119:731-7.
- 30 Chauhan BC, Vianna JR, Sharpe GP, Demirel S, Girkin CA, Mardin CY, et al. Differential effects of aging in the macular retinal layers, neuroretinal rim, and peripapillary retinal nerve fiber layer. Ophthalmology.2020;127:177-85.
- 31 Hou Y, Dan X, Babbar M, Wei Y, Hasselbalch SG, Croteau DL, et al. Ageing as a risk factor for neurodegenerative disease. Nat Rev Neurol.2019;15:565-81.
- 32 Khalil MA, Saleh AA, Gohar SM, Khalil DH, Said M. Optical coherence tomography findings in patients with bipolar disorder. J Affect Disord.2017;218:115-22.
-
How to cite this article:
Kiraz S, Gökgöz Özışık G. Comparison of optical coherence tomography findings in patients with major depressive disorder and bipolar disorder in remission. Braz J Psychiatry. 2026;48:e20254295. http://doi.org/10.47626/1516-4446-2025-4295
Edited by
-
Handling Editor:
Ives Passos


