 Correlation and path analysis based on multi-trait BLUP as selection criteria for forage in Paspalum nicorae Parodi
ABSTRACT
The objective of this study was to evaluate the associations among forage production related traits in Paspalum nicorae Parodi ecotypes and employ BLUP multi-trait path analysis as a selection criterion. Eighty-four ecotypes were grown in a randomized block experimental design with four replications and measured for three years. Measurements included number of tillers, fresh matter, leaf dry matter, stem dry matter, inflorescence dry matter, total dry matter, leaf:stem ratio, harvest index, cold tolerance, forage persistence, growth habit, and plant height. Variance components were estimated using maximum residual likelihood, and genetic correlation coefficients were obtained from the output of a mixed model. Subsequently, path analysis was performed, which used total dry matter as the dependent trait. Total dry matter showed positive and significant associations with most of the traits studied. This meant that indirect selection based on the number of tillers, height, and total fresh matter was a viable method to select for increased dry matter production. Multi-trait path analysis based on BLUP proved to be useful for studying associations between traits related to total dry matter and demonstrated that leaf dry matter has the greatest direct effect on total dry matter.
Keywords
Brunswick grass; genetic correlation; mixed models; native grass
1. Introduction
The Pampa biome is noted for its richness in botanical diversity and the abundance of forage species that provide high-quality feed for grazing herbivores. Within this context, the genus Paspalum L. (Paniceae, Panicoideae) stands out as one of the largest among angiosperms, encompassing between 310 and 400 species distributed across tropical and subtropical environments (Sartor et al., 2009; Soreng et al., 2022). Within this, the Plicatula group comprises approximately 30 species, most of which are tetraploid and reproduce through obligate apomixis via apospory, parthenogenesis, and pseudogamy (Burson and Bennett, 1970; Ortiz et al., 2013). Among them, Paspalum nicorae Parodi—also referred to as Paspalum lepton and commonly known as “grama cinzenta” or “brunswick grass”—is naturally distributed across eastern Paraguay, northwestern Argentina, Uruguay, and southern Brazil (Novo et al., 2019). It is a perennial, summer-active C4 species that forms dense clumps with short, oblique or vertical rhizomes. Its sterile glumes and lemmas are typically intensely pubescent or albo-pilose (Barreto, 1974). Paspalum nicorae is commonly found in sandy soils and is noted for its drought tolerance and capacity to thrive in less fertile environments (Nabinger and Dall’Agnol, 2020). Several authors have emphasized the species’ potential as a forage resource for genetic improvement, both as animal feed and for use in land restoration and conservation efforts in degraded areas (Burson and Bennett, 1970; Boldrini, 2006; Dall’Agnol et al., 2006).
Previous experiments on this species showed that a notable number of the evaluated accessions produced superior total dry matter (TDM) and leaf dry matter (LDM) yields compared with accessions of P. guenoarum and the commercial P. notatum cultivar Pensacola (Pereira et al., 2011). These same authors reported that the crude protein content of most accessions was comparable to that of cv. Pensacola and superior to that of the P. guenoarum accessions evaluated. In more recent studies, ecotypes of P. nicorae produced more TDM than ecotypes of P. notatum, P. urvillei, P. denticulatum, and P. pauciciliatum, and its TDM was also similar to some ecotypes of P. guenoarum (Graminho et al., 2017). Although P. nicorae has agronomic importance, its genetic improvement is still incipient. Thus, breeding programs and strategies must be developed to focus on high yield potential, superior forage quality, and seed production.
The objective of genetic improvement for forage plants within these environments is generally to develop a cultivar with high yield and nutritional value, which is both persistent and adapted to low-fertility soils (Basso et al., 2009). However, selection based solely on TDM production is often unwise. In plant breeding programs, it is crucial to understand the linear associations between traits, especially when the program aims for simultaneous trait selection. This is particularly relevant when the main trait has low heritability or is difficult to measure (Cruz et al., 2012; Toebe et al., 2019). Therefore, it is necessary to understand the associations between TDM production and the other components of forage yield. The correlation can be of a phenotypic, genotypic, or environmental nature, but only genotypic correlations have a heritable nature, which makes them of greater interest for improvement (Lynch and Walsh, 1998). Genetic correlation is primarily caused by pleiotropy, and then by gene linkage, which is temporary (Falconer and Mackay, 1996). Given the high association among forage traits, which determine forage production, statistical techniques must be used to help better understand the source of the associations among traits. This allows contributions of each trait in the association of interest to be determined by path analysis and allocated as direct or indirect (Wright, 1921; Cruz et al., 2014).
Thus, the objective of this study is to evaluate the associations among traits related to forage production in P. nicorae Parodi ecotypes and to employ path analysis, based on multi-trait BLUP as a selection criterion, to identify the main traits related to forage performance.
2. Material and methods
2.1. Experimental site
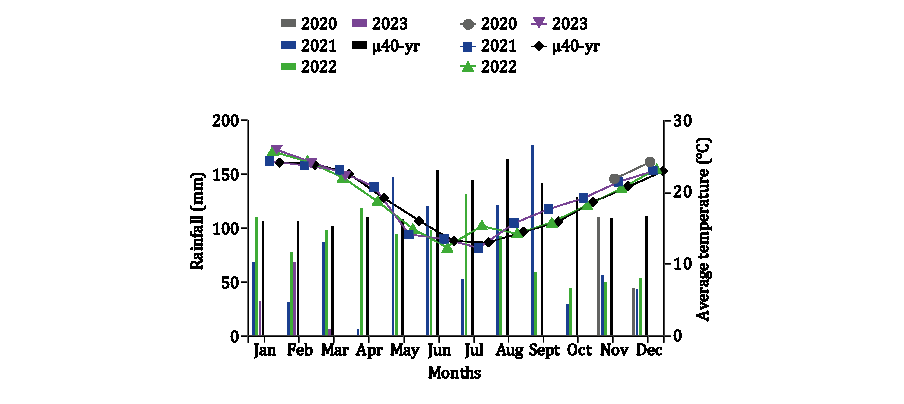
The experiment was conducted at the Agricultural Experimental Station of the Universidade Federal do Rio Grande do Sul (UFRGS), Porto Alegre, Rio Grande do Sul, Brazil, in an experimental area belonging to the Departamento de Plantas Forrageiras e Agrometeorologia (DPFA), at 46 m altitude, latitude 30°05'22" S and longitude 51°39'08" W. The soil is classified as an Ultisol (USDA Soil taxonomy; Santos et al., 2018) and the climate in the region is classified as Cfa (temperate climate, with rainfall all year round, and hot summer) based on the Köppen classification (Moreno, 1961). The long-term (40 yr) average maximum monthly air temperature was 30.2 °C in January and the minimum average monthly air temperature was 8.5 °C in July. Long-term average annual precipitation is ~1450 mm (Bergamaschi et al., 2013). Figure 1 shows the average monthly air temperature and precipitation during the experiment (November 2020 to February 2023).
Rainfall (mm; bars) (left) and mean air temperature (°C; lines) (right) during the experimental period compared with the historical long-term average (1969-2019).
Irrigation was applied to return the soil to field capacity, with 40 mm water applied per irrigation event. Over the three years, 2,880 mm of irrigation was applied.
2.2. Plant material
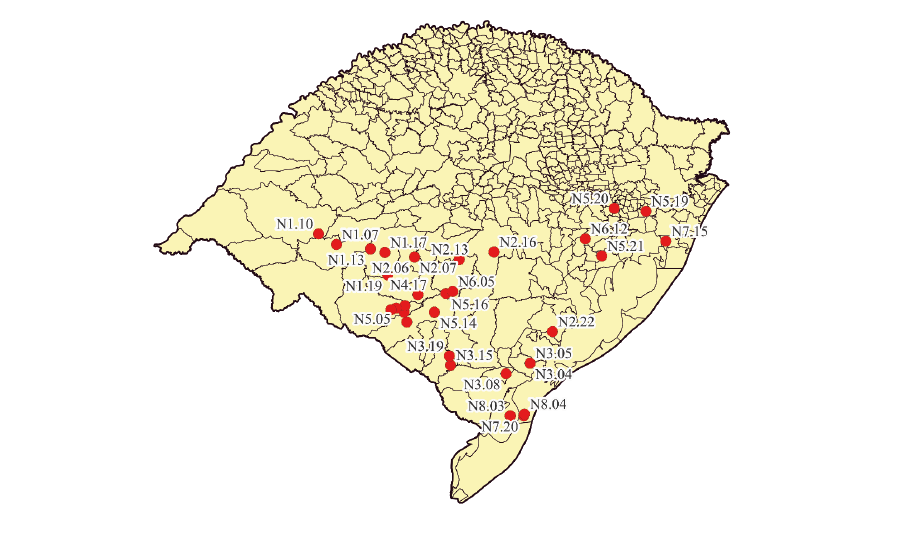
The studied population was composed of ecotypes of P. nicorae Parodi collected in four physiographic regions of Rio Grande do Sul (Figure 2). These ecotypes are part of the P. nicorae Parodi Germplasm Bank of the UFRGS Forage Plant Improvement Program (Table 1).
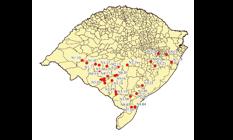
Location of collection points for P. nicorae Parodi ecotypes in Rio Grande do Sul, Brazil, 2019.
2.3. Experimental design
The experiment consisted of 84 ecotypes arranged in a randomized block design with four replicates.
2.4. Establishment
In October 2020, the experimental area was desiccated, and soil samples were collected to verify its chemical characteristics. Soil samples (0–0.2 m) were collected and analyzed before sowing the experiment, and nutritional deficiencies were corrected in accordance with the Soil Chemistry and Fertility Commission (CQFS-RS/SC, 2016) recommendations. At the end of each agricultural year, soil analysis tests were repeated, and depleted nutrients replaced (Table 2). The pH of the experimental area was corrected with the incorporation of 3.4 t/ha dolomitic limestone, with 80% total neutralization relative power, prior to establishment. A 8-20-20 N-P-K fertilizer was applied at 950 kg ha1 in the first year and 650 kg ha1 in the second and third years. This was applied in split applications after each cut, in accordance with technical recommendations for perennial grasses (CQFS-RS/SC, 2016).
The 84 ecotypes were planted in the field as seedlings. In 2020, the seeds of P. nicorae Parodi ecotypes, sourced from the Germplasm Bank of the UFRGS Forage Plant Improvement Program (Table 1), were placed on filter paper moistened with a KNO3 solution (0.2%) in a plastic gerbox (11 × 11 × 3.5 cm) (Brasil, 2009). The plates were kept moist for 28 days under controlled conditions in a growth chamber: 16 h of light at 30 °C and 8 h of darkness at 30 °C (Brasil, 2009). When the seedlings produced their first fully expanded leaf, they were transferred to tubes with commercial Carolina Soil™ substrate composed of peat, vermiculite, organic waste, and limestone.
Seedlings were transplanted into tubes (plant) using a manual planter on November 25, 2020. The experimental units were individual plants, sown on the square 1 m apart in the row and column. The area was kept free of weeds by hand rogueing, and whenever necessary, insecticides (thiamethoxam + lambda –cyhalothrin; Engeo Pleno®, 400 mL/ha) were applied.
2.5. Traits
The traits measured in the experiment included number of tillers per plant (NT, tillers plant1), fresh matter (FM, g FM plant1), TDM (g TDM plant1), LDM (g LDM plant1), stem dry matter (SDM, g SDM plant1), inflorescence dry matter (IDM, g IDM plant1), leaf:stem ratio (LSR), harvest index (HI), cold tolerance (CT), forage persistence (FP), growth habit (GH), and plant height (PH, cm).
The evaluations were carried out through cuts over three years. Harvests occurred whenever the height of the plants reached 30 ± 2.5 cm, and plants were cut to a residual height of 10 cm. In the first year, two cuts were made (01/15/2021 and 02/19/2021). In the second year, there were six cuts (10/28/2021, 11/20/2021, 12/22/2021, 01/18/2022, 02/05/2022, and 03/07/2022). Finally, in the third year, five cuts were made (11/01/2022, 11/30/2022, 12/23/2022, 01/16/2023, and 01/19/2023).
At each harvest, the NT were counted. After cutting, the samples were taken to the laboratory for morphological separation into leaf (leaf blades), stem (culms plus sheaths), and inflorescence components. Samples were then dried in a forced air oven at 65 °C until constant weight to quantify TDM, LDM, SDM, and IDM. The LSR was calculated as LDM/(LDM+SDM). The HI was calculated as LDM/TDM. Growth habit was evaluated through visual assessment of the type of plant. The scale had four classes from 1 to 4, in which 1 was assigned to erect, 2 to semi-erect, 3 to semi-prostrate, and 4 for prostrate plants. Plant height was measured from ground level to average plant height using a ruler graduated in centimeters.
During winter, visual grades on a scale of 1 to 5 were assigned for cold tolerance to quantify the effect of frost. A value of 1 indicates susceptible plants (totally senesced) and 5 indicates resistant plants (totally green). The assessment of ecotype survival was carried out at the end of winter. All plants were evaluated using visual notes, a value of 1 was assigned to plants that were alive and 0 to those that had died.
2.6. Statistical analysis
Estimates of variance components and prediction of genetic values were carried out using the restricted maximum likelihood (REML)/best linear unbiased prediction (BLUP) methodology. The model used is for experiments in complete randomized blocks, a single location, several harvests, and one observation per plot. Thus, the statistical model used was:
in which y is the data vector, m is the vector of the effects of measurement-repetition combinations (assumed to be fixed) added to the general average, g is the vector of genotypic effects (assumed to be random), p is the vector of permanent environmental effects (plots in this case, assumed to be random), i is the vector of the effects of the genotype × measurements interaction, and e is the (random) residue vector. The capital letters (X, Z, W, and T) are the incidence matrices for the effects. The significance of the model effects was tested via the likelihood ratio test (Rao, 1973), using the Chi-square statistic with one degree of freedom and at the 5% probability level.
The mixed model equations are equivalent to:
in which
Individual heritability in the broad sense (h2) within the block is given by:
The individual repeatability (ρ) in the block is given by:
The coefficient of determination of the permanent effects (P2) is given by:
The common environmental correlation (c2) between plots is given by:
The iterative estimators of the variance components in REML were obtained using the Expectation-Maximization (EM) algorithm (Dempster et al., 1977):
in which C22, C33, and C44 come from:
in which C = matrix of coefficients of the mixed model equations, tr = matrix dash operator, r(X) = rank of matrix X, N = total number of data, q = number of individuals, and s = number of genotypes × harvests.
The genetic correlation coefficients among traits were obtained via multi-trait BLUP, based on the following expression:
in which COVg (XY) is the genetic covariance between traits x and y; σ2g (X)is the genetic variance of trait X, and σ2g (Y) is the genetic variance of trait Y. The significance of rg was tested by t-test at 0.05, 0.01, and 0.001% probability levels, with n-2 degrees of freedom, between all pairs of combinations. The magnitudes of the correlation coefficients were classified according to Silveira et al. (2021), with r = 0 considered null, r = 0 to 0.30 considered weak, r = 0.30 to 0.60 considered medium, r = 0.60 to 0.90 considered strong, r = 0.90 to 1 considered very strong, and r = 1 considered perfect.
Next, the multicollinearity diagnosis was carried out involving the traits studied through the analysis of the condition number (CN), which represents the ratio between the highest and lowest eigenvalue of the genetic correlation matrix. Based on Montgomery et al. (2021), if CN<100, the collinearity is considered weak; if 100<CN<1,000, the collinearity is considered moderate to strong; and if CN>1,000, the collinearity is considered severe. Once multicollinearity was verified, a path analysis was carried out under multicollinearity, with all variables studied. The path analysis, with TDM as the main dependent variable, was carried out using the following equation:
in which β1, β2, ..., β9 are the estimators of the direct effect of forage traits (NT, FM, LDM, SDM, IDM, TDM, LSR, CT, GH, and PH) about TDM and e is the residual effect of the analysis. The system of normal equations was used to estimate the direct and indirect effects of each explanatory variable on TDM, through the following expression:
The coefficient of determination (R2) of the path analysis was obtained through the equation:
The residual effect of the path analysis was obtained through the equation:
All data were analyzed using the R software (R Core Team, 2023) with the metan (Olivoto and Lúcio, 2020) and qgraph (Epskamp et al., 2012) packages.
3. Results
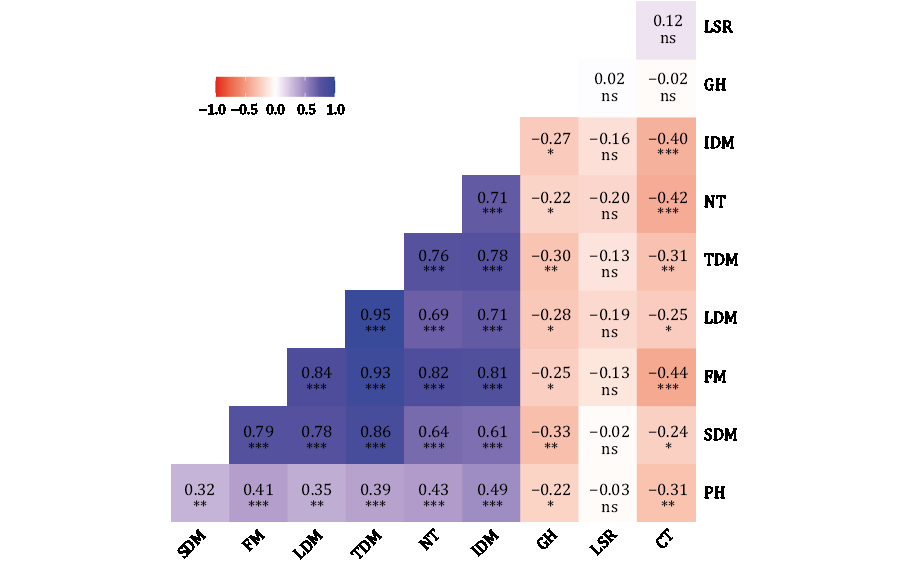
The analysis quantified genetic associations among forage traits (Figure 3). This made it possible to identify the direction and magnitude of the influences of one trait on another and provided an indication of a simple association among the analyzed traits. The t-test identified significant associations, in which values greater than 0.20 indicated a genetic association between forage traits. However, the LSR trait did not show a significant association (P>0.05) with any of the forage traits studied.
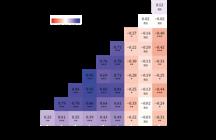
Estimates of genetic correlations between forage production traits in P. nicorae Parodi ecotypes via BLUP.
SDM - stem dry matter; FM - fresh matter; LDM - leaf dry matter; TDM - total dry matter; NT - number of tillers; IDM - inflorescence dry matter; GH - growth habit; LSR - leaf:stem ratio; CT - cold tolerance; PH - plant height.
Significance levels: ns = P>0.05; *P<0.05; ** P<0.01; and ***P<0.001.
Total dry matter is the most important trait in the process of selecting superior genotypes in forage species. Positive and significant associations were observed with LDM (r = 0.95, P<0.001), FM (r = 0.93, P<0.001), SDM (r = 0.86, P<0.001), IDM (r = 0.78, P<0.001), NT (r = 0.76, P<0.001), and PH (r = 0.39, P<0.001). However, negative associations were observed between TDM and CT (r = −0.31, P<0.01) and GH (r = −0.30, P<0.01). These results indicated that when selecting P. nicorae ecotypes for greater dry matter production, there will be a corresponding increase in LDM production, with a high magnitude and significant association (Figure 3). Therefore, LDM is another important forage trait, which was shown to have positive and significant associations with FM (r = 0.84, P<0.001), SDM (r = 0.78, P<0.001), IDM (r = 0.71, P<0.001), NT (r = 0.69, P<0.001), and PH (r = 0.35, P<0.01). The high associations indicated that changes in LDM, via selection, promoted significant positive changes in other traits. Cold tolerance had negative and significant associations with FM (r = −0.44, P<0.001), NT (r = −0.42, P<0.001), TDM (r = −0.31, P<0.01), PH (r = −0.31, P<0.01), LDM (r = −0.25, P<0.01), and SDM (r = −0.24, P<0.01). This indicated that P. nicorae ecotypes, which demonstrated greater ability to tolerate cold temperatures, tended to have reduced performance of these traits. This suggested that in colder conditions, plants may prioritize energy conservation and cold resistance over vegetative growth.
The subsequent path analysis considered TDM as the main dependent trait and the other traits as explanatory (Table 3) to identify the specific contributions of each variable to the total effect. This helps understand the cause-and-effect relationships between variables and determine which factors have the greatest impact on a specific characteristic.
With a CN of 238.44, a path analysis was required to address multicollinearity in the explanatory trait matrix, which included all forage traits. By introducing the constant k (0.10) in the diagonal matrix, the correlation between the variables decreased, allowing the inverse estimation of the matrix. This made it possible to include all traits in the analysis, without introducing any bias into the estimators. The coefficient of determination reached 94%, which highlighted that the set of traits used in this study explained most of the variation observed in dry matter production. A high R2 estimate, together with a low residual value (0.25), demonstrated high reliability of the data set and its direct and indirect cause-and-effect relationships.
Except for LSR and CT, the direct effects had the same sign as the correlations. Traits NT, FM, LDM, SDM, IDM, and PH showed positive correlation and direct effects. However, only LDM, NT, PH, and FM showed positive direct effects greater than the residual variable (0.25), which indicated that truncated selection based on these traits can provide a satisfactory gain in TDM production. Cold tolerance had a negative correlation and a positive direct effect, which indicated the correlation was caused by indirect effects, and that the LDM trait had a greater indirect contribution.
4. Discussion
Genetic correlation revealed significant relationships among traits (Figure 3) and supports this analysis as a crucial tool in future breeding programs to allow multi-trait selection for the improvement of P. nicorae. This is because genetic correlation can show the possible consequences of prioritizing a certain trait over another and highlights the cause-and-effect relationships that selection can trigger. Understanding the relationships between productive, structural, and chemical variables is critical for the success of the program and will help to develop commercial cultivars with superior yield and quality (Souza et al., 2021).
As TDM is the sum of its components, such as the NT, LDM, SDM, and IDM, it is common to observe a high magnitude association between these traits. The results revealed a strong genetic correlation between FM and LDM and a very strong correlation between TDM and LDM (Figure 3). These traits have also previously been found to have high associations in species including Penisetum purpureum (Silva et al., 2008), Brachiaria brizantha (Basso et al., 2009), Brachiaria ruziziensis (Borges et al., 2011), P. plicatulum × P. guenoarum hybrids (Motta et al., 2016), P. notatum hybrids (Weiler et al., 2018; Barbosa et al., 2019; Machado et al., 2021), and Urochloa hybrids (Gouveia et al., 2020). This confirmed that changes in one trait, via selection, promote significant changes in other traits in the form of a correlated response (Basso et al., 2009; Borges et al., 2011).
The NT and FM traits had significant positive associations, varying from medium to high magnitude, with FM, LDM, SDM, IDM, and TDM (Figure 3). Yield measurements are an effective, and commonly used method, to speed up evaluations, reduce costs, and expand the evaluation of a greater number of genotypes. This considerably increases the chances of identifying and selecting superior genotypes (Ramalho et al., 2020; Borges et al., 2011). These results are especially valuable in the early stages of genetic improvement programs, wherein many genotypes are often evaluated (Souza-Sobrinho et al., 2004).
Plant height is an important trait in the genetic improvement of forage plants, as it is directly related to forage production (Borges et al., 2011; Machado et al., 2021); however, this does not apply to plants with a more prostrate growth habit. In this study, PH had a positively significant but medium-magnitude association with FM, LDM, SDM, IDM, and TDM forage traits (Figure 3). These results corroborate the research by Machado et al. (2021), in which plant height can be explored as an indirect and non-invasive indicator to estimate yield (Souza et al., 2021). In this context, correlations between forage production and morphological traits, such as PH, offer a valuable approach for the identification and indirect selection of superior ecotypes (Annicchiarico et al., 2011; 2015).
Due to the large number of significant associations between forage traits (Figure 3), moderate to strong multicollinearity was detected based on the classification proposed by Montgomery et al. (2021). It is advisable to eliminate interrelated traits or analyze the effects of collinearity (Carvalho and Cruz, 1996; Resende, 2007). By identifying and addressing this phenomenon, it is possible to ensure more accurate interpretations of the relationships between variables, avoiding distortions in the results and strengthening the statistical basis of the study. Problems of multicollinearity were expected because the traits are biologically dependent (Borges et al., 2011). With a R2 of 0.94 and a residual effect of 0.25, it was found that the variation in the dependent trait (TDM) was largely related to variations in the explanatory traits (Table 3).
Notably, variations in TDM were predominantly associated with LDM, NT, PH, and FM. These traits showed a strong correlation and had a greater direct influence on TDM compared with the other variables measured, which had weaker direct effects than the residual effect (Table 3). The identification of traits strongly correlated with the trait of interest is fundamental in genetic improvement, especially those that have more favorable direct effects for selection as this allows an effective approach through indirect selection (Cruz et al., 2012). The results presented here showed that indirect selection based on LDM, NT, PH, and FM proved to be a viable and advantageous method for selection of material to increase dry matter production. Additionally, it offered the practicality of measuring the NT and PH as selection criteria. Finally, the correlation analysis revealed significant and relevant associations between most traits. This suggested that early selection of superior ecotypes can be conducted based on FM, NT, and PH, which are quick and easy measurements especially when evaluating a large number of genotypes. However, due to the large number of significant associations, its effectiveness proved to be limited, requiring the application of more sophisticated methods for ecotype selection. Subsequent path analysis identified that LDM exerts the greatest direct effect on TDM production in P. nicorae ecotypes. Therefore, indirect selection for TDM is possible if the trait is targeted for improvement during the selection of superior ecotypes within the species.
5. Conclusions
Correlation analysis showed that early selection of superior ecotypes in Paspalum nicorae Parodi can be effective based on fresh matter, number of tillers, and plant height. Path analysis revealed that selection based on total dry matter was positively correlated with a substantial increase in leaf dry matter production. These results highlighted the fundamental importance of this strategy to improve the productivity of Paspalum nicorae and provides valuable insights to guide future genetic improvement programs.
References
-
Annicchiarico, P.; Barrett, B.; Brummer, E. C.; Julier, B. and Marshall, A. H. 2015. Achievements and challenges in improving temperate perennial forage legumes. Critical Reviews in Plant Sciences 34:327-380. https://doi.org/10.1080/07352689.2014.898462
» https://doi.org/10.1080/07352689.2014.898462 -
Annicchiarico, P.; Pecetti, L.; Abdelguerfi, A.; Bouizgaren, A.; Carroni, A. M.; Hayek, T.; Bouzina, M. M. and Mezni, M. 2011. Adaptation of landrace and variety germplasm and selection strategies for lucerne in the Mediterranean basin. Field Crops Research 120:283-291. https://doi.org/10.1016/j.fcr.2010.11.003
» https://doi.org/10.1016/j.fcr.2010.11.003 -
Barbosa, M. R.; Motta, E. A. M.; Machado, J. M.; Krycki, K. C.; Conterato, I. F.; Weiler, R. L.; Dall'Agnol, M. and Simioni, C. 2019. Herbage accumulation of bahiagrass hybrids in two different environments in southern Brazil. Pesquisa Agropecuária Gaúcha 25:58-69. https://doi.org/10.36812/pag.2019251/258-69
» https://doi.org/10.36812/pag.2019251/258-69 - Barreto, I. L. 1974. O gênero Paspalum (Gramineae) no Rio Grande do Sul. Tese (Livre Docência). Universidade Federal do Rio Grande do Sul, Porto Alegre.
-
Basso, K. C.; Resende, R. M. S.; Valle, C. B.; Gonçalves, M. C. and Lempp, B. 2009. Avaliação de acessos de Brachiaria brizantha Stapf e estimativas de parâmetros genéticos para caracteres agronômicos. Acta Scientiarum. Agronomy 31:17-22. https://doi.org/10.4025/actasciagron.v31i1.6605
» https://doi.org/10.4025/actasciagron.v31i1.6605 -
Bergamaschi, H.; Melo, R. W.; Guadagnin, M. R.; Cardoso, L. S.; Silva, M. I. G.; Comiran, F.; Dalsin, F.; Tessari, M. L. and Brauner, P. C. 2013. Boletins Agrometeorológicos da Estação Experimental Agronômica da UFRGS. UFRGS, Porto Alegre. 8p. Available at: <https://www.ufrgs.br/agronomia/joomla/files/EEA/Srie_Meteorolgica_da_EEA-UFRGS.pdf> Accessed on: Sept. 1, 2023.
» https://www.ufrgs.br/agronomia/joomla/files/EEA/Srie_Meteorolgica_da_EEA-UFRGS.pdf> - Boldrini, I. I. 2006. Biodiversidade dos Campos Sulinos. In: Anais do I Simpósio de Forrageiras e Produção Animal Dall'Agnol, M.; Nabinger, C.; Rosa, L. M.; Silva, J. L. S.; Santos, D. T. and Santos, R. J., eds. Faculdade de Agronomia, UFRGS, Porto Alegre.
-
Borges, V.; Souza Sobrinho, F.; Lédo, F. J. S. and Kopp, M. M. 2011. Associação entre caracteres e análise de trilha na seleção de progênies de meios-irmãos de Brachiaria ruziziensis. Revista Ceres 58:765-772. https://doi.org/10.1590/S0034-737X2011000600013
» https://doi.org/10.1590/S0034-737X2011000600013 -
Brasil. 2009. Ministério da Agricultura, Pecuária e Abastecimento. Regras para análise de sementes. Ministério da Agricultura, Pecuária e Abastecimento. Secretaria de Defesa Agropecuária, Brasília. Available at: <https://www.gov.br/agricultura/pt-br/assuntos/insumos-agropecuarios/arquivos-publicacoes-insumos/2946_regras_analise__sementes.pdf> Accessed on: Aug. 07, 2024.
» https://www.gov.br/agricultura/pt-br/assuntos/insumos-agropecuarios/arquivos-publicacoes-insumos/2946_regras_analise__sementes.pdf> -
Burson, B. L. and Bennett, H. W. 1970. Cytology, method of reproduction, and fertility of Brunswickgrass, Paspalum nicorae Parodi. Crop Science 10:184-187. https://doi.org/10.2135/cropsci1970.0011183X001000020021x
» https://doi.org/10.2135/cropsci1970.0011183X001000020021x - Carvalho, S. P. and Cruz, C. D. 1996. Diagnosis of multicollinearity: assessment of the condition of correlation matrices used in genetic studies. Brazilian Journal of Genetics 19:479-484.
- CQFS-RS/SC - Comissão de Química e Fertilidade do Solo - RS/SC. 2016. Manual de calagem e adubação para os Estados do Rio Grande do Sul e de Santa Catarina. Sociedade Brasileira de Ciência do Solo - Núcleo Regional Sul. Comissão de Química e Fertilidade do Solo - RS/SC, Porto Alegre.
- Cruz, C. D.; Regazzi, A. J. and Carneiro, P. C. S. 2012. Modelos biométricos aplicados ao melhoramento genético. UFV, Vicosa, MG.
- Cruz, C. D.; Carneiro, P. C. S. and Regazzi, A. J. 2014. Modelos biométricos aplicados ao melhoramento genético. UFV, Viçosa, MG.
- Dall'Agnol, M.; Steiner, M. G.; Baréa, K. and Scheffer-Basso, S. M. 2006. Perspectivas de lançamento de cultivares de espécies forrageiras nativas: o gênero Paspalum. p.149-162. In: Anais do I Simpósio de Forrageiras e Produção Animal. Dall'Agnol, M.; Nabinger, C.; Rosa, L. M.; Silva, J. L. S.; Santos, D. T. and Santos, R. J., eds. Faculdade de Agronomia, UFRGS, Porto Alegre.
- Dempster, A. P.; Laird, N. M. and Rubin, D. B. 1977. Maximum likelihood from incomplete data via the EM algorithm. Journal of the Royal Statistical Society: Series B (Methodological) 39:1-22.
-
Epskamp, S.; Cramer, A. O. J.; Waldorp, L. J.; Schmittmann, V. D. and Borsboom, D. 2012. Network visualizations of relationships in psychometric data and structural equation models. Journal Statistics Software 48:1-18. https://doi.org/10.18637/jss.v048.i04
» https://doi.org/10.18637/jss.v048.i04 - Falconer, D. S. and Mackay, T. F. C. 1996. Introduction to quantitative genetics. 4th ed. Longman, Harlow, Essex.
-
Gouveia, B. T. ; Barrios, S. C. L. ; Valle, C. B. ; Gomes, R. D. C. ; Machado, W. K. R. ; Bueno Filho, J. S. S. and Nunes, J. A. R. 2020. Selection strategies for increasing the yield of high nutritional value leaf matter in Urochloa hybrids. Euphytica 216:38. https://doi.org/10.1007/s10681-020-2574-3
» https://doi.org/10.1007/s10681-020-2574-3 -
Graminho, L. A.; Dall'Agnol, M.; Pötter, L.; Lopes, R. R.; Simioni, C. and Weiler, R. L. 2017. Forage characters of different Paspalum species in Rio Grande do Sul: a meta-analysis. Ciência Rural 47:e20161049. https://doi.org/10.1590/0103-8478cr20161049
» https://doi.org/10.1590/0103-8478cr20161049 - Lynch, M. and Walsh, B. 1998. Genetics and analysis of quantitative traits. Vol. 1. Sinauer Associates, Inc, Sunderland, MA. p.535-557.
-
Machado, J. M.; Motta, E. A. M.; Barbosa, M. R.; Weiler, R. L.; Simioni, C.; Silveira, D. C.; Mills, A.; Pereira, E. A. and Dall'Agnol, M. 2021. Multivariate analysis reveals genetic diversity in Paspalum notatum Flügge. Revista Brasileira de Zootecnia 50:e20200252. https://doi.org/10.37496/rbz5020200252
» https://doi.org/10.37496/rbz5020200252 - Montgomery, D. C.; Peck, E. A. and Vining, G. G. 2021. Introduction to linear regression analysis. 6th ed. John Wiley & Sons, New Jersey.
- Moreno, J. A. 1961. Clima do Rio Grande do Sul. Boletim Geográfico do Rio Grande do Sul (11):49-83.
-
Motta, E. A. M.; Dall'Agnol, M.; Nascimento, F. L.; Pereira, E. A.; Machado, J. M.; Barbosa, M. R.; Simioni, C. and Ferreira, P. B. 2016. Forage performance of Paspalum hybrids from an interspecific cross. Ciência Rural 46:1025-1031. https://doi.org/10.1590/0103-8478cr20150232
» https://doi.org/10.1590/0103-8478cr20150232 -
Nabinger, C. and Dall’Agnol, M. 2020. Guia para reconhecimento de espécies dos Campos Sulinos. IBAMA, Brasília. 132p. Available at: <https://www.ibama.gov.br/component/phocadownload/file/7819-guia-para-reconhecimento-de-especie-dos-campos-sulinos> Accessed on: July 07, 2024.
» https://www.ibama.gov.br/component/phocadownload/file/7819-guia-para-reconhecimento-de-especie-dos-campos-sulinos> -
Novo, P. E.; Galdeano, F.; Espinoza, F. and Quarin, C. L. 2019. Cytogenetic relationships, polyploid origin and taxonomic issues in Paspalum species: inter-and intraspecific hybrids between a sexual synthetic autotetraploid and five wild apomictic tetraploid species. Plant Biology 21:267-277. https://doi.org/10.1111/plb.12931
» https://doi.org/10.1111/plb.12931 -
Olivoto, T. and Lúcio, A. D. C. 2020. metan: An R package for multi-environment trial analysis. Methods in Ecology and Evolution 11:783-789. https://doi.org/10.1111/2041-210X.13384
» https://doi.org/10.1111/2041-210X.13384 -
Ortiz, J. P. A.; Quarin, C. L.; Pessino, S. C.; Acuña, C.; Martínez, E. J.; Espinoza, F.; Hojsgaard, D. H.; Sartor, M. E.; Cáceres, M. E. and Pupilli, F. 2013. Harnessing apomictic reproduction in grasses: what we have learned from Paspalum. Annals of Botany 112:767-787. https://doi.org/10.1093/aob/mct152
» https://doi.org/10.1093/aob/mct152 -
Pereira, E. A.; Dall'Agnol, M.; Nabinger, C.; Huber, K. G. C.; Montardo, D. P. and Genro, T. C. M. 2011. Produção agronômica de uma coleção de acessos de Paspalum nicorae Parodi. Revista Brasileira de Zootecnia 40:498-508. https://doi.org/10.1590/S1516-35982011000300006
» https://doi.org/10.1590/S1516-35982011000300006 - R Core Team. 2023. R: A Language and Environment for Statistical Computing. R Foundation for Statistical Computing, Vienna, Austria.
- Ramalho, M. A. P.; Santos, J. B. D.; Pinto, C. A. B. P.; Souza, E. A. D.; Gonçalves, F. M. A. and Souza, J. C. D. 2020. Genética na agropecuária. 6.ed. UFLA, Lavras.
-
Rao, C. R. 1973. Linear statistical inference and its applications. 2nd ed. John Wiley and Sons, New York. https://doi.org/10.1002/9780470316436
» https://doi.org/10.1002/9780470316436 - Resende, M. D. V. 2007. Matemática e estatística na análise de experimentos e no melhoramento genético. Embrapa Florestas, Colombo.
- Santos, H. G.; Jacomine, P. K. T.; Anjos, L. H. C.; Oliveira, V. A.; Lumbreras, J. F.; Coelho, M. R.; Almeida, J. A.; Araújo Filho, J. C.; Oliveira, J. B. and Cunha, T. J. F. 2018. Sistema brasileiro de classificação de solos. 5.ed. Embrapa, Brasília.
-
Sartor, M. E.; Quarin, C. L. and Espinoza, F. 2009. Mode of reproduction of colchicine-induced Paspalum plicatulum tetraploids. Crop Science 49:1270-1276. https://doi.org/10.2135/cropsci2008.05.0270
» https://doi.org/10.2135/cropsci2008.05.0270 -
Silva, M. A.; Lira, M. A.; Santos, M. V. F.; Dubeux Junior, J. C. B.; Cunha, M. V. and Freitas, E. V. 2008. Análise de trilha em caracteres produtivos de Pennisetum sob corte em Itambé, Pernambuco. Revista Brasileira de Zootecnia 37:1185-1191. https://doi.org/10.1590/S1516-35982008000700007
» https://doi.org/10.1590/S1516-35982008000700007 -
Silveira, D. C.; Pelissoni, M.; Buzatto, C. R.; Scheffer-Basso, S. M.; Ebone, L. A.; Machado, J. M. and Lângaro, N. C. 2021. Anatomical traits and structural components of peduncle associated with lodging in Avena sativa L. Agronomy Research 19:250-264. https://doi.org/10.15159/AR.21.001
» https://doi.org/10.15159/AR.21.001 -
Soreng, R. J.; Peterson, P. M.; Zuloaga, F. O.; Romaschenko, K.; Clark, L. G.; Teisher, J. K.; Gillespie, L. J.; Barberá, P.; Welker, C. A. D.; Kellogg, E. A.; Li, D. and Davidse, G. 2022. A worldwide phylogenetic classification of the Poaceae (Gramineae) III: An update. Journal of Systematics and Evolution 60:476-521. https://doi.org/10.1111/jse.12847
» https://doi.org/10.1111/jse.12847 - Soil Survey Staff. 2022. Keys to soil taxonomy. 13th ed. USDA Natural Resources Conservation Service.
- Souza, R. A.; Carvalho, R. G.; Pimentel, A. J. B.; Inácio, J. G. and Lima Silva, J. 2021. Desempenho produtivo e qualidade nutricional de forrageiras do gênero Urochloa no Oeste da Bahia. Agrarian 14:392-403.
-
Souza-Sobrinho, F.; Lédo, F. J. S.; Pereira, A. V.; Botrel, M. A.; Evangelista, A. R. and Viana, M. C. M. 2004. Estimativas de repetibilidade para produção de matéria seca em alfafa. Ciência Rural 34:531-537. https://doi.org/10.1590/S0103-84782004000200030
» https://doi.org/10.1590/S0103-84782004000200030 -
Toebe, M.; Machado, L. N.; Tartaglia, F. L.; Carvalho, J. O.; Bandeira, C. T. and Cargnelutti Filho, A. 2019. Sample size for the estimation of Pearson's linear correlation in crotalaria species. Pesquisa Agropecuária Brasileira 54:e01027. https://doi.org/10.1590/S1678-3921.pab2019.v54.01027
» https://doi.org/10.1590/S1678-3921.pab2019.v54.01027 -
Weiler, R. L.; Dall'Agnol, M.; Simioni, C.; Krycki, K. C.; Pereira, E. A.; Machado, J. M. and Motta, E. A. M. 2018. Intraspecific tetraploid hybrids of Paspalum notatum: agronomic evaluation of segregating progeny. Scientia Agricola 75:36-42. https://doi.org/10.1590/1678-992X-2016-0354
» https://doi.org/10.1590/1678-992X-2016-0354 - Wright, S. 1921. Correlation and causation. Journal of Agricultural Research 20:557-585.
-
Data availability:
The data that support the results of this study are available from the corresponding author upon reasonable request.
-
Financial support:
The authors acknowledge the Conselho Nacional de Desenvolvimento Científico e Tecnológico (CNPq) for the doctoral scholarship granted (141951/2020-6) through the Graduate Program in Animal Science - Universidade Federal do Rio Grande do Sul (UFRGS).
Edited by
-
Editors:
Lucas Lima VerardoAna Fabrícia Braga Magalhães
The data that support the results of this study are available from the corresponding author upon reasonable request.