Parameters of the statistical model in the linear relationships of growthpromoting bacteria in soybean
ABSTRACT
In multivariate statistical analyses, the parameters of the statistical model referring to the experimental design are disregarded, so in general researchers work with average observations, without stratification of effects. The objective was to evaluate and characterize the effects of removing the effect of parameters from the statistical model on the linear relationships between variables in growth-promoting and phosphorus (P)-solubilizing bacteria in soybean crop. The design used was randomized blocks in a 9 x 4 two-factor arrangement, with four replicates. The first factor, Bradyrhizobium spp. co-inoculated with: 1) Azospirillum spp.; 2) Pseudomonas fluorescens; 3) Bacillus subtilis; 4) Bacillus subtilis + Bacillus megaterium; 5) Azospirillum spp. + Pseudomonas fluorescens; 6) Azospirillum spp. + Bacillus subtilis; 7) Azospirillum spp. + Bacillus subtilis + Bacillus megaterium; 8) Azospirillum spp. + Pseudomonas fluorescens + Bacillus subtilis + Bacillus megaterium and 9) Control (without bacteria); and four doses of P2O5: 0, 50, 100 and 150 kg ha-1. Statistical assumptions were tested and parameters were removed from the statistical model, stratifying effects, and the change was compared to the traditional analysis (general model), in the principal component and Pearson's correlation analyses. Treatment with Bradyrhizobium spp. + Azospirillum spp. + Bacillus subtilis showed the highest percentage of accumulated variance, 56.99%. Removal of parameters changed the magnitude of Pearson's correlation coefficients, from 10% to 70% and the direction by up to 54.55%.
Keywords:
Glycine max L; Principal component analysis; Pearson's linear correlation; Effect stratification; Co-inoculation
RESUMO
Nas análises estatísticas multivariadas, os parêmetros do modelo estatístico referentes ao delineamento experimental são desconsiderados, trabalhando-se em geral com observações médias, sem estratificação de efeitos. O objetivo foi avaliar e caracterizar os efeitos da remoção do efeito de parêmetros do modelo matemático sobre as relações lineares entre variáveis em bactérias promotoras de crescimento e solubilizadoras de fósforo (P), na cultura da soja. O delineamento empregado foi de blocos casualizados, bifatorial 9 x 4, com quatro repetições. O primeiro fator, Bradyrhizobium spp. coinoculada a: 1) Azospirillum spp.; 2) Pseudomonas fluorescens; 3) Bacillus subtilis; 4) Bacillus subtilis + Bacillus megaterium; 5) Azospirillum spp. + Pseudomonas fluorescens; 6) Azospirillum spp. + Bacillus subtilis; 7) Azospirillum spp. + Bacillus subtilis + Bacillus megaterium; 8) Azospirillum spp. + Pseudomonas fluorescens + Bacillus subtilis + Bacillus megaterium e 9) Testemunha (sem bactérias); e quatro doses, 0, 50, 100 e 150 kg ha-1 de P2O5. Foram testadas as pressuposições estatísticas e realizou-se a remoção de parêmetros do modelo estatístico, estratificando efeitos, e a mudança comparada a análise tradicional (modelo geral), nas análises de componentes principais e de correlação de Pearson. O tratamento com Bradyrhizobium spp. + Azospirillum spp. + Bacillus subtilis apresentou o maior percentual de variência acumulada, 56,99%, A remoção de parêmetros alterou a magnitude dos coeficientes de correlação de Pearson, de 10% a 70% e a direção em até 54,55%.
Palavras-chave:
Glycine max L; Análise de componentes principais; Correlação linear de Pearson; Estratificação de efeitos; Coinoculação
INTRODUCTION
Soybean (Glycine max) stands out as one of the main oilseeds cultivated in the world, widely used in human and animal diet. Currently, 138.52 million hectares in the world are destined for soybean cultivation, with production of 395.91 million tons of grains (FAO, 2024). In Brazil, the production corresponds to 147.35 million tons, with a sown area of 45.98 million hectares and an average grain yield of 3,205 kg ha-1 (CONAB, 2024).
In this context, phosphorus (P) stands out as an essential element for plant growth, development and productivity, but part of it is not available in the soil for use by plants. To overcome this challenge, it is important to implement alternatives to increase available phosphorus, such as the use of growth-promoting and P-solubilizing microorganisms (PAVINATO et al., 2020). The mechanisms of action of P-solubilizing bacteria are to convert insoluble forms of P into soluble forms through the secretion of organic acids, which reduces soil pH and increases P availability, and many strains produce phytohormones such as indoleacetic acid, promoting root development, enhancing nutrient absorption (RAI; NABTI, 2017). Research indicates that specific strains of Bacillus, such as B. megaterium and B. pumilus, can effectively mineralize organic P and solubilize inorganic P, thereby
The mass of one thousand grains (MTG) was determined on an analytical scale by weighing 1000 soybean grains per plot. Grain yield (GY) of central 6 m2 of the plots was quantified, with grain mass corrected to 13% moisture content and converted into kg ha-1.
Contents of protein (PCG), oil (OCG), fiber (FCG) and ash (ACG), as well as fatty acids, such as palmitic acid (PACG), stearic acid (SACG), oleic acid (OACG), linoleic acid (LACG) and linolenic acid (LAG), were determined in samples of soybean grains in an analysis carried out in the Near Infrared Spectrophotometer. This instrument is based on vibrational spectroscopy that uses photon energy at wavelengths from 750 to 2500 nm. The wave produced when it hits the sample is partially absorbed and reflected. The radiation that is not absorbed is reflected, analyzed and the chemical attributes are quantified (PASQUINI, 2018).
Statistical analyses
Statistical assumptions were tested, with the diagnosis of multivariate normality using the Shapiro-Wilk normality test and homogeneity of variances of Bartlett (BARTLETT, 1937). When the assumptions were not met, considering p≤0.05, the appropriate Box-Cox transformations were carried out.
The statistical model for a two-factor experiment in a randomized block design (RBD) is characterized by: Yijk = m + ai + dj + (ad)ij + bk + eijk; where Yijk is the value observed in the plot (observation); m is the effect of the overall mean; ai is the effect of the first factor (Factor A), co-inoculation of growth-promoting bacteria; dj is the effect of the second factor (factor D), doses of phosphorus (P2O5); (ad)ij is the effect of the interaction (AxD) between the factors; bk is the random effect of the block, and eijk is the random effect of the experimental error referring to the plot (experimental unit). The number of 4 repetitions followed an established experimental plan, widely used for experiments with microorganisms in agricultural crops, using a randomized block design in this experimental structure.
General) Yijk = m + ai + dj + (ad)ij + bk + eijk (Traditional, without parameter removal)
Predicted) Yijk = m + eijk (Without effect of treatments);
A1) Yijk = m + a1 + eijk; a1 = co-inoculation of Bradyrhizobium spp. + Azospirillum spp.;
A2) Yijk = m + a2 + eijk; a2 = co-inoculation of Bradyrhizobium spp. + Pseudomonas fluorescens;
A3) Yijk = m + a3 + eijk; a3 = co-inoculation of Bradyrhizobium spp.+ Bacillus subtilis;
A4) Yijk = m + a4 + eijk; a4 = co-inoculation of Bradyrhizobium spp. + Bacillus subtilis + Bacillus megaterium;
A5) Yijk = m + a5 + eijk; a5 = co-inoculation of Bradyrhizobium spp. +Azospirillum spp. + Pseudomonas fluorescens;
A6) Yijk = m + a6 + eijk; a6 = co-inoculation of Bradyrhizobium spp. + Azospirillum spp. + Bacillus subtilis;
A7) Yijk = m + a7 + eijk; a7 = co-inoculation of Bradyrhizobium spp. + Azospirillum spp. + Bacillus subtilis + Bacillus megaterium;
A8) Yijk = m + a8 + eijk; a8 = co-inoculation of Bradyrhizobium spp. +Azospirillum spp. + Pseudomonas fluorescens + Bacillus subtilis + Bacillus megaterium;
A9) Yijk = m + a9 + eijk; a9 = Control (no co-inoculation);
D1 Yijk = m + d1 + eijk; d1 = dose of 0 kg ha-1 of P2O5;
D2) Yijk = m + d2 + eijk; d2 = dose of 50 kg ha-1 of P2O5;
D3) Yijk = m + d3 + eijk; d3 = dose of 100 kg ha-1 of P2O5;
D4) Yijk = m + d4 + eijk; d4 = dose of 150 kg ha-1 of P2O5;
Thus, in a total of 15 scenarios to perform the analyses, the aim was to explore the results of the predicted model (without effect of treatments), as well as the levels of the 1st factor (bacteria) and the 2nd factor (phosphorus doses) fractionated individually, compared to the traditional one (General model), in the linear relationships between variables, through the multivariate analyses principal component analysis and Pearson's linear correlation.
In the principal component analysis, biplots were used to represent the results. From this, the magnitude of change that this causes in the linear relationships between variables was evaluated, by the percentage of variance explained in the first two components, as well as the contribution of the morphological, production and bromatological variables analyzed to the 1st and 2nd principal components. Likewise, the percentage change in the explanation of variance in the principal components of the different scenarios of parameter removal as compared to the traditional one (general model) was quantified.
In principal component analysis, the ideal is that 70% or more of the accumulated variance is represented in the first two components (VARELLA, 2008). Based on this criterion and as a lower percentage was obtained, the variables that contributed the least to the mean of the 1st and 2nd principal components were eliminated, aiming to increase the percentage of explanation in the first two components. The criterion for eliminating variables (cutoff) consisted of removing those with a contribution ≤ 7.14%, a criterion that represents the variables that contribute below the overall mean of contribution. With the criterion adopted, the aim was to find the cutoff point that would result in representing more than 70% of the variation of the data for the different scenarios of parameter removal and general statistical model. In view of this, it also makes it possible to observe the variables that had little importance. Thus, the results of principal component analysis were expressed without exclusion of variables and with exclusion of variables from the database.
In Pearson's linear correlation analysis, the change in significance was evaluated considering p≤0.05 by the t-test of the correlations between variables, as well as the magnitude (force) and direction (positive/negative) of the coefficients, of the different scenarios for evaluating the effects of the parameters, compared to the traditional one (general model), and the results were quantified in percentage of change. To consider the occurrence of a significant change in magnitude, the criterion adopted considered a change greater than 50% (>50%), positively or negatively, of the different scenarios for evaluating the effects of parameters compared to the general model, as established by Sgarbossa et al. (2024). The general and predicted (without effect of treatments) statistical models have number of observations (n) = 144, the levels of the first factor, n = 16, and the levels of the second factor, n = 36.
Principal component analysis and Pearson's linear correlation were performed using the statistical packages 'factoextra' (KASSAMBARA; MUNDT, 2020) and 'metan' (OLIVOTO; LÚCIO, 2020). All statistical analyses improving P uptake in soybean plants (TORRES et al., 2024).
Numerous statistical techniques have been employed to analyze possible relationships between variables, in order to quantify the implications of microbial activities on P solubilization, growth and productivity of agricultural crops. Among these, Pearson's linear correlation analysis stands out, widely used in plant breeding programs, and which allows quantifying the intensity/strength of association and the direction (positive or negative) of linear relationships between two variables (PEARSON, 1920). Principal component analysis (PCA) allows the evaluation of contrasting conditions through an integrated analysis, in which each principal component is a linear combination of all the original variables, retaining as much of the total variation contained in the data as possible, reducing dimensionality (VARELLA, 2008).
In multivariate statistical analyses, the parameters of the statistical model referring to the experimental design are disregarded, so in general researchers work with average observations, without stratification of effects (SGARBOSSA et al., 2024a). In pioneering studies conducted by Sgarbossa et al. (2024a), the authors found that the removal of model parameters causes changes of 10.5% and 13.3% in direction and 24.7% and 23.0% in magnitude of the direct and indirect effects in path analyses. When using this same approach, but stratifying scenarios, the authors obtained maintenance of only 3.30% and 20% in the linear correlation values, 3.30% and 30% in the direct effects and 7.33% and 24.67% in the indirect effects in path analysis, with and without fungicide application (SGARBOSSA et al., 2024b). With the stratification of effects, removing effects of parameters from the statistical model, the aim is to avoid possible results that may not show the real relationship between the variables, making it possible to remove the influences of treatments and the design on the observations.
Considering the importance of multivariate statistical techniques, the objective of this research was to evaluate and characterize the effects of removing the effect of parameters from the statistical model on the linear relationships between variables, in principal component analysis and Pearson's linear correlation, in growth-promoting bacteria, in soybean crop.
MATERIAL AND METHODS
Study area and experimental design
The study used data from a field experiment conducted in the 2019/2020 season, in the municipality of Barra do Quaraí, RS, Brazil, under geographic coordinates 30º09'50.26" S, 57º30'21.40'' W, and 53 m altitude in relation to mean sea level. The climate of the region is Cfa, according to Köppen's classification, characterized by having an average air temperature of 20.1 ºC to 21.0 ºC, ranging from 0 to 38 ºC, and an average annual rainfall of 1240 mm (TAPIADOR: MORENO; NAVARRO, 2019). The soil of the experimental area is classified as Planossolo Hidromórfico Eutrófico Solódico (Alfisol) (SANTOS et al., 2018), with the following characteristics: Clay - 30%, pH in H2O - 4.6, Phosphorus (P) - 1.5 mg/L, Potassium (K) - 102 mg/L, Organic matter - 1.3%, Calcium (Ca) - 5.3 cmol/L, Magnesium (Mg) - 1.5 cmol/L, Potential acidity (H + Al) - 10.2 cmol/L, Sulfur (S) - 13.6 mg/L, Cation exchange capacity - 14.0 cmol/L, and Sum of bases - 50.6%. The soil was fertilized based on soil chemical analysis and technical recommendations for the crop (CQFS, 2016).
The data on air temperature, minimum, average and maximum, and accumulated rainfall were obtained from the automatic weather station of the National Institute of Meteorology (INMET) and linked to the Federal University of Santa Maria, located approximately 5,987 m away from the experimental area. During soybean cultivation, an average air temperature of 22.9 ºC, ranging from 3.5 ºC to 37.2 ºC, and accumulated rainfall of 490.1 mm were recorded. The air temperatures under which the soybean crop has the best growth and development are concentrated within the range from 20 to 30 ºC, and the water needs of the crop vary from 450 to 800 mm, depending on the climatic conditions, management and crop cycle (SCHNEIDER et al., 2022). Therefore, during the cultivation period, the weather conditions were favorable to the development of the crop.
The experiment was set up in a randomized complete block design, with a 9x4 two-factor arrangement, characterized by nine inoculation and co-inoculation treatments with P-solubilizing bacteria: Bradyrhizobium spp. co-inoculated with: 1) Azospirillum spp.; 2) Pseudomonas fluorescens; 3) Bacillus subtilis; 4) Bacillus subtilis + Bacillus megaterium; 5) Azospirillum spp. + Pseudomonas fluorescens; 6) Azospirillum spp. + Bacillus subtilis; 7) Azospirillum spp. + Bacillus subtilis + Bacillus megaterium; 8) Azospirillum spp. + Pseudomonas fluorescens + Bacillus subtilis + Bacillus megaterium; and 9) Control (without the use of bacteria); and four doses of phosphorus (P2O5): 0, 50, 100 and 150 kg ha-1, using the mineral fertilizer triple superphosphate (TSP), with a concentration of 46% of P2O5, with four replicates.
Sowing was carried out on November 11, 2019, using the cultivar DM 66i68 IPRO, recommended for lowland environments (areas predisposed to flooding), with the aid of a mechanized seeder, with spacing between planting rows of 0.57 m and a population of 300,000 plants per hectare. The plots were delimited to be 5.7 m wide and 5 m long, totaling a usable area of 28.5 m2. Inoculation was carried out in a furrow at the time of sowing, using a volume of 50 L ha-1, with the liquid inoculant at the recommended doses of bacteria and according to the defined treatments. The other management practices were carried out following the recommendations and technical indications for soybean cultivation (CARAFFA et al., 2019).
The variables measured were: number of nodules (NN), obtained by counting in 12 plants per plot, at the phenological stage R1 (FEHR; CAVINESS, 1977). For this purpose, the plants were randomly collected, preserving the root system, with the aid of a cutting shovel and in soil at field capacity. After counting, the samples were dried in an oven with forced air circulation at 60 ºC until reaching constant mass. Subsequently, the dry mass of nodules (DMN) was quantified by weighing on a precision scale. Then, phosphorus content in the leaf tissue (PL) was quantified by analyzing 35 trifoliate leaves, in four replicates per treatment. The material was then dried in a forced air circulation oven at a temperature of 65 ºC until reaching constant mass. Afterwards, the leaves were milled and subjected to nitric-perchloric digestion and determination by spectrometry with vanadate yellow (CARMO et al., 2000).
were performed using a 5% level of probability of error and R software (R CORE TEAM, 2024).
RESULTS AND DISCUSSION
The results of the contribution of the variables in the first (PC1) and second (PC2) components, from the principal component analysis, show that for the general statistical model the PCG variable was the one that contributed the most in PC1, with 22.69%, and the PACG variable had the lowest contribution, 0.00% (Table 1). In PC2, the LACG variable, with an explained variance percentage of 25.86%, had the highest contribution, and PL had the lowest contribution, 0.02%. For the predicted model (without effect of treatments), the PACG variable contributed the most in PC1, with 20.72%, and PG contributed the least, with 0.29%. In PC2, the LAG variable, with an explained variance percentage of 18.70%, had the highest contribution, while OACG had the lowest contribution, 0.00%.
Contribution of the variables in PC1 and PC2 for the General model: Yijk = m + ai + dj + (ad)ij + bk + eijk (A); Predicted model: Yijk = m + eijk (B); model Yijk = m + ai + eijk, of the levels of factor A, Bradyrhizobium spp., co-inoculated with: Azospirillum spp. (A1); Pseudomonas fluorescens (A2); Bacillus subtilis (A3); Bacillus subtilis + Bacillus megaterium (A4); Azospirillum spp. + Pseudomonas fluorescens (A5); Azospirillum spp. + Bacillus subtilis (A6); Azospirillum spp. + Bacillus subtilis + Bacillus megaterium (A7); Azospirillum spp. + Pseudomonas fluorescens + Bacillus subtilis + Bacillus megaterium (A8) and Control (A9); model Yijk = m + dj + eijk, of the levels of factor D, doses of phosphorus (P2O5), 0 kg ha-1 (D1), 50 kg ha-1 (D2), 100 kg ha-1 (D3) and 150 kg ha-1 (D4).
In the individual effects of the 1st factor, factor A, of bacterial co-inoculation, for model A1, in PC1 the variables LAG and GY had the highest and lowest percentage of explained variance, equal to 20.34% and 0.02%, respectively. In PC2, the PCG variable, with an explained variance percentage of 27.19%, had the highest contribution, while GY had the lowest contribution, 0.05%. For model A2, the LAG variable contributed the most to the explanation of variance, in PC1, with 25.16%, and GY contributed the least, with 0.04%; in PC2, the variable NN, with an explained variance percentage of 25.33%, had the greatest contribution, while LACG had the lowest contribution, 0.03%. For the A3 model, the LAG variable contributed the most in PC1, with 18.41%, and MTG contributed the least, with 0.19%; in PC2, the SACG variable, with an explained variance percentage of 19.87%, had the highest contribution, while LAG had the lowest contribution, 0.01%.
For model A4, the variables LAG and NN showed the highest and lowest percentage of explained variance, 21.46% and 0.02%, respectively, in PC1. LAG had the greatest contribution in PC1, with 21.46%, and NN contributed the least, with 0.02%; in PC2, the OCG variable, with an explained variance percentage of 30.59%, had the highest contribution, and PL had the lowest contribution, 0.06%. For model A5, the ACG variable contributed the most in PC1, with 14.31%, and LAG contributed the least, with 0.04%; in PC2, the LACG variable, with an explained variance percentage of 29.84%, had the highest contribution, and PCG had the lowest contribution, 0.01%. For model A6, the PCG variable contributed the most in PC1, with 17.38%, and PACG contributed the least, with 0.01%; in PC2, the OACG variable, with an explained variance percentage of 25.13%, had the highest contribution and LACG had the lowest contribution, 0.03%.
For model A7, the OCG variable contributed the most in PC1, with 14.37%, and NN contributed the least, with 0.01%. In PC2, the variables LACG and NN showed the highest and lowest percentage of explained variance, equal to 16.66% and 0.11%, respectively. For model A8, the SACG variable contributed the most in PC1, with 18.83%, and NN contributed the least, with 0.01%; in PC2, the GY variable, with an explained variance percentage of 17.53%, had the greatest contribution, and LACG had the lowest contribution, 0.00%. For model A9, the PCG variable contributed the most in PC1, with 18.69%, and OACG contributed the least, with 0.06%; in PC2, the PACG variable, with an explained variance percentage of 23.36%, had the highest contribution, and DMN had the lowest contribution, 0.01%.
For the individual effects of the phosphorus dose factor (P2O5), for model D1, the variables LAG and NN showed the highest and lowest percentage of explained variance, 18.74% and 1.63%, respectively, in PC1. In PC2, the variables OAC and GY had the highest and lowest contribution to the explained variance, with values of 37.32 and 0.00%, respectively.
For model D2, the PCG variable contributed the most in PC1, with 22.62%, and GY contributed the least, with 0.03%, and the LACG variable, with an explained variance percentage of 29.26%, had the highest contribution and OACG had the lowest contribution, 0.05%, in PC2.
For model D3, in PC1, the variables LAG and OCG had the highest and lowest contribution to the explained variance, with values of 20.55 and 0.01%, respectively. In PC2, the OCG variable, with an explained variance percentage of 24.31%, had the highest contribution, and GY had the lowest contribution, 0.05%. For model D4, the PACG variable contributed the most in PC1, with 18.42%, and LACG contributed the least, with 0.01%, and the PCG variable, with an explained variance percentage of 20.48%, had the highest contribution in PC2, and OACG had the lowest contribution, 0.02%.
The variables that contributed the most to the mean in the principal components were LAG, PCG, PACG and OCG with 11.03, 10.31, 9.58% and 9.06%, respectively, in PC1. In PC2, the variables LACG, LAG, PACG and PCG contributed with 12.07, 10.54, 9.26% and 9.13%, respectively. The variables NN, GY and DMN contributed the least, with 3.01, 3.12, 3.87% respectively, in PC1, and DMN, GY and NN contributed with 3.94, 4.12, and 3.69%, respectively, in PC2.
In general, the bromatological variables were better represented in the explained variance of the principal components compared to the morphological and production variables of the soybean crop, showing that they were the most important variables for the study and the ones that most explained variability.
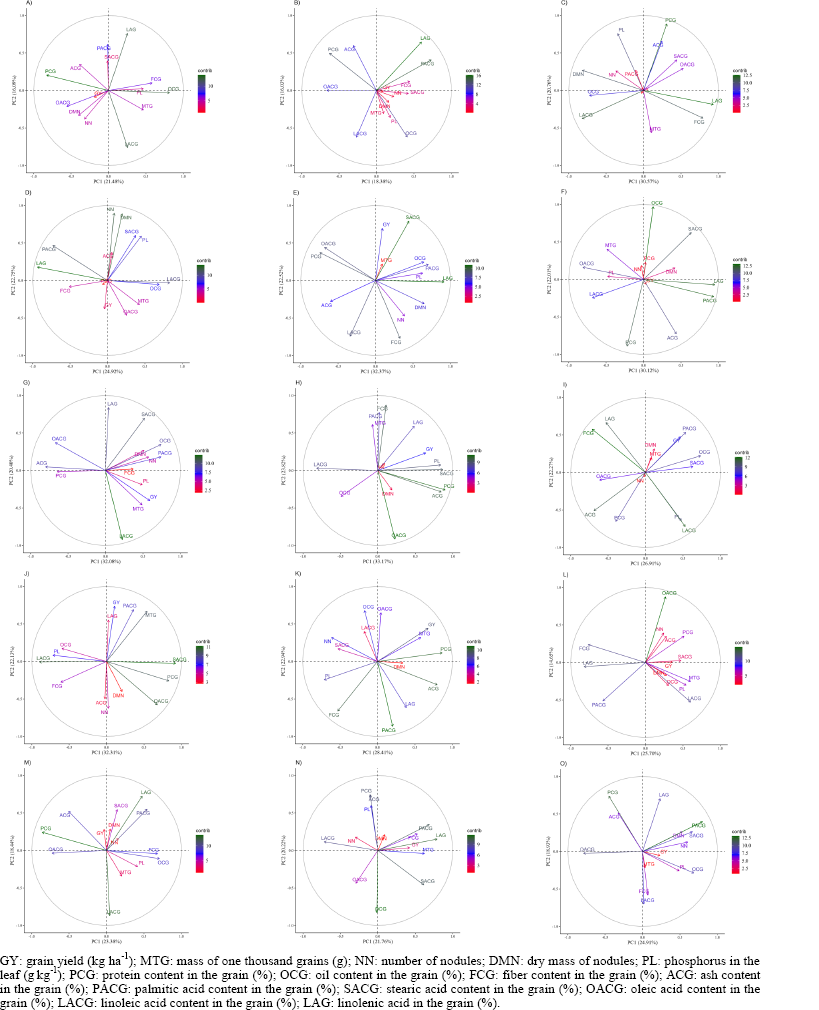
The biplot representations of the principal component analysis, considering all the variables in the different scenarios evaluated, demonstrate the change in the contribution of the variables to the 1st and 2nd component, with the removal of parameters from the statistical model (Figure 1).
Biplot graphical representation of principal component analysis, of the General model: Yijk = m + ai + dj + (ad)ij + bk + eijk (A); Predicted model: Yijk = m + eijk (B); model Yijk = m + ai + eijk, of the levels of factor A, Bradyrhizobium spp., co-inoculated with: Azospirillum spp. (C); Pseudomonas fluorescens (D); Bacillus subtilis (E); Bacillus subtilis + Bacillus megaterium (F); Azospirillum spp. + Pseudomonas fluorescens (G); Azospirillum spp. + Bacillus subtilis (H); Azospirillum spp. + Bacillus subtilis + Bacillus megaterium (I); Azospirillum spp. + Pseudomonas fluorescens + Bacillus subtilis + Bacillus megaterium (J) and Control (K); model Yijk = m + dj + eijk, of the levels of factor D, doses of phosphorus (P2O5), 0 kg ha-1 (L), 50 kg ha-1 (M), 100 kg ha-1 (N) and 150 kg ha-1 (O).
Due to a rather poor contribution of the variance explained in PC1 and PC2, the variables with a contribution ≤ 7.14% (below the mean) were removed and the results and biplots of the principal component analysis were generated again (Figure 2). The most excluded variables were MTG, NN, GY and DMN, respectively, and the least removed were PCG, LACG, PACG and LAG.
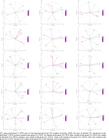
Biplot graphical representation of principal component analysis, eliminating variables with contribution ≤ 7.14% in the mean of PC1 and PC2, of the General model: Yijk = m + ai + dj + (ad)ij + bk + eijk (A); Predicted model: Yijk = m + eijk (B); model Yijk = m + ai + eijk, of the levels of factor A, Bradyrhizobium spp., co-inoculated with: Azospirillum spp. (C); Pseudomonas fluorescens (D); Bacillus subtilis (E); Bacillus subtilis + Bacillus megaterium (F); Azospirillum spp. + Pseudomonas fluorescens (G); Azospirillum spp. + Bacillus subtilis (H); Azospirillum spp. + Bacillus subtilis + Bacillus megaterium (I); Azospirillum spp. + Pseudomonas fluorescens + Bacillus subtilis + Bacillus megaterium (J) and Control (K); model Yijk = m + dj + eijk, of the levels of factor D, doses of phosphorus (P2O5), 0 kg ha-1 (L), 50 kg ha-1 (M), 100 kg ha-1 (N) and 150 kg ha-1 (O).
In the database derived from the general model, the variables OACG, FCG, MTG, ACG, DMN, NN, PL, SACG and GY were excluded. In the predicted model, FCG, SACG, PL, MTG, NN, DMN and GY were excluded. For the other models, the excluded variables were: MTG, OACG, FCG, ACG, GY and PCG in A1; MTG, OACG, FCG, ACG, GY and PCG in E2; PACG, DMN, GY, OCG, ACG, PL, NN and MTG in A3; MTG, PL, DMN, FCG, NN and GY in A4; GY, MTG, PCG, NN, DMN, PL and FCG in A5; GY, MTG, OCG, DMN and NN in A6; GY, SACG, OACG, DMN, MTG and NN in A7; PL, FCG, NN, OCG, LAG, ACG and DMN in A8; OCG, NN, MTG, OACG, SACG, SACG, LACG and DMN in A9; NN, ACG, DMN, FCG, PL, GY and MTG in D1; SACG, PL, MTG, DMN, GY and NN in D2; MTG, PL, PCG, OACG, GY, NN and DMN in D3; and NN, ACG, DMN, FCG, PL, GY and MTG in D4.
Due to the low variance explained in principal components 1 and 2 in the different effect stratification scenarios (parameter removal), with all 14 variables evaluated in the experiment, a mean of 47.18 was obtained (Table 2), which is considered a low value, since ideally, 70-80% of the data variance should be represented in the first two components. Therefore, variance cuts (≤7.14%) were applied to all 15 effect stratification scenarios, resulting from 100% / 14 study variables = 7.14, the mean of the variables, removing the variables that explained less than or equal to 7.14% in the mean of PC1 and PC2. With this criterion, an average of 73.75 was obtained in the explained variance in PC1 and PC2, remaining in the database of the different scenarios the most important variables and those that explained the most variance. Comparisons were then made to assess the change resulting from the removal of parameters (stratification of effects) compared to the general model (without removal of parameters from the statistical model).
Table 2 shows the percentages of the variance explained in PC1, PC2 and total for the parameter removal scenarios, without exclusion and with exclusion of variables. Without excluding variables, the percentage of variance explained in PC1 of the levels of factor A (bacteria), 1st factor, ranged from 26.91 (A7) to 33.17 (A6) and in PC2 from 20.40 (A5) to 23.82% (A6). The percentage of variance explained in PC1 of the levels of factor D (phosphorus doses), 2nd factor, ranged from 21.76 (D3) to 25.70 (D1) and in PC2 from 14.65 (D1) to 20.22% (D3). In the total accumulated variance in PC1 and PC2, the levels of the bacteria factor ranged from 47.67 (A2) to 56.99% (A6). For phosphorus doses, the percentages ranged from 41.82 (D2) to 43.84% (D4) of accumulated variance. The predicted model showed only 34.41% and the general model only 37.57% of explained variance in PC1 and PC2. Thus, with the removal of parameters and when analyzing the individual effects of the levels of the first factor, bacteria, and the second factor, phosphorus doses, these explained more variability compared to the general model. Likewise, the individual effects of the treatments explained more than the predicted scenario (without effect of treatments), showing that the variability comes from the effect of the treatments.
Variance explained in PC1, PC2 and total for the scenarios of removal of parameters from the statistical model and general model, without exclusion of variables and with exclusion of variables from the database.
With the exclusion of variables, in the mean of the scenarios analyzed, the total explained variance was 47.18%, and with the exclusion of variables, 73.75% of accumulated variance was reached in the first two components (PC1 and PC2). Thus, it is identified that the exclusion of variables increases the power of explanation of the data variance, since the variables with the greatest contribution are maintained, consequently increasing the variance explained for the principal components. Excluding variables that explained little improved the explained variance in the principal components by 56.3%.
The scenarios that did not obtain at least 70% of accumulated variance in the first two components, even with the exclusion of variables, were Predicted (without effect of treatments) and doses (D2, D3 and D4). With the exclusion of variables, the highest percentages of total accumulated variance were 82.30 (A8) and 82.04% (A4), respectively. With the individual effects of the levels of factor A, bacterial inoculation, all obtained total variance in the first two components above 70%.
In general, the individual effect of Bradyrhizobium spp. + Azospirillum spp. + Bacillus subtilis (A6) stands out with the highest percentage of variance explained in PC1 and PC2 and total in PC1-2 of 56.99%, followed by A3, with 54.89%, and A8, with 54.44%. The general model, on the other hand, explained only 37.57% of the variance in the principal components. The predicted model (without effect of treatments) was the one that least explained the variability, with only 34.41%.
Working with the co-inoculation of bacteria, Zepechouka et al. (2024) found promising results in the treatments with Bradyrhizobium japonicum, Bacillus subtilis and Bacillus megaterium for grain yield and protein content of the soybean crop. Bradyrhizobium and Bacillus bacteria increased the expression of vigor, seedling length, plant height and soybean yield (ROCHA et al., 2024). Also, Bacillus promoted improvement of morphological and yield parameters of different cultivars in soybean with two sowing dates (MIRANDA et al., 2020).
PCA was used to analyze the microbial composition (bacteria, archaea, fungi, and viruses) in the soybean rhizosphere, where the microbial communities formed distinct clusters based on the microbial kingdom and geographic location, demonstrating variations due to local environments (e.g., soil pH, nutrients, climate). For archaea, PCA explained 71.4% of the variance, with clear clusters separating sites. For bacteria, there was high variability between sites, with higher diversity in some locations. Fungi and viruses also showed similar patterns, but with less explained variance (HONG et al, 2025).
Also, analysis of microbial beta-diversity (based on abundances of taxa, including bacteria, archaea and fungi) among the four treatments: standard inoculation (SI), SI + Bacillus subtilis (SI + Bs), SI + Azospirillum brasilense (SI + Az) and SI + microbial secondary metabolites (SI + MSM) revealed a distinct segregation between treatments, explaining 76.5% of the total variance in microbial composition with the first two principal components (PC1 and PC2) (CRUSCIOL et al., 2024).
Table 3 shows the results of the percentage of change in the amount of variance explained in the scenarios of removal of parameters from the statistical model compared to the general model. In PC1, the levels of the bacteria factor (A1-A9) increased the explanatory power from 16.01% (A2) to 54.42% (A6) compared to the general model. Phosphorus doses (D1-D4) increased the explanation in the component from 1.30 to 19.65% (D1). In PC2, in factor A, bacteria levels increased the explanation from 26.79% (A5) to 48.04% (A6). For phosphorus doses, the explanation was increased to 25.67% (D3).
Percentage change in explained variance in PC1, PC2 and total compared to the general model of the scenarios of removal of parameters from the statistical model.
In the variance accumulated in PC1-2 (Total), the levels of the bacteria factor increased the explanation of the variance from 26.68% (A2) to 51.69%, with emphasis on the effect of the factor Bradyrhizobium spp. + Azospirillum spp. + Bacillus subtilis (A6), which increased the explanatory capacity by 51.69%. For phosphorus doses, on the other hand, there was an increase from 7.40 to 16.69% (D4). The predicted model (without effect of treatments) showed a decrease in the explanatory capacity compared to the general model in the variance explained in PC1, PC2 and accumulated (total).
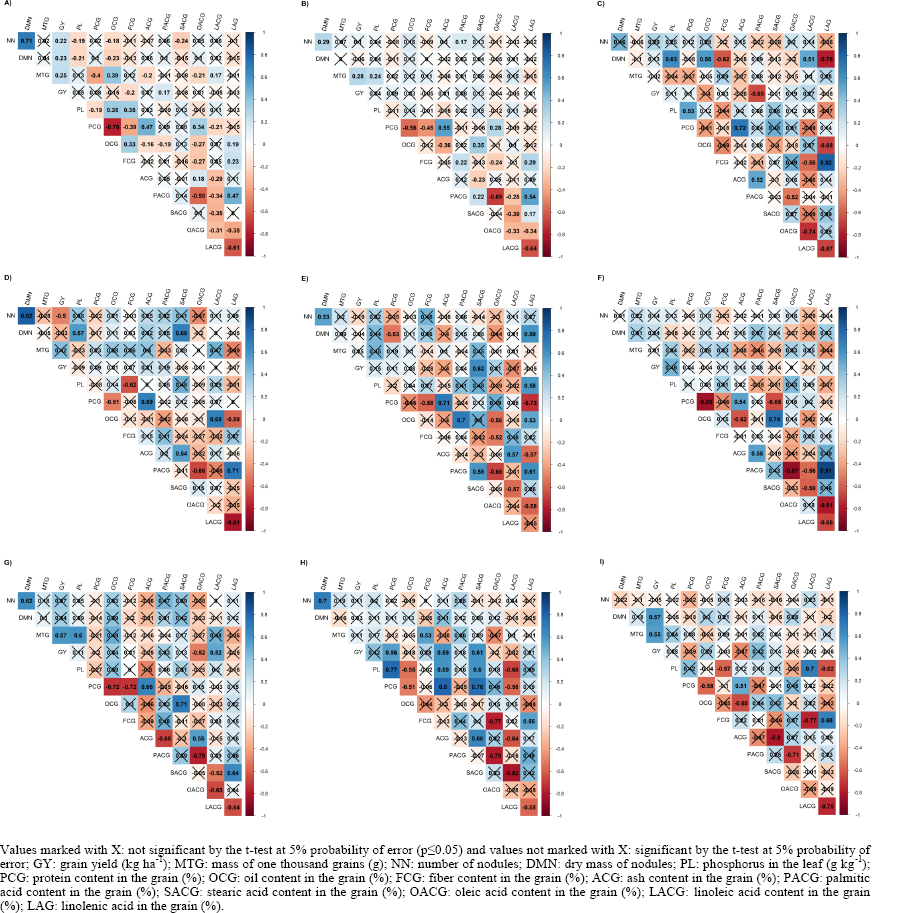
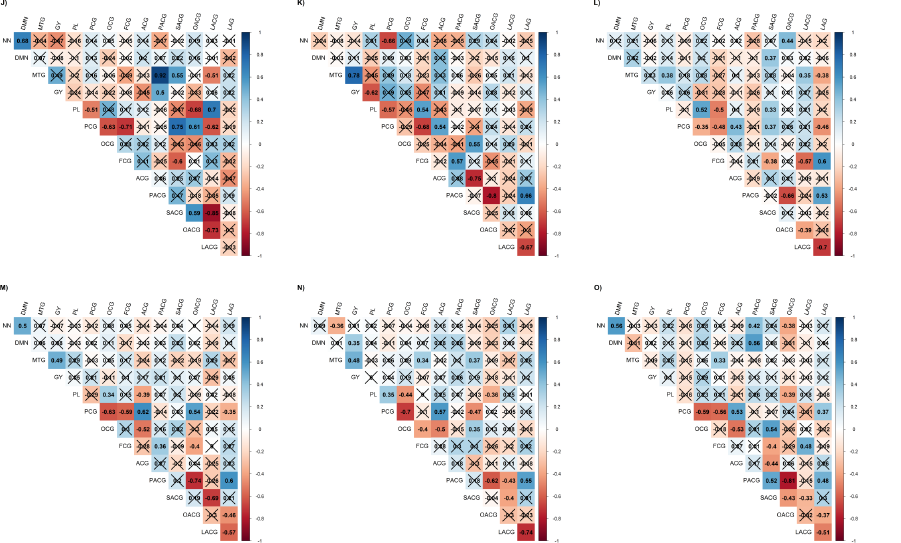
When analyzing the implications of the different scenarios of removing the parameters from the statistical model on Pearson's correlation coefficients, great variability of responses was found in relation to the magnitude of the correlation coefficients and alteration or maintenance in the direction of linear associations (Figure 3). Considering this variability, the complexity and lesser importance of working by comparing all scenarios with the general model, of all the coefficients that constitute the correlation matrix, it was decided to address and discuss only with the significant correlations.

Pearson's linear correlation between production, bromatological and growth variables of soybean crop, considering fifteen scenarios of removal of the parameters from the statistical model: General: Yijk = m + ai + dj + (ad)ij + bk + eijk (A); Predicted model: Yijk = m + eijk (B); model Yijk = m + ai + eijk, of the levels of factor A, Bradyrhizobium spp., co-inoculated with: Azospirillum spp. (C); Pseudomonas fluorescens (D); Bacillus subtilis (E); Bacillus subtilis + Bacillus megaterium (F); Azospirillum spp. + Pseudomonas fluorescens (G); Azospirillum spp. + Bacillus subtilis (H); Azospirillum spp. + Bacillus subtilis + Bacillus megaterium (I); Azospirillum spp. + Pseudomonas fluorescens + Bacillus subtilis + Bacillus megaterium (J) and Control (K); model Yijk = m + dj + eijk, of the levels of factor D, doses of phosphorus (P2O5), 0 kg ha-1 (L), 50 kg ha-1 (M), 100 kg ha-1 (N) and 150 kg ha-1 (O).
The comparison of the general statistical model with the predicted model (without effect of treatments) showed the highest number of significant correlations between them (17), followed by D2, with 14, D3, with 13, as well as A3 and A6, with 12 (Table 4). There was a higher percentage of change in the magnitude of the coefficients and a lower percentage of change in the direction of the significant coefficients, with an average of 36.67% of change in magnitude and 13.36% of change in direction of all scenarios.
Change in magnitude and direction of the significant Pearson's correlation coefficients (p≤0.05) of the scenarios of removal of parameters from the statistical model compared to the general model, for the variables involved in the significant correlations.
The levels of the first factor, bacteria, caused a change in magnitude from 10% (A2) to 70% (A8), while those of the second factor, phosphorus doses, caused a change from 10% (D4) to 35.71% (D2). For change of direction, the levels A4, A5 and A9 showed no change of direction, and level A1 had the greatest change of direction (54.55%).
Table 5 describes the significant correlations and the percentage of correspondence, i.e., of the 15 scenarios for evaluating the parameters of the statistical model, the ones in which a certain correlation was significant. Ash content and protein content in the grain constituted the correlation that remained significant in most of the scenarios analyzed, 93.33%, followed by oil content and protein content in the grain (OCG and PCG), 80%, and fiber content and protein content in the grain (FCG and PCG), 66.67%. It can be observed that most of the correlations were significant considering the general model (Table 5). On the other hand, some correlations were significant specifically in one of the scenarios of removal of parameters from the model, such as: PL and GY in A9, with correlation of -0.62, as well as PCG and NN, with correlation of -0.66; PCG and DMN in A3, with correlation coefficient of -0.53; PCG and GY in A6, with correlation coefficient of 0.55, as well as ACG and GY, with correlation coefficient of 0.59; OACG and GY in A5, with correlation of -0.51, as well as LACG and GY, with correlation of 0.51; and LACG and OCG in A2, with correlation of 0.68.
Significant correlations (p≤0.05) with the variables grain yield (GY), protein content in the grain (PCG) and oil content in the grain (OCG) of soybean.
Combining the results obtained in the principal component analysis, the effect of Bradyrhizobium spp. + Azospirillum spp. + Bacillus subtilis (A6), with the highest percentage of variance explained in PC1-PC2, equal to 56.99%, had a positive correlation of protein content in the grain and grain yield, as well as ash content and grain yield, in Pearson's linear correlation. The potential of growth- promoting bacteria in the system is reinforced as an important way to maximize nutrient fixation and solubilization by soybean through mechanisms such as biological nitrogen fixation and phosphorus solubilization, increasing protein content in the grains and grain yield (HUNGRIA; NOGUEIRA; ARAUJO, 2015).
When working with co-inoculation of Bradyrhizobium, Albrecht et al. (2008) found a negative correlation between protein and productivity in soybean crop in stress situation, in which the most obvious effect of stresses such as drought on seed protein content is the increase in protein content, although this reduces seed oil content. Also in wheat crop, genotypes with early and late cycles show a negative correlation between grain yield and protein content in the grains (TRIVISIOL et al., 2024). However, in the present study there was no drought, which contributed to a significant positive correlation. In addition, when evaluating the measured rates of genetic improvement, it was observed that the concentration of protein in the seed decreased linearly throughout the year of release of the cultivar at a rate of 0.191 g kg-1 year-1, while oil content increased by 0.142 g kg-1 year-1 with the increase in productivity (ROWNTREE et al., 2013).
Bradyrhizobium spp. + Bacillus subtilis (A3), which had the second highest amount of variance explained in the first two principal components, 54.89%, indicated a negative correlation between protein content in the grain and dry mass of nodules, of -0.53.
Therefore, from the results presented in general, it should be noted that the removal of parameters from the statistical model changes the contribution of explained variance in the principal components. The removal of parameters from the model, stratifying effects, changes the magnitude and direction of the coefficients as well as the significance of Pearson's correlations. Thus, the importance of studies that stratify effects for a better understanding of the linear relationships between variables is reinforced.
CONCLUSION
The effect of Bradyrhizobium spp. + Azospirillum spp. + Bacillus subtilis (A6) was the scenario of removal of the parameters from the statistical model that most increased the ability to explain the accumulated variance for principal component analysis, by 51.69% compared to the traditional model (General model).
Bradyrhizobium spp. + Azospirillum spp. + Bacillus subtilis showed the highest percentage of explained variance, 56.99%, in the first and second principal components, in addition to showing a positive correlation (0.55) between protein content and grain yield.
Excluding variables that explained little increased the explained variance in the principal components by 56.3% in the mean of the scenarios of removal of parameters from the statistical model, from 47.18 to 73.75%.
The removal of effects of the parameters of the statistical model, in general, influenced more the magnitude than the direction of the coefficients of Pearson's linear correlation. There were changes from 10% to 70% in the magnitude and from 0 to 54.55% in the direction of the coefficients, as well as changes in the significance (p≤0.05) of Pearson's correlations.
Data Availability:
The data that support the findings of this study can be made available, upon reasonable request, from the corresponding author.
ACKNOWLEDGMENTS
The authors would like to thank the Coordination for the Improvement of Higher Education Personnel (Capes-Brasil, Process No. 88887.829877/2023-00) for the financial support.
REFERENCES
- ALBRECHT, L. P. et al. Teores de óleo, proteínas e produtividade de soja em função da antecipação da semeadura na região oeste do Paraná. Bragantia, 67: 865-873, 2008.
- BARTLETT, M. S. Properties of sufficiency and statistical tests. Proceedings of the Royal Society of London. Series A - Mathematical and Physical Sciences, 160: 268-282, 1937.
- CARAFFA, M. et al. Indicações técnicas para a cultura da soja no Rio Grande do Sul e em Santa Catarina: Safras 2018/2019 e 2019/2020 2. ed. Três de Maio, RS: Setrem, 2019, 105 p.
- CARMO, C. A. F. S. et al. Métodos de análise de tecidos vegetais Rio de Janeiro, RJ: Embrapa Solos, 2000. 41 p. (Circular Técnica; 6)
- CQFS - Comissão de Química e Fertilidade do Solo. Recomendações de adubação e calagem para os estados do Rio Grande do Sul e Santa Catarina 11. ed. Passo Fundo, RS: CQFS, 2016. 376 p.
- CONAB - Companhia Nacional de Abastecimento. Acompanhamento da Safra Brasileira de Grãos: Safra 2024/25, Brasília, DF: CONAB, 2024, 135 p.
- CRUSCIOL, C. A. C. et al. Diverse bacterial consortia: key drivers of rhizosoil fertility modulating microbiome functions, plant physiology, nutrition, and soybean grain yield. Environmental Microbiome, 19: 50, 2024.
-
FAO - Food and Agriculture Organization. Foreign Agricultural Service Available at: <https://fas.usda.gov/data/commodities/soybeans>. Access on: Oct. 11, 2024.
» https://fas.usda.gov/data/commodities/soybeans - FEHR, W. R., CAVINESS, C. E. Stages of soybean development Ames: Iowa State University, 1977. 12 p. (Special Report, 80)
- HONG, H. et al. Soybean productivity can be enhanced by understanding rhizosphere microbiota: evidence from metagenomics analysis from diverse agroecosystems. Microbiome, 13: 105, 2025
- HUNGRIA, M.; NOGUEIRA, M. A.; ARAUJO, R. S. Alternative methods of soybean inoculation to overcome adverse conditions at sowing. African Journal of Agricultural Research, 10: 2329-2338, 2015.
- KASSAMBARA, A.; MUNDT, F. Factoextra: Extract and visualize the results of multivariate data analyses (R package version 1.0.7). 2020.
- MIRANDA, L. B. et al. Promotores de crescimento na cultura da soja. South American Journal of Basic Education, Technical and Technological, 7: 469-479, 2020.
- OLIVOTO, T.; LÚCIO, A. D. Metan: An R package for multi-environment trial analysis. Methods in Ecology and Evolution, 11: 783-789, 2020.
- PASQUINI, C. Near infrared spectroscopy: A mature analytical technique with new perspectives - A review. Analytica Chimica Acta, 1026: 8-36, 2018.
- PAVINATO, P. S. et al. Revealing soil legacy phosphorus to promote sustainable agriculture in Brazil. Scientific Reports, 10: 1-11, 2020.
- PEARSON, K. Notes on the history of correlation. Biometrika, 13: 25-45, 1920.
-
R CORE TEAM. R: A Language and Environment for Statistical Computing Vienna, Austria, 2024. Available at: https://www.R-project.org/
» https://www.R-project.org/ - RAI, A.; NABTI, E. Plant Growth-Promoting Bacteria: Importance in Vegetable Production. Microbial Strategies for Vegetable Production, 6: 23-48, 2017.
- ROCHA, T. M. et al. Qualidade fisiológica de sementes, desempenho a campo e viabilidade econômica da cultura da soja submetida à inoculação de sementes com diferentes produtos biológicos. Revista de Ciência e Inovação, 10: 1-21, 2024.
- ROWNTREE, S. C. et al. Genetic gain x management interactions in soybean: I. Planting date. Crop Science, 53: 1128-1138, 2013.
- SANTOS, H. G. et al. Sistema brasileiro de classificação de solos 5. ed. Brasília, DF: Embrapa, 2018, 355 p.
- SCHNEIDER, R. A. et al. A melhor cultivar de soja para a sua lavoura 2. ed. Santa Maria, RS, 2022. 141 p.
- SGARBOSSA, J. et al. Implications of removing model parameters on the linear relationships of trials with oat. Ciência Rural, 54: 20230379, 2024a.
- SGARBOSSA, J. et al. Multivariate assumptions and effect of model parameters in path analysis in oat crop. Crop & Pasture Science, 75: 23135, 2024b.
- TAPIADOR, F. J.; MORENO, R.; NAVARRO, A. Consensus in climate classifications for present climate and global warming scenarios. Atmospheric Research, 216: 26-36, 2019.
- TORRES, P. et al. Phenotypic, genomic and in planta characterization of Bacillus sensu lato for their phosphorus biofertilization and plant growth promotion features in soybean. Microbiological Research, 280: 127566, 2024.
- TRIVISIOL, V. S. et al. Partial correlations between production traits and grain protein in wheat. Revista Caatinga, 37: 12312, 2024.
-
VARELLA, C. A. A. Análise multivariada aplicada à s Ciências Agrárias: análise de componentes principais. Seropédica, RJ: Universidade Federal Rural do Rio de Janeiro, 2008. Available at: <http://www.ufrrj.br/institutos/it/deng/varella/Downloads/multivariadaaplicadaascienciasagrarias/Aulas/analisedecomponentesprincipais.pdf>. Access on: Apr. 27, 2024.
» http://www.ufrrj.br/institutos/it/deng/varella/Downloads/multivariadaaplicadaascienciasagrarias/Aulas/analisedecomponentesprincipais.pdf - ZEPECHOUKA, M. I. et al. Benefícios do uso de Bradyrhizobium japonicum, Bacillus subtilis E Bacillus megaterium na soja (Glycine max) em agricultura regenerativa. RAMVI-Revista de Agronomia e Medicina Veterinária IDEAU, 11: e205-e205, 2024.
Edited by
-
Editor in Chief:
Aurélio Paes Barros Júnior
-
Section Editor:
Antonio Policarpo Souza Carneiro