Total precipitation and air temperature data obtained from ERA5-Land reanalysis: validation and accuracy
ABSTRACT
This study aimed to validate the monthly data of air temperature and total precipitation through the ERA5-Land reanalysis within 31 years (01/01/1990 to 12/31/2020) in the state of Pernambuco, Brazil, based on the data from 13 automatic weather stations of INMET. The air temperature and precipitation data were stratified by mesoregions of the state (Forest Zone/Coastal, Agreste and Hinterland), and the validation of the ERA5-Land reanalysis data was performed using statistical indices of precision and accuracy of the model. The highest RMSE for total precipitation was obtained in the data of Recife (122.07 mm), and the lowest in the data of the city of Ouricuri (30.26 mm). However, the highest RMSE for air temperature was found in the data of the city of Salgueiro (1.98 °C), and the lowest in the city of Recife (0.47 °C). The total precipitation data generated by ERA5-Land were compared to the surface data based on the systematic error MBE, with the highest underestimate in Recife (-71.84 mm), the lowest in Petrolina (-0.27 mm) and the highest overestimated in Caruaru (9.05 mm). For mean air temperature, the data estimated by ERA5-Land underestimated the surface data in almost all municipalities, with the highest underestimate observed in Salgueiro (-2.50 °C) and the highest in Garanhuns (0.68 °C). Therefore, one can ensure that the ERA5-Land reanalysis estimated total precipitation and mean air temperature satisfactorily, which can be used in several other studies that demand such climate parameters.
Keywords:
Remote sensing; Hinterland; Orbital data; ECMWF
RESUMO
Este estudo teve como objetivo validar os dados mensais de temperatura do ar e precipitação total por meio da reanálise ERA5-Land em 31 anos (01/01/1990 a 31/12/2020) no estado de Pernambuco, Brasil, com base nos dados de 13 estações meteorológicas automáticas do INMET. Os dados de temperatura do ar e precipitação foram estratificados por mesorregiões do estado (Zona da Mata/Litoral, Agreste e Sertão), e a validação dos dados da reanálise ERA5-Land foi realizada por meio de índices estatísticos de precisão e exatidão do modelo. O maior RMSE para precipitação total foi obtido nos dados de Recife (122,07 mm), e o menor da cidade de Ouricuri (30,26 mm). No entanto, o maior RMSE para temperatura do ar foi encontrado nos dados da cidade de Salgueiro (1,98 ºC), e o menor na cidade de Recife (0,47 °C). Os dados de precipitação total gerados pelo ERA5-Land foram comparados com os dados de superfície com base no erro sistemático MBE, com a maior subestimação em Recife (-71,84 mm), a menor em Petrolina (-0,27 mm) e a maior superestimação em Caruaru (9,05 mm). Para a temperatura média do ar, os dados estimados pelo ERA5-Terra subestimaram os dados de superfície em quase todos os municípios, com a maior subestimação observada em Salgueiro (-2,50 ºC) e a maior em Garanhuns (0,68 ºC). Portanto, pode-se assegurar que a reanálise do ERA5-Land estimou a precipitação total e a temperatura média do ar de forma satisfatória, o que pode ser utilizado em diversos outros estudos que demandam tais parâmetros climáticos.
Palavras-chave:
Sensoriamento; remoto; Sertäo; Dados orbitais; ECMWF
INTRODUCTION
Climate and weather stations are used all around the world to record atmospheric and weather conditions by collecting these data over long periods, thus encompassing the long-term climate trends for a specific location. Several institutions carry out this type of monitoring at the local, national, and global level (National Aeronautics and Space Administration [NASA], UN Climate Technology Centre and Network [CTCN], National Institute of Water and Atmospheric Research [NIWA], Met Office [UK], and European Environment Agency [EEA]).
These institutions have an important meteorological database, planned to receive, store, compute, and provide information on several meteorological variables (precipitation, air temperature, relative air humidity, radiation, and wind direction and speed). The data were collected at strategic points, through automatic or conventional weather stations, or even remotely through orbital sensors, aircraft, or even through radar systems (VIANNA et al., 2017).
Several studies have been conducted using climatic databases in Brazil. Ribeiro et al. (2017) compared meteorological data of conventional (CWS) and automatic (AWS) weather stations in cities of the state of Piauí, in the northeastern region of Brazil, for the variables maximum, minimum, and mean air temperature, relative air humidity, wind speed at 10 meters, precipitation and mean atmospheric pressure, through statistical indices. Turco and Carleto (2017) verified the influence of data integrity (wind speed, solar radiation, temperature, air humidity, and precipitation) over the hydrological parameters of the output of the Hydrographic Basin of Córrego Rico, state of São Paulo, Brazil, by the Soil and Water Assessment Tool (SWAT) model.
Automatic weather stations (AWS) provide data more practically and functionally than conventional ones, which need an operator for data collection (TURCO; CARLETO, 2017). Due to constant operational failures, as well as the decreased number and lack of stations in some locations, the formation of interpolated data set grids for precipitation temperature and several other variables is becoming increasingly common. Such data sets allow information on locations with good network coverage to be extended to areas with scarce information (ESSOU; ARSENAULT; BRISSETTE, 2016; NEWMAN et al., 2015).
Reanalysis is the retrospective of historical data that uses part of weather forecasting models, in which data reinforce the approximation of atmosphere true values (TAREK; BRISSETTE; ARSENAULT, 2020). This database is susceptible to interferences between local climate and topography due to its spatial resolution (CHEN et al., 2020). Reanalysis is among the most widely used interpolated data sets in environmental studies, distinctive scales and models for the most diverse purposes (CASTRO; SILVA; PIRES, 2019).
Precipitation exerts greater influence on ecosystem processes (COAN; BACK; BONETTI, 2015), so efficient planning is required in several society sectors, such as in agricultural, environmental, and urban planning, agriculture, and planning of hydrographic basins (COSTA et al., 2015). Air temperature is also considered an important variable and is used in several environmental studies, such as weather forecasts, estimates of evapotranspiration, crop yield prediction, and climate change investigation (JANATIAN et al., 2016).
In this context, this study aimed to validate the monthly data of air temperature and total precipitation through the ERA5-Land reanalysis within 31 years (01/01/1990 to 12/31/2020) in the state of Pernambuco, Brazil, based on the data from 13 automatic weather stations of INMET.
MATERIAL AND METHODS
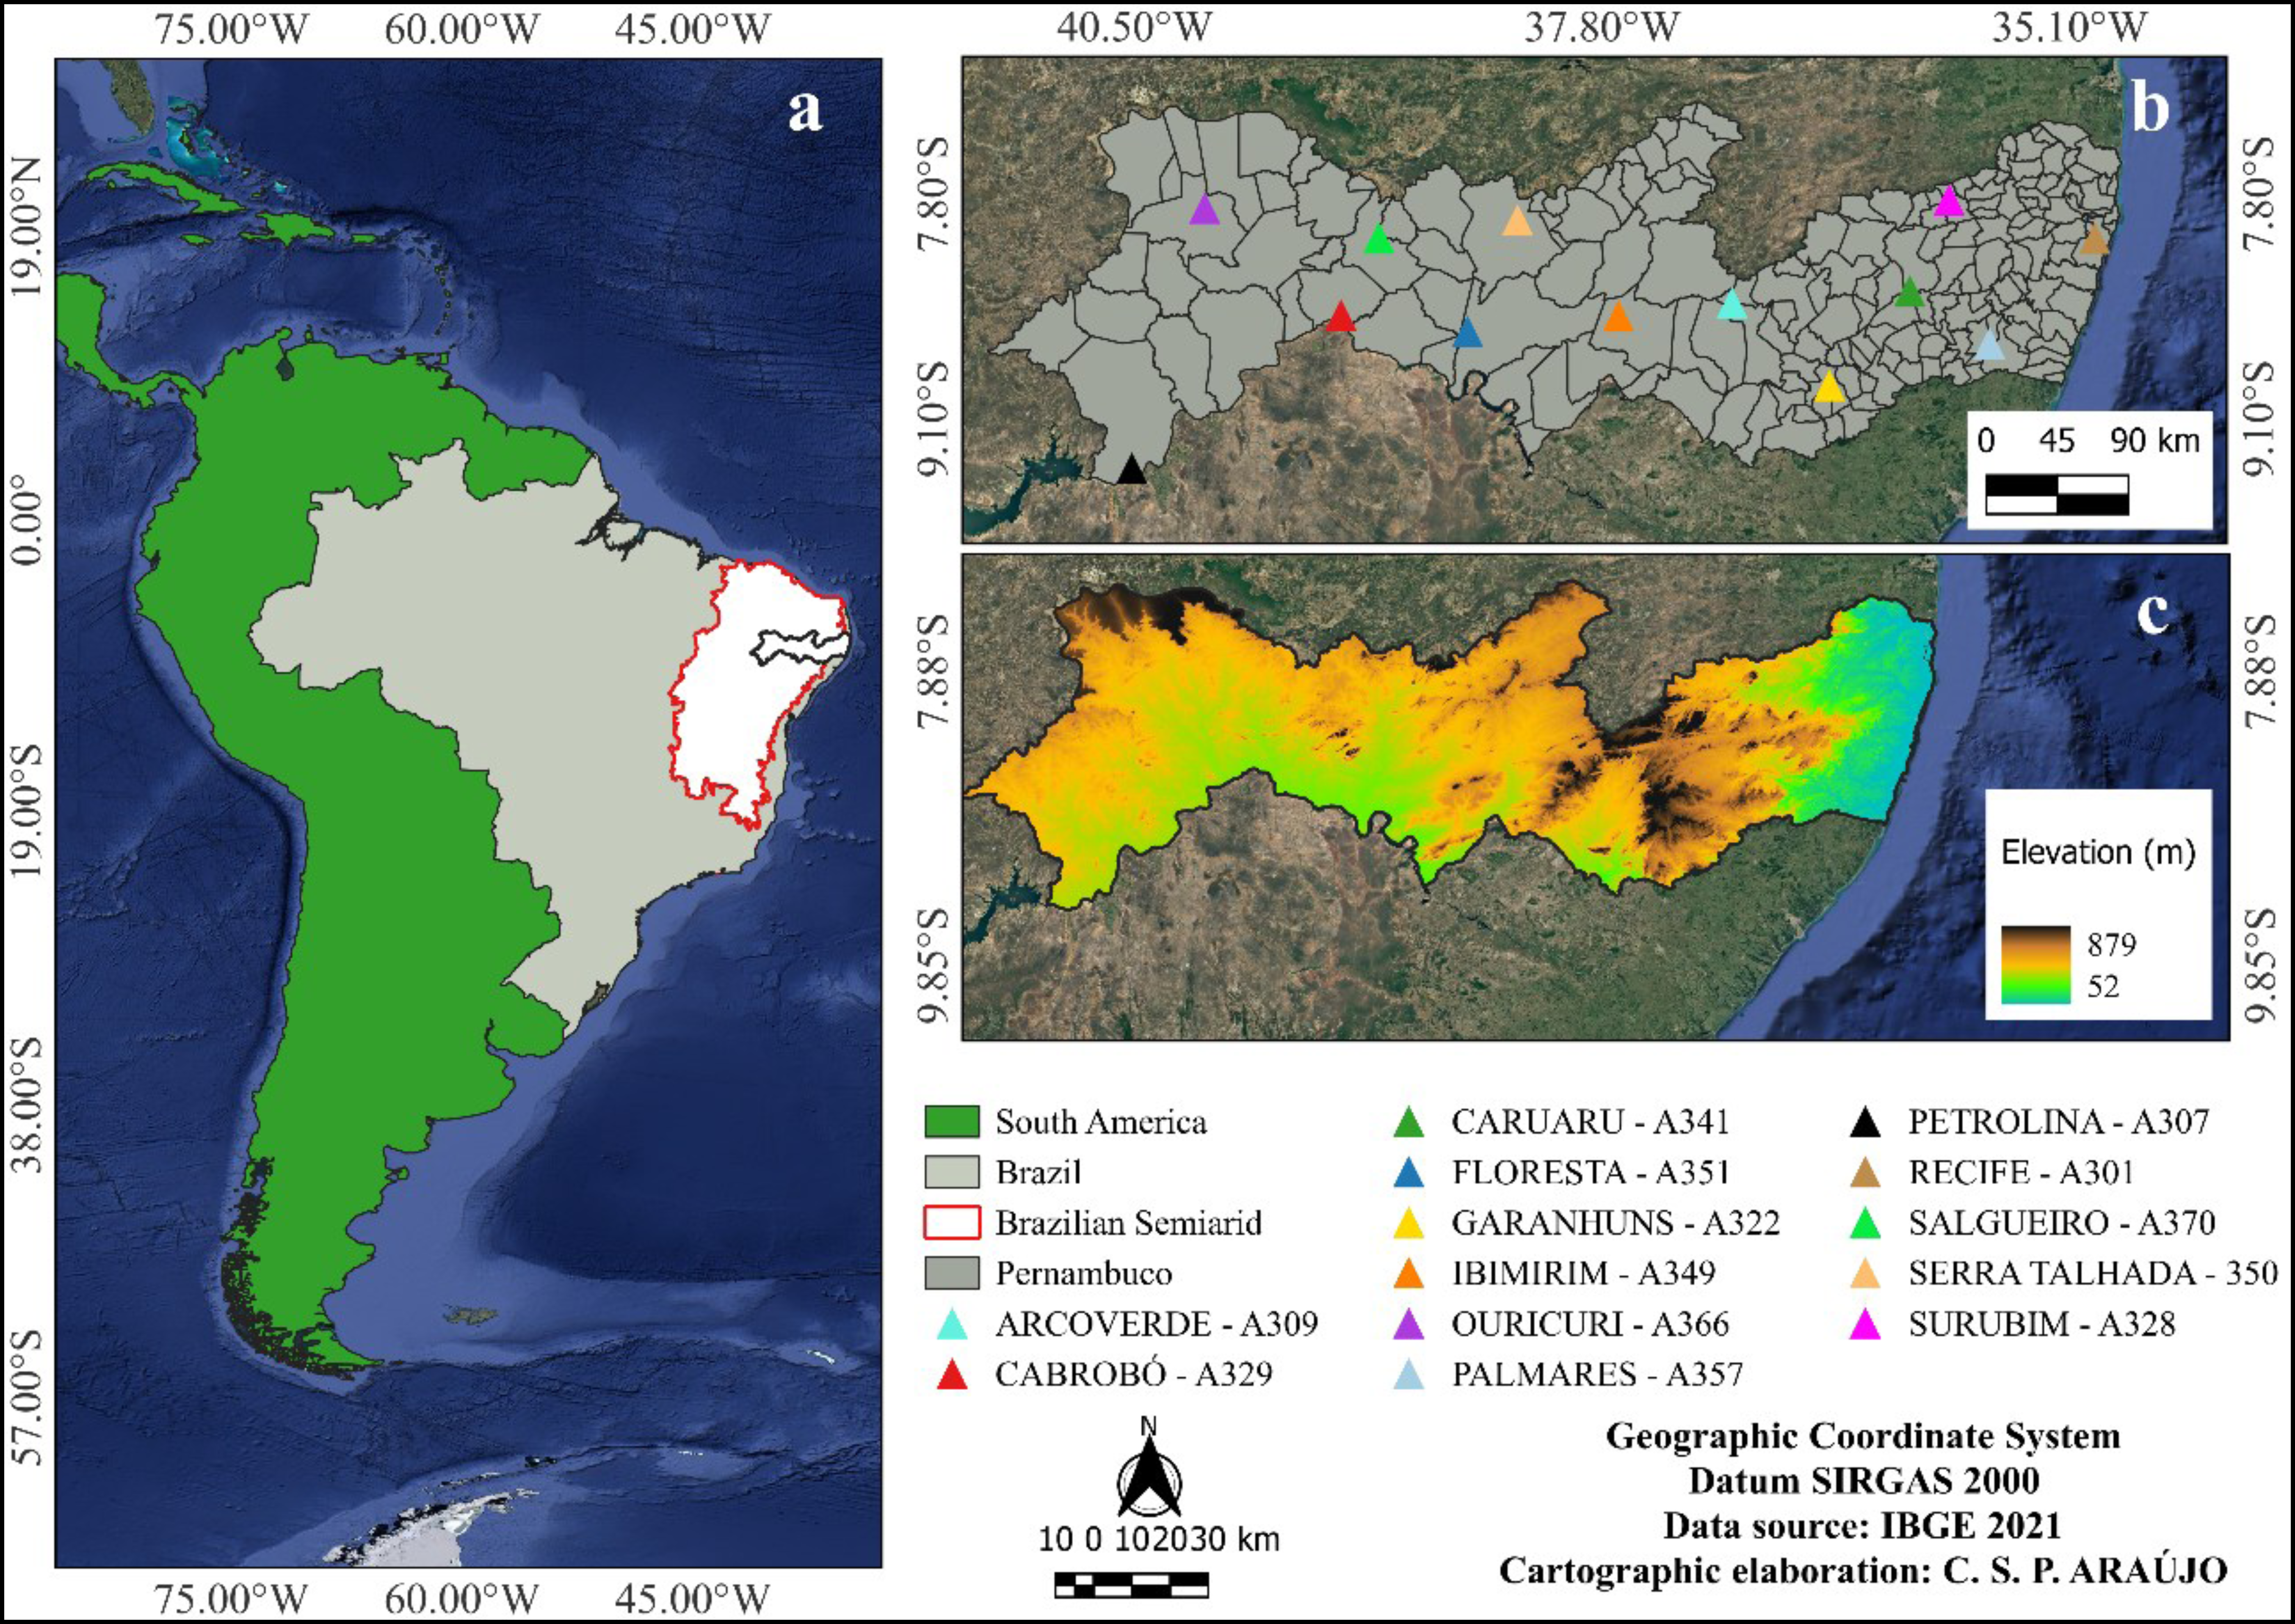
The present study was conducted in the state of Pernambuco, which is located in the northeastern region of Brazil, covering an area of approximately 98,146 km2 (Figure 1a) with three different climatic classes according to Köppen’s classification (ALVARES et al., 2014). The three climatic classes are called Hinterland, Agreste, and Forest Zone/Coastal.
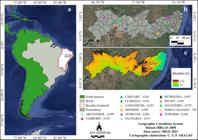
(a) Location of the state of Pernambuco in the northeastern region of Brazil; (b) Spatial distribution of surface automatic weather stations belonging to the National Institute of Meteorology [Instituto Nacional de Meteorologia] (INMET) network in the state of Pernambuco, identified by city and respective World Meteorological Organization – WMO code; (c) Elevation of the location where the stations are installed (m).
The Hinterland is a mesoregion characterized by an annual average temperature of 26 °C and a high-temperature range, with a minimum of 19 °C and a maximum of 34 °C, with prolonged droughts and poor distribution of precipitation throughout the year, ranging from 350 mm to 800 mm (GUEDES et al., 2016). The Agreste mesoregion is located among wet and dry areas, with temperatures ranging from 24 °C to 31 °C and annual rainfall ranging from 500 mm to 1000 mm. The Forest Zone/Coastal has a predominantly humid climate with average annual temperatures around 24 °C and average rainfall above 1400 mm, which may exceed 2000 mm in coastal regions (SILVA et al., 2020a).
The hourly temperature data (°C) and total precipitation (mm) were obtained in 13 automatic weather stations, belonging to the National Institute of Meteorology (INMET), located in 13 municipalities (Arcoverde, Cabrobó, Caruaru, Floresta, Garanhuns, Ibimirim, Ouricuri, Petrolina, Serra Talhada, Palmares, Recife, Surubim and Salgueiro) distributed in the state of Pernambuco (Figure 1b) at different elevations (Figure 1c). In this study, surface automatic weather stations made available by INMET were used because they had more homogeneous and reliable time series. Time series that showed failures were not used in this study.
The second database used in this study was obtained from ERA5-Land (global atmospheric reanalysis produced by the European Center for Medium-Range Weather Forecast - ECMWF) originated in the same locations and with the same frequency of surface data acquisition. The period adopted was 31 years, from 01/01/1990 to 12/31/2020, although failures found in the observed database led to the use of periods of distinctive data that were available for each station (Table 1).
The ERA-Land atmospheric reanalysis data were obtained from the Copernicus platform in the “.netCDF” format with the domain of -7°S to -10°S latitude and -34°W to -42°W longitude (the area which covers the state of Pernambuco), on a monthly scale with a spatial resolution of 0.10° or 9 km of horizontal resolution (COPERNICUS CLIMATE CHANGE SERVICE, 2022). For the air temperature variable, the measurement unit was converted from Kelvin (°K) to Celsius (°C), and for the total precipitation variable, the measurement unit was converted from meters (m) to millimeters (mm), to standardize the units with the surface data.
In possession of the hourly data, the air temperature monthly means and the monthly sum of total precipitation for each month were calculated. The surface hourly data collection was conducted by INMET from 00:00 UTC to 23:00 UTC of the same day, totalizing 24 hours daily, so all data used in this work were adjusted this way.
The ERA5-Land reanalysis performance on the estimation of air temperature and total precipitation data was assessed through statistical indices, and the data of automatic weather stations were adopted as standard. Coefficient of determination (R2) (Equation 1), Pearson coefficient (r) (Equation 2), Willmott’s (1981) agreement index (d) (Equation 3), Camargo and Sentelhas’ (1997) performance index (c) (Equation 4), root mean square error (RMSE) (Equation 5), systematic error (MBE) (Equation 6), and mean absolute error (MAE) (Equation 7) were calculated. In addition, graphs of data dispersion around the 1:1 line were analyzed. The statistical analysis was run on R software (R CORE TEAM, 2020), which uses data programming to compute and analyze the data. Pearson correlation coefficient and Camargo and Sentelhas’ (1997) performance index interpretations were carried out based on their respective classifications (Table 2).
Pearson correlation coefficient (r) and Camargo and Sentelhas’ performance index and respective classification.
RESULTS AND DISCUSSION
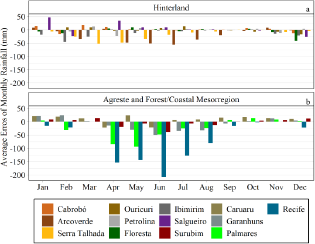
Figure 2 presents the total precipitation mean error (mm) calculated by the difference of total precipitation data estimated by ERA5-Land and the data observed in the surface automatic weather stations. The mean values of monthly total precipitation estimated by ERA5-Land underestimated the real values in most of the stations of the mesoregion of the hinterland (Figure 2a) and the entire mesoregion of the Forest Zone/Coastal. In contrast, in the mesoregion Agreste, specifically in the cities of Garanhuns and Surubim, ERA5- Land underestimated the total precipitation monthly mean values in the months from April to September and overestimated them from October to March. Therefore, the highest overestimates observed in the state were 46 mm (Figure 2a) and 25 mm (Figure 2b) in January (Salgueiro) and February (Garanhuns) in the mesoregions hinterland and Agreste mesoregions, respectively. In contrast, the highest underestimates observed were -208 mm, (Figure 2b), -56 mm (Figure 2a), and -50 mm (Figure 2b) in June (Recife), July (Arcoverde), and June (Garanhuns) comprehending the mesoregions of Forest Zone/Coastal, Agreste, and hinterland of the state, respectively.

Total precipitation monthly mean errors (mm) estimated by ERA5-Land subdivided by climatic mesoregions of Pernambuco: (a) hinterland, (b) Agreste, and Forest Zone/Coastal.
The mean total precipitation data simulated by ERA5- Land for the state of Pernambuco obtained a strong positive correlation with the data observed in the automatic weather station (AWS), according to the classification proposed by Callegari-Jacques (2009) for the correlation coefficient (r) (Table 3).
Statistical indices of ERA5-Land reanalysis performance in the mean monthly data of total precipitation (mm) compared to the data measured by surface automatic weather stations in the state of Pernambuco.
The precision coefficient R2 indicated that ERA5-Land has a precision from 43% to 68% for almost the entire state, except for the cities of Petrolina (R2 = 0.74) and Salgueiro (R2 = 0.73) located in the mesoregion of the hinterland (Table 3). Therefore, the values remained above 50% in most cities, pointing out how well the model fitted to the observed databases. A lower precision in the estimate by ERA5-Land was verified in the city of Caruaru (R2 = 0.43) in the Agreste mesoregion.
Pearson correlation indicates the intensity of the linear relationship between the two databases, ranging from -1 to +1. The values found in this study showed that ERA5-Land has precision above 70% in most of the cities analyzed (Table 3). This index represents a strong correlation between the estimated and observed data, validating the quality of precipitation data originating from ERA5-Land for the state of Pernambuco (Callegari-Jaqcues, 2009) (Table 2). The highest correlations were observed in the cities of Petrolina (r = 0.86), Salgueiro (r = 0.86), Serra Talhada (r = 0.83), and Cabrobó (r = 0.80) located in the mesoregion of the hinterland, and Recife (r = 0.82) in the mesoregion of Forest Zone/Coastal. However, the city of Caruaru (r = 0.66) obtained the lowest correlation, repeating the result obtained for the coefficient of determination R2.
Aparecido et al. (2019) in a study conducted in the state of Paraná, Brazil, with data estimated by the ERA- Interim analysis within the period from 1989 to 2014, identified differences in comparison to the ones observed by INMET for total precipitation. The ERA-Interim data were estimated for the North-West and North macroregions of the state, evidencing low precision, with R2 ranging from 0.17 to 0.57. Similarly, in this study, low R2 values were found for the hinterland, Agreste, and Forest Zone/Coastal. Medeiros-Feitosa and Oliveira (2020) carried out a comparative study between the precipitation data from rain gauges and the data from the TRMM satellite for the state of Ceará, Brazil, and obtained Pearson correlation values (r) close to those of this study, ranging from 0.89 to 0.96, ratifying the satisfactory result.
Willmott’s (1981) agreement index (d) (Table 3) showed values above 0.9960, denoting great agreement and approximation of the ERA5-Land data with the 1:1 line (Figure 3). The performance index (c) showed values above 0.70 for nearly the entire state, with minimum value (c = 0.66/ Arcoverde and Caruaru) and maximum value (c = 0.86/ Petrolina and Salgueiro) classified as good and excellent, respectively (Table 2). Valeriano et al. (2019), when assessing the total precipitation and air temperature from graded data from ECMWF and NASA for the southeastern region of Brazil, found agreement (d) above 0.7, which is slightly below the values found in this study, which remained above 0.99 for the entire state of Pernambuco. The authors also reported the difficulty in estimating precipitation data due to high spatial variability. Santos et al. (2019) validated the data estimated by the Global Precipitation Measurement (GPM) satellite for the south region of the Amazon satisfactorily, obtaining values for the index (d) between 0.86 and 0.97, closer to the ones found in this study.
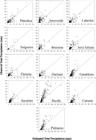
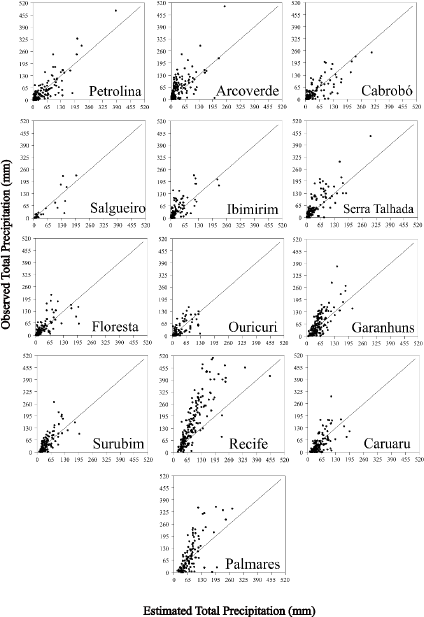
Total precipitation monthly means measured by surface automatic weather station (observed) and estimated by ERA5 -Land in municipalities of the state of Pernambuco, within the period from 1990 to 2020.
RMSE values found for the total accumulated monthly precipitation of the ERA5-Land reanalysis remained, in general, below 52 mm (Table 3), with a minimum value of 30 mm in the city of Ouricuri in the mesoregion of the hinterland. The highest RMSE values were observed in Arcoverde (RMSE = 52 mm) in the mesoregion of the hinterland, as well as Palmares (RMSE = 83 mm) and Recife (RMSE = 122 mm) in the mesoregion of Forest Zone/Coastal. Systematic error MBE, which indicates whether the model underestimates or overestimates the data observed in weather stations, pointed out that the ERA5-Land generated underestimated total precipitation compared to the data of the surface automatic stations of Cabrobó, Salgueiro, Ouricuri, and Caruaru, where ERA5-Land overestimated the precipitation values (Table 3). The tendency of the model to over or underestimate precipitation indicated by the error (MBE) can be confirmed through graph analysis (Figure 3).
In general, ERA5-Land underestimated the total precipitation values in nine of the 13 stations used, corresponding to 69% of the stations. The highest underestimate was verified in Recife (MBE = -72 mm) in the mesoregion of Forest Zone/Coastal, and the highest ERA5- Land was observed in Caruaru (MBE = 9 mm). The mean absolute error (MAE) generated by ERA5-Land for the total precipitation variable was below 34 mm in the greatest part of the state (Table 3), with a minimum value of 19 mm for the city of Petrolina, mesoregion of the hinterland. The highest errors generated by ERA5-Land were observed again in the municipalities of Recife (MAE = 83 mm) and Palmares (MAE = 53 mm) located in the Forest Zone/Coastal.
The highest RMSE, MBE, and MAE values observed in the city of Recife (Table 3) can be attributed to the high density of precipitation that occurs in this region, combined with the difficulty of the ERA5-Land model in estimating these data considering other factors (ice, snow, among others) instead of just precipitation, as considered in the observed data.
Santos et al. (2019) validated the data estimated by the Global Precipitation Measurement (GPM) satellite for the South region of the Amazon and found MAE and RMSE values that range from 36 to 72 mm and 14 to 72 mm, respectively, similar to the values found in this study. Valeriano et al. (2019) used a data grid from ECMWF and NASA for the Southeastern region of Brazil, and the results differed very little from the values found in this study. The RMSE values found in this study are close to those found by Valeriano et al. (2019) in 76 % of the stations for both models. In contrast, Aparecido et al. (2019), when analyzing the accuracy of ERA-Interim reanalysis, found RMSE values up to 78 mm and MAE of 74 mm for all the state of Paraná, Brazil, evidencing that this model, as it is a previous version of the one used in this study, has more limitations on estimating the precipitation variable.
Pereira et al. (2013) assessed the total precipitation data estimated by the TRMM satellite for Brazil and stated that the satellite data overestimated the data observed for the northeastern region by 9%. In contrast, for absolute error, they found values up to 53 mm for the Center-West region of Brazil, similar to this study, which also resulted in MAE values below 53 mm in 92% of the stations located in the state of Pernambuco, in the northeastern region of Brazil. This value is considered a relatively low error in terms of precipitation, evidencing good estimation by ERA5-Land.
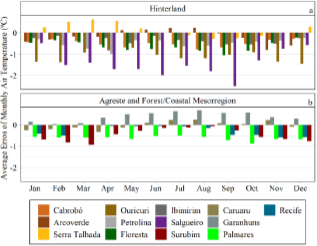
Figure 4 shows the error between the air temperature estimated by ERA5-Land reanalysis and observed by surface automatic weather stations. The mean values estimated by ERA5-Land for monthly air temperature underestimated the real values in most cities, for six stations in the hinterland and three in Agreste and Forest Zone/Coastal. Of these, it is important to highlight the highest underestimates of -2.50 °C, (Figure 4a), -0.94 °C (Figure 4b), and -0.87 °C (Figure 4b) in September (Salgueiro), March (Surubim) and October (Palmares) for the, Agreste and Forest Zone/Coastal of the state, respectively. In contrast, the highest overestimates observed in the state were 0.68 °C (Figure 4b) and 0.62 °C (Figure 4a) in August (Garanhuns) and March (Serra Talhada) in the Agreste and hinterland, respectively.
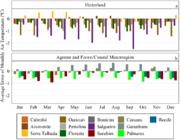
Monthly temperature mean errors (°C) estimated by ERA5-Land subdivided by climatic mesoregions of (a), (b) Agreste, and Forest Zone/Coastal.
In general, mean air temperature data were estimated with precision and accuracy by ERA5-Land for the entire state of Pernambuco, with values similar to those observed in the surface automatic weather stations (Table 4). ERA5-Land estimate resulted in precision higher than 81% for almost the entire state of Pernambuco, with the cities of Ibimirim and Floresta (R2 = 0.95) standing out in the mesoregion of the hinterland and the city of Palmares (R2 = 0.95) standing out in the mesoregion of Forest Zone/Coastal (Table 4). However, the lowest ERA5-Land precision was found in Salgueiro (R2 = 0.50) in the mesoregion of the hinterland.
Statistical indices of ERA5-Land reanalysis performance in the mean monthly data of mean air temperature (°C) compared to the data measured by surface automatic weather stations in the state of Pernambuco.
For all mean air temperature data, the results of the Pearson correlation denoted that ERA5-Land generated values above 92% for almost the entire state of Pernambuco (Table 4), which were classified as strong and very strong, according to Callegari-Jacques (2009) (Table 2). The highest and the lowest Pearson correlation coefficients were observed in the cities of Floresta (r = 0.98) and Salgueiro (r = 0.71), both in the mesoregion of the hinterland (Table 4), being classified as strong and very strong (Table 2), respectively.
Corroborating this study, several other authors also used data originating from global atmospheric reanalysis and reported high precision for mean air temperature. Aparecido et al. (2019), in a study carried out in the state of Paraná, Brazil, with ERA-Interim reanalysis data within the period from 1989 to 2014, obtained precision higher than 90% for mean air temperature in the entire state. Martins et al. (2017), in a study conducted in the Iberian Peninsula to estimate reference evapotranspiration from reanalysis data, reported R2 > 0.95 in 96% of maximum air temperature data, although minimum air temperature obtained this same precision level in 79% of the data. Monteiro, Sentelhas, and Pedra (2018) found good precision and accuracy in average air temperature (R2 = 0.73), maximum air temperature (R2 = 0.57), and minimum air temperature (R2 = 0.72) originating from the NASA POWER reanalysis for the Brazilian territory. Silva et al. (2020b), in a study conducted in the state of Pernambuco to validate air temperature using ERA5-Land reanalysis data throughout 2019, reported precision higher than 79% for the entire state.
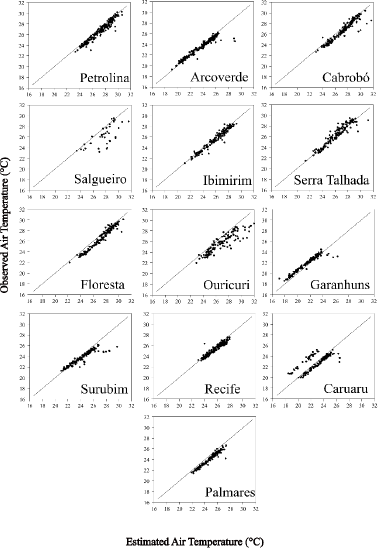
Willmott’s (1981) agreement index (d) (Table 4) remained always above 0.9914, justifying the data being very close to the 1:1 line (Figure 5), which is desirable. The index (c) by Camargo and Sentelhas (1997) denoted performance above 90% for almost the entire state, with a minimum value of 0.71 and a maximum of 0.98 for the cities of Salgueiro and Floresta, respectively, being classified as good and excellent (Table 2).
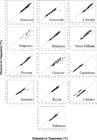
Mean air temperature measured by surface automatic weather station (observed) and estimated by ERA5 -Land in municipalities of the state of Pernambuco, within the period from 1990 to 2020.
Virgens Filho et al. (2013), when analyzing the performance of three models in the simulation of maximum air temperature daily series for the state of Paraná, obtained values close to those of this study with a “d” index above 0.86 and “c” index above 0.70. Valeriano et al. (2019), when comparing the air temperature and precipitation data estimated by ECMWF and NASA, for the Southeastern region of Brazil, found higher precision for the ECMWF model (d > 0.8) and lower precision for the NASA model (d < 0.6). Corroborating this study, Valeriano et al. (2019) found mean values of the index “d” of 0.96 (ECMWF) and 0.91 (NASA) and of R2 of 0.87 (ECMWF) and 0.74 (NASA), indicating that the temperature data estimated by these models, including ERA5-Land, can be used when the weather stations data are limited or in areas where there are no stations.
RMSE values for mean air temperature of the ERA5- Land reanalysis were less than 0.86 °C in a great part of the state of Pernambuco (Table 4), with a minimum value of 0.47 °C in Recife (mesoregion of Forest Zone/Coastal). The highest RMSE values were found in Salgueiro and Ouricuri (mesoregion of hinterland), with RMSE equal to 1.98 °C and 1.43 °C, respectively, followed by Caruaru (mesoregion Agreste) with RMSE = 1.11 °C. The error (MBE) indicated that the ERA5-Land reanalysis underestimates the air temperature data in almost the entire state, except for the cities of Serra Talhada (mesoregion hinterland), and Garanhuns (mesoregion Agreste), where the data were overestimated (Table 4). These results are confirmed when the relation between the data observed and estimated by the model is analyzed in graphs (Figure 5). ERA5-Land underestimated the mean air temperature values in 11 of the 13 stations used in this study, which corresponds to 84% of the stations. The highest underestimate occurred in Salgueiro (-1.41 °C), in the mesoregion of the hinterland in Pernambuco, whilst the highest ERA5-Land overestimate occurred in Garanhuns (0.40 °C), in the Agreste mesoregion of the state.
The amplitude of the RMSE values (0.47 °C to 1.98 °C) recorded in this study was lower than those reported in other studies. Valeriano et al. (2019) found RMSE values of up to 4.59 °C, and Aboelkhair, Morsy and El Afandi (2019), in a study carried out in India, found good performance for estimating mean air temperature when using NASA POWER reanalysis, with RMSE ranging from 0.96 to 2.54 °C. However, Aparecido et al. (2019) observed a range of errors similar to that found in the present study when using ERA-Interim reanalysis, with RMSE values ranging from 0.37 °C to 1.11 °C.
In the graph analysis for the city of Caruaru (Figure 5), a change can be observed in the data observed by the automatic weather stations and estimated by ERA5-Land, as the data are overestimated in a certain period and underestimated in another period. This tendency change is due to the transfer of the weather station to another location in the city of Caruaru, as further described by Araújo et al. (2022).
CONCLUSIONS
The Automatic Surface Weather Stations available from INMET did not interfere with the results, since the average air temperature and total precipitation data estimated by the ERA5-Land reanalysis were successfully validated, according to the statistical precision and accuracy indices analyzed. The ERA5-Land reanalysis obtained greater precision of the total accumulated precipitation in the backlands, followed by the Agreste and Forest Zone/Coastal, with a slight underestimation in most municipalities in the backlands and Agreste, and a moderate underestimation in the municipalities of the Forest Zone/Coastal. On the other hand, the ERA5-Land reanalysis was more precise in estimating the average air temperature in the Forest Zone/Coastal, followed by the backlands and Agreste, showing a slight underestimation in all stations, except Serra Talhada and Garanhuns, for which the data were slightly overestimated.
Total precipitation and air temperature generated by the ERA5-Land reanalysis can replace data from surface weather stations in case of limited data availability. However, the ERA5-Land model needs improvement for precipitation, due to low coefficients of determination (<0.74) in all mesoregions and high RMSE in the Forest Zone/Coastal and moderate RMSE in the Sertão and Agreste mesoregions. However, in the municipality of Salgueiro, a lower coefficient of determination (0.50) and higher RMSE (1.98 °C) were detected for the air temperature variable.
Data Availability:
The data that support the findings of this study can be made available, upon reasonable request, from the corresponding author.
REFERENCES
- ABOELKHAIR, H.; MORSY, M.; EL AFANDI, G. Assessment of agroclimatology NASA POWER reanalysis datasets for temperature types and relative humidity at 2 m against ground observations over Egypt. Advances in Space Research, 64: 129-142, 2019.
- ALVARES, C. A. et al. Köppen’s climate classification map for Brazil. Meteorologische Zeitschrift, 22: 711-728, 2014.
- APARECIDO, L. E. O. et al. Accuracy of ECMWF ERA-Interim Reanalysis and its Application in the Estimation of the Water Deficiency in Paraná, Brazil. Revista Brasileira de Meteorologia, 34: 515-528, 2019.
- ARAÚJO, C. S. P. et al. Evaluation of air temperature estimated by ERA5-Land reanalysis using surface data in Pernambuco, Brazil. Environmental Monitoring Assessment, 194: 1-13, 2022.
- CALLEGARI-JACQUES, S. M. Bioestatística: princípios e aplicações. 1. ed. Porto Alegre, RS: Artmed, 2009. 264 p.
- CAMARGO, A. P.; SENTELHAS, P. C. Avaliação do desempenho de diferentes métodos de estimativa da evapotranspiração potencial no estado de São Paulo, Brasil. Revista Brasileira de Agrometeorologia, 5: 89-97, 1997.
- CASTRO, B. V. O.; SILVA, F. P.; PIRES, G. D. Avaliação de parâmetros meteorológicos gerados pela reanálise ERA 5 para a cidade de Seropédica, região da Baixada Fluminense-RJ. Revista Engenharia, Meio Ambiente e Inovação, 2: 7-16, 2019.
- CHEN, Y. et al. Spatial performance of multiple reanalysis precipitation datasets on the southern slope of central Himalaya. Atmospheric Research, 250: 1-12, 2020.
- COAN, B. P.; BACK, A. J.; BONETTI, A. V. Precipitação mensal e anual provável no Estado de Santa Catarina. Revista Brasileira de Climatologia, 15: 122-142, 2015.
- COSTA, M. S. et al. Tendências observadas em extremos de precipitação sobre a região Semiárida do Nordeste do Brasil. Revista Brasileira de Geografia Física, 8: 1321-1334, 2015.
-
COPERNICUS CLIMATE CHANGE SERVICE. ERA5-Land monthly averaged data from 1950 to present. Copernicus Climate Change Service (C3S) Climate Data Store (CDS) Available at: <https://cds.climate.copernicus.eu/>. Access on: Jan, 28. 2023.
» https://cds.climate.copernicus.eu/ - ESSOU, G. R.; ARSENAULT, R.; BRISSETTE, F. P. Comparison of climate datasets for lumped hydrological modeling over the continental United States. Journal of Hydrology, 537: 334-345, 2016.
- GUEDES, R. V. S. et al. Identificação e classificação espaço-temporal de eventos críticos chuvosos ou secos ocorridos em Pernambuco. Ciência e Natura, 38: 413-428, 2016.
- JANATIAN, N. et al. A statistical framework for estimating air temperature using MODIS land surface temperature data. International Journal of Climatology, 37: 1181-1194, 2016.
- MARTINS, D. S. et al. Assessing reference evapotranspiration estimation from reanalysis of weather products. An application to the Iberian Peninsula. International Journal of Climatology, 37: 2378-2397, 2017.
- MEDEIROS-FEITOSA, J. R. M.; OLIVEIRA, C. W. Comparative study of precipitation data from the TRMM satellite and pluviometric stations in the state of Ceará, Brazil. Revista Geográfica de América Central, 2: 257-280, 2020.
- MONTEIRO, L. A.; SENTELHAS, P. C.; PEDRA, G. U. Assessment of NASA/POWER satellite-based Weather system for Brazilian conditions and its impact on sugarcane yield simulation. International Journal of Climatology, 38: 1571-1578, 2018.
- NEWMAN, A. J. et al. Gridded ensemble precipitation and temperature estimates for the contiguous United States. Journal of Hydrometeorology, 16: 2481-2500, 2015.
- PEREIRA, G. et al. Avaliação dos dados de precipitação estimados pelo satélite TRMM para o Brasil. Revista Brasileira de Recursos Hídricos, 18: 139-148, 2013.
- RIBEIRO, A. A. et al. Comparação entre dados meteorológicos obtidos por estações convencionais e automáticas no estado do Piauí, Brasil. Revista Irriga, 2: 220-235, 2017.
- R CORE TEAM. R: A language and environment for statistical computing. R Foundation for Statistical Computing, Vienna, Austria, 2020. R: The R Project for Statistical Computing (r-project.org).
- SANTOS, L. O. F. et al. Validation of rainfall data estimated by GPM satellite on the Southern Amazon region. Revista Ambiente & Água, 14: 1-9, 2019.
- SILVA, C. C. S. et al. Complexity analysis of monthly precipitation in the state of Pernambuco using Sample Entropy. Research, Society and Development, 9: 1-18, 2020a.
- SILVA, L. M. C. et al. Validation of air temperature data obtained from the ERA5-land reanalysis in the state of Pernambuco, Brazil. In: INOVAGRI MEETING VIRTUAL, 1., 2020, São Paulo. Anais… São Paulo: UNESP, 2020b. p. 1-10.
- TAREK, M.; BRISSETTE, F. P.; ARSENAULT, R. Evaluation of the ERA5 reanalysis as a potential reference dataset for hydrological modeling over North America. Hydrology and Earth System Sciences, 24: 2527-2544, 2020.
- TURCO, J. E. P.; CARLETO, N. Integridade de dados meteorológicos para uso em modelo hidrológico. Revista Brasileira de Agricultura Irrigada, 11: 2084-2097, 2017.
- VALERIANO, T. T. B. et al. Evaluation of air temperature and rainfall from ECMWF and NASA gridded data for southeastern Brazil. Theoretical and Applied Climatology, 137: 1925-1938, 2019.
- VIANNA, L. F. N. et al. Bancos de dados meteorológicos: Análise dos metadados das estações meteorológicas no estado de Santa Catarina, Brasil. Revista Brasileira de Meteorologia, 32: 53-64, 2017.
- VIRGENS FILHO, J. S. et al. Desempenho dos modelos CLIGEN, LARS-WG e PGECLIMA_R na simulação de séries diárias de temperatura máxima do ar para localidades do estado do Paraná. Revista de Engenharia Agrícola, 33: 538-547, 2013.
- WILLMOTT, C. J. On the validation models. Physical Geography, 2: 184-194, 1981.
Edited by
-
Editor in Chief
Aurélio Paes Barros Júnior
-
Section Editor:
João Everthon da Silva Ribeiro