Initial vegetative vigor of Coffea canephora genotypes grown in the western amazon
ABSTRACT
Understanding the vegetative vigor of clonal genotypes under nursery conditions is essential for efficient seedling production and the development of new cultivars. This study aimed to evaluate the initial vegetative vigor of Coffea canephora genotypes cultivated in the Western Amazon. Twenty-one genotypes from the Embrapa Germplasm Bank, four registered cultivars, and three publicly available clones were assessed in a completely randomized design with four replicates and six plants per plot. Vegetative traits were evaluated 128 days after planting the cuttings and included: shoot length (SL), shoot diameter (SD), number of roots (NR), root volume (RV), shoot dry mass (SDM), root dry mass (RDM), total dry mass (TDM), leaf area (LA), the SDM/RDM ratio, and the Dickson Quality Index (DQI). Genotype performance and experimental accuracy were analyzed using genetic parameter estimates and genotype divergence. All commercial genotypes, except GJ25 and AS2, exhibited superior vegetative vigor during the seedling stage. Genotype BAG15 was initially the most vigorous. Genotypes BAG30, BAG31, BAG21, BAG29, BAG19, BAG26, BAG24, BAG28, BAG39, BAG41, BAG33, BAG38, BAG43, BAG23, BAG34, and BAG32 were considered promising due to their high RDM/SDM ratio and/or proximity to ideotype III, which was characterized by greater root development a trait likely to enhance survival following transplanting in the field.
Keywords:
Conilon; Robusta; Coffee seedlings; Vegetative growth; Genetic divergence.
RESUMO
O conhecimento do vigor vegetativo de genótipos clonais em condições de viveiro é relevante para a produção de mudas e multiplicação de novas cultivares. Nesse sentido, objetivouse avaliar o vigor vegetativo inicial de genótipos de Coffea canephora cultivados na Amazônia Ocidental. Para isso foram avaliados 21 genótipos provenientes do Banco de Germoplasma da Embrapa, quatro cultivares registradas e três clones comercializados em domínio público, em delineamento inteiramente casualizado, com quatro repetições com seis plantas por parcela. As características vegetativas avaliadas aos 128 dias após o plantio das estacas foram: comprimento da brotação (CB), diâmetro da brotação (DB), número de raízes (NR), volume de raízes (VR), massa seca da parte aérea (MSPA), massa seca das raízes (MSR), massa seca total (MST), área foliar (AF), relação MSR/MSPA e índice de qualidade de Dickson. O desempenho dos genótipos e a precisão dos experimentos foram interpretados considerando estimativas de parâmetros genéticos e a divergência entre os genótipos. Todos os genótipos comerciais, com exceção dos GJ25 e AS2, apresentam vigor vegetativo superior na fase de produção de mudas. O genótipo BAG15 se destacou inicialmente como o mais vigoroso. Os genótipos BAG30, BAG31, BAG21, BAG29, BAG19, BAG26, BAG24, BAG28, BAG39, BAG41, BAG33, BAG38, BAG43, BAG23, BGA34 e BAG32 se apresentaram como promissores por possuírem alta relação MSR/ MSPA e, ou por estarem próximos ao ideotipo III, que apresentou maior quantidade de raiz, o que pode influenciar positivamente na sobrevivência das plantas após o transplante em campo.
Palavras-chave:
Conilon; Robusta; Mudas de café; Crescimento vegetativo; Divergência genética.
INTRODUCTION
In the Brazilian Amazon, Coffea canephora is the most widely cultivated coffee species due to its superior adaptability to tropical climates (ESPINDULA et al., 2025). This species is diploid, self-sterile, and allogamous, and exhibits gametophytic self-incompatibility, which promotes genetic diversity (SCHMIDT et al., 2023). C. canephora crops may be established through sexual propagation by seeds or asexual propagation by cuttings. Vegetative propagation preserves the genotypic value of the mother plants, transferring favorable traits such as higher yield and improved resistance to pests and diseases (ESPINDULA et al., 2022). The genetic traits of the mother plant are passed to its descendants (PENCE et al., 2024), leading to plantations with more uniform growth and fruiting, which can enhance both yield and bean quality (SOUSA et al., 2024).
Successful cloning depends on careful management throughout the propagation process. This includes selecting healthy, physiologically vigorous cuttings (KOLLN et al.,2022), choosing appropriate containers (VERDIN FILHO et al., 2021) and substrates (BALBINO et al., 2024), and maintaining proper environmental conditions. When these factors are optimized, variations in propagule survival (NASCIMENTO et al., 2023), and biomass production and distribution (MALAU; SIANTURI; SIHOTANG, 2023) are more likely to reflect genetic differences among clones.
Seedling quality significantly affects field performance and crop success (MALAU; SIANTURI; SIHOTANG, 2023). Seedlings with low vegetative vigor in the nursery may show weak development in the field, limiting early growth and reducing yield in the first harvests.
The Coffee Breeding Program at Embrapa Rondônia has prioritized the development of clonal cultivars since 1978. In the first two decades of the 21st century, two groups of clones were released: the multiclonal cultivar Conilon BRS Ouro Preto in 2012 and a set of ten monoclonal cultivars known as Robustas Amazônicos, launched in 2019 (ESPINDULA et al., 2025). Continuing this effort, Embrapa has maintained a clonal competition trial consisting of 21 elite genotypes selected from the Active Germplasm Bank. These genotypes are being evaluated alongside registered cultivars and publicly available clones based on agronomic traits such as yield potential, processing efficiency, pest and disease tolerance, and bean characteristics, particularly sensory quality.
Given that the seedling production phase is a key criterion for nurserymen when selecting and multiplying new cultivars, this study aimed to assess the initial vegetative vigor of the C. canephora genotypes included in the competition trial for clonal cultivar development.
MATERIALS AND METHODS
The initial vegetative vigor of C. canephora clones was assessed by monitoring seedling growth under nursery conditions. The experiment was conducted at the Embrapa Experimental Field in Ouro Preto do Oeste, Rondônia (10°43′55″ S, 62°15′19″ W; altitude 300 m). The region‟s climate is classified as tropical monsoon (Am) according to Köppen‟s system, with an average annual temperature of 25 °C and approximately 2,000 mm of rainfall per year (ALVARES et al., 2013).
Seedlings were propagated from cuttings collected from a clonal garden composed of the genotypes under evaluation, established as part of the Restricted Clonal Trial (RCT) of Embrapa Rondônia‟s Coffee Breeding Program. The RCT and clonal garden were established in February 2019 using hybrid clones from the Active Germplasm Bank (BAG) of C. canephora, along with registered cultivars and publicly available clones.
The seedling performance trial included 21 genotypes from the BAG, four registered cultivars, and three clones of undefined genetic origin that are commercially available (Table 1). The experiment followed a completely randomized design with 28 treatments and four replicates. Each experimental plot consisted of six cuttings or seedlings.
Clonal cuttings were collected from secondary orthotropic stems (shoots) of the mother plants and immediately transported to Embrapa‟s seedling production nursery in Ouro Preto do Oeste, RO. The nursery was covered with a 50% shade screen. For each treatment, 24 semihardwood cuttings measuring 6 cm in length (from the base to the leaf insertion point) were selected. Each cutting retained a pair of leaves, trimmed to maintain two-thirds of their original area. The diameter of all cuttings was standardized to 7 mm. The growth period from planting to seedling evaluation spanned 128 days, corresponding to the period from October 2022 to February 2023.
Cuttings were planted in 280 cm3 reusable polyethylene tubes, at a depth of 2 to 3 cm. Before planting, the tubes were filled with Vida Verde Tropstrato HT®, a commercial substrate composed of pine bark, expanded vermiculite, simple superphosphate, and potassium nitrate. The substrate was enriched with 5,000 g m⁻3 of Basacot® Plus 6M fertilizer (16% N, 8% P, 12% K, 2% Mg, 5% S, 0.4% Fe, 0.02% B, 0.02% Zn, 0.05% Cu, 0.06% Mn, and 0.015% Mo).
The tubes were placed in trays on elevated benches inside the nursery, where they received continuous irrigation via a misting system connected to a timer. The irrigation schedule was adjusted over time as follows: 10 seconds every 5 minutes during the first 30 days; 12 seconds every 6 minutes from day 30 to 60; 30 seconds every 10 minutes from day 60 to 80; and 1 minute every 30 minutes from day 80 onward.
At 128 days after planting, seedlings were evaluated for the following vegetative characteristics: a) Shoot length (SL), measured from the point of insertion on the cutting to the apical meristem; b) Shoot diameter (SD), measured 3 cm above the shoot insertion point; c) Number of roots (NR), counted directly; d) Root volume (RV), determined using a graduated cylinder by volume displacement; e) Shoot dry mass (SDM), obtained by weighing the shoot (including the cutting) after oven-drying at 65 °C to constant mass; f) Root dry mass (RDM), determined similarly by drying and weighing; g) Total dry mass (TDM), calculated as the sum of SDM and RDM; h) Leaf area (LA), measured using DDA (Digital Area Determinator) software (FERREIRA; ROSSI; ANDRIGHETTO, 2008); i) RDM/SDM ratio; j) Dickson Quality Index (DQI), calculated using the formula: DQI = TDM / [(SL/SD) + (SDM/RDM)] (DICKSON; LEAF; HOSNER, 1960).
Statistical analysis
Estimates from the F-test in the analysis of variance, the environmental coefficient of variation (CVe), the genetic coefficient of variation (CVg), and the genotypic coefficient of determination (H2) were interpreted. Means were grouped using the Scott-Knott test (p ≤ 0.05).
To assess the degree of association between traits, estimates of both simple and partial correlations among the evaluated characteristics were obtained. Simple correlation estimates were calculated using the following expression (CRUZ; REGAZZI; CARNEIRO, 2004):
COV(x,y): covariances between traits x and y; σx2 phenotypic variance of trait x, σx2: phenotypic variance of trait y. Estimates of partial correlation coefficients were calculated using the following expression (CRUZ; REGAZZI; CARNEIRO, 2004):
rxy.z: partial correlation between traits x and y, with the effect of trait z removed, rxy: simple correlation between x and y, rxz: simple correlation between x and z, ryz: simple correlation between y and z.
Genotypic divergence was estimated using the generalized Mahalanobis distance (CRUZ; REGAZZI;
CARNEIRO, 2004), along with the Tocher clustering algorithm, which maximizes variability among groups and minimizes variation within groups. Principal component analysis (PCA) was applied to reduce data dimensionality and to represent the genotypes in a dispersion plot, associating them with reference points that indicate the maximum and minimum values of the evaluated traits (ROCHA et al., 2005).
Genetic progress was estimated based on direct selection gains, correlated response, and selection indices. The correlated response quantifies changes in non-target traits resulting from the selection of a primary trait and was calculated using the following expression (RESENDE, 2016):
R(y/x): indirect genetic gain in trait y resulting from selection for trait x, k: standardized selection differential, r(x,y): correlation between traits x and y, hx: heritability of trait x, hy: heritability of trait y, σy: phenotypic standard deviation of trait y. Genotypic values were used to estimate genetic progress based on the rank-sum (MULAMBA; MOCK, 1978) and the Smith & Hazel index (SMITH, 1936). All analyses were conducted using the GENES software (CRUZ, 2016).
RESULTS AND DISCUSSION
The F-test from the analysis of variance for genotype effects was significant for all evaluated traits, indicating the presence of genetic variability among the genotypes (Table 2). The F-values ranged from 7.81 for the root-to-shoot dry mass ratio to 53.76 for total dry mass, the latter indicating that the variance among treatments was approximately 54 times greater than the experimental error variance.
Summary of the analysis of variance and genetic parameters for vegetative traits of clonal seedlings from 28 Coffea canephora genotypes (21 BAG accessions, 4 registered cultivars, and 3 publicly available clones) grown in the Western Amazon, Brazil.
Genetic variability among C. canephora genotypes is of significant interest to breeding programs aimed at developing new cultivars (FERRÃO et al., 2021), and this diversity is already evident during the seedling stage. Greater initial vigor at this phase can translate into economic benefits for nurserymen responsible for multiplying newly developed cultivars. Furthermore, early vegetative vigor may result in enhanced initial field growth, reduced mortality, and increased productivity in the first harvests.
The DQI had an average value of 0.42, ranging from 0.30 to 0.75. The RDM/SDM averaged 0.35, with values between 0.23 and 0.50. Total dry mass (TDM) showed an average of 2.25 g, ranging from 1.28 g to 5.48 g.
Estimates of the environmental coefficient of variation (CVe) ranged from 8.52% to 19.76% and were consistently lower than the genetic coefficient of variation (CVg), which ranged from 11.32% to 50.61%. This indicates that, overall, genetic effects outweighed environmental effects (Table 2). The traits with the highest CVg values were root volume (37.58%), shoot length (45.91%), and leaf area (50.61%).
The genetic coefficient of variation (CVg) defined as the ratio between the genetic standard deviation and the experimental mean quantifies the genetic variability of each trait. When compared with the CVe, a CVg/CVe ratio close to or greater than one suggests favorable conditions for obtaining genetic gains through selection (NASCIMENTO et al., 2014). This condition was met for all evaluated vegetative traits (Table 2), particularly for leaf area (2.96), shoot dry mass (3.59), and total dry mass (3.63).
Estimates of the genotypic coefficient of determination (H2), which reflect the proportion of phenotypic variance explained by genetic variance for fixed effects, were considered high for all traits, exceeding 85% (Table 2) (NASCIMENTO et al., 2014). These values indicate low environmental influence and a strong genetic contribution to trait expression under greenhouse conditions (FERREIRA et al., 2016).
In general, C. canephora seedling growth in nurseries is assessed by shoot length and diameter, as well as by root, shoot, and total dry mass (VERDIN FILHO et al., 2021), along with leaf area and root volume. From these primary traits, secondary measures are derived especially the Dickson Quality Index and the root-to-shoot ratio which evaluate the balance and distribution of biomass between plant parts (KOLLN et al.,2022). In this study, in addition to those traits, simple and partial correlations were analyzed, and principal component analysis was used to identify genotypes with superior initial vigor during the nursery phase. The Scott- Knott clustering test revealed significant differences among genotypes for all vegetative traits analyzed (Tables 3 and 4). Based on these phenotypic differences, genotypes were grouped into statistically homogeneous clusters according to performance for each evaluated trait.
Mass relationships and weights of clonal seedlings from 28 Coffea canephora genotypes at 128 days after planting in Western Amazonia, Brazil.
Vegetative traits of clonal seedlings from 28 Coffea canephora genotypes at 128 days after planting in the Western Amazon, Brazil.
The Dickson Quality Index (DQI) ranged from 0.32 to 0.61 (Table 3). This variation allowed the formation of four distinct quality groups in decreasing order of seedling performance. Genotypes BAG15 and GJ8 showed the highest DQI values, followed by BRS2336, BRS3210, and BAG30. The next group included BRS1216, BAG31, BRS3220, BAG21, BAG29, BAG19, BAG26, BAG22, BAG24, BAG28, BAG39, and BAG41. The final group, with the lowest DQI values, comprised BAG33, BAG38, AS2, GJ25, BAG27, BAG43, BAG23, BAG34, BAG35, and BAG32.
The DQI is a widely used parameter for assessing seedling quality, with higher values indicating better seedling performance(GOMES et al., 2019). The average DQI observed in this study was 0.42 (Table 2), similar to the average of 0.40 (VERDIN FILHO et al., 2020).
Among the genotypes evaluated, BAG15 and GJ8 exhibited the highest seedling quality based on DQI values. The BAG genotypes included in this study were selected from the Embrapa collection for their potential in the development of new cultivars. An ideal cultivar must exhibit a set of favorable traits, and strong early vigor can facilitate seedling production in nurseries. BAG15, a promising genotype from Embrapa Rondônia‟s Coffee Breeding Program, has already shown positive results under field conditions (MORAES et al., 2021).
The GJ8 clone, which is widely commercialized in the public domain and cultivated in 89% of coffee plantations in the state of Rondônia (ESPINDULA et al., 2022), also showed strong nursery performance. Other publicly available clones also stood out. The BRS-prefixed genotypes cultivars officially released by Embrapa presented intermediate DQI values ranging from 0.46 to 0.54. In contrast, AS2 (0.38) and GJ25 (0.37), two clones with no defined genetic origin but available in the public domain, were among those with the lowest DQI values.
Except for BAG15 and BAG30, all other BAG genotypes exhibited intermediate or low DQI values. Considering market acceptance, genotypes with inferior seedling quality would need to demonstrate strong field performance to be considered for commercial release. This applies to GJ25 and AS2, which, despite their poor performance in the nursery, have shown favorable field performance (SCHMIDT et al., 2022).
The root-to-shoot dry mass ratio (RDM/SDM) and root dry mass (RDM) allowed for the formation of four distinct groups, with values ranging from 0.25 to 0.43 and 0.42 g to 0.89 g, respectively (Table 3). Variation in shoot dry mass (SDM) enabled the formation of seven groups, with values ranging from 1.07 g to 3.55 g.
Total dry mass (TDM) also resulted in seven distinct groups for biomass accumulation (Table 3). In decreasing order, the genotypes were grouped as follows: Group 1: BAG15 (highest biomass accumulation); Group 2: BRS2336; Group 3: GJ8, BRS1216, BRS3220; Group 4: BRS3210, BAG38; Group 5: BAG19, BAG26, BAG22, BAG24, GJ25, BAG27; Group 6: BAG30, BAG31, BAG29, BAG28, BAG40, BAG33, BAG34; and Group 7: BAG21, BAG39, BAG41, AS2, BAG43, BAG23, BAG32 (lowest biomass accumulation).
An ideal RDM/SDM ratio for seedling production is approximately 1:2 (CALDEIRA; FENILLI; HARBS, 2008). In this context, BAG15, the genotype with the highest DQI, had the lowest RDM/SDM ratio. In contrast, AS2 one of the genotypes with the lowest DQI was among those with the highest RDM/SDM values. Other genotypes with ratios close to 1:2 included BAG21, BAG24, BAG39, BAG33, and BAG43 (Table 3).
Proper biomass allocation between shoot and root systems is critical, as an excessively large shoot relative to the root may compromise water and nutrient uptake and increase water loss through transpiration. A balanced root-to-shoot ratio enhances water and nutrient translocation and supports seedling establishment, particularly under field conditions where adequate water availability is essential (GOMES et al., 2019).
Variation in shoot traits led to the formation of five groups for shoot length (SL), ranging from 2.11 cm to 12.15 cm; four groups for leaf area (LA), with values from 69.53 cm2 to 433.68 cm2 per leaf; and three groups for shoot diameter (SD), ranging from 2.04 cm to 3.45 cm (Table 4). In the root system, five groups were identified based on the number of roots (NR), ranging from 3.02 to 7.39, and four groups for root volume (RV), with values from 1.25 cm3 to 4.01 cm3 (Table 4).
The root system was evaluated based on root number (NR), root volume (RV), and root dry mass (RDM) (Tables 3 and 4). Genotypes BAG15 and GJ8 stood out during the early seedling phase due to their more robust root system development, showing the highest values for all root-related traits (NR, RV, and RDM). Genotypes BRS2336 and BRS1216 also exhibited high NR and RV values and were grouped with BRS3210, BRS3220, and BAG38 in the second-highest group for RDM.
A well-developed root system plays a critical role in the early growth and establishment of plants in the field, as well as in enhancing drought tolerance. Greater root development facilitates more efficient absorption of water and nutrients and increases soil contact surface area, which is associated with higher root dry mass (ZHANG et al., 2025).
Among the vegetative traits, SDM and TDM showed the greatest genetic variability, each forming seven groups (Table 3). SL and NR formed five groups (Table 4), followed by DQI, RDM/SDM, LA, RV, and RDM, each forming four groups. SD exhibited the lowest variability, with three distinct groups.
In general, simple correlation estimates were positive and significant (Table 5), except for the non-significant associations between NR and DQI (r = 0.18) and SL and DQI (r = 0.24). Partial correlation estimates, however, revealed both positive and negative significant correlations (Table 5).
Simple and partial correlations among vegetative traits of clonal seedlings from 28 Coffea canephora genotypes at 128 days after planting in the Western Amazon, Brazil.
RDM was positively correlated with both DQI and LA but negatively correlated with SDM (Table 5). The leaf area is associated with the photosynthetically active surface of the seedling, which can enhance light interception and consequently increase the production of photoassimilates essential for growth (SALES et al., 2017). However, seedlings with larger leaf areas particularly when there is an imbalance between the shoot and root systems, as suggested by the negative correlation between SDM and RDM may experience increased transpiration, which could compromise establishment under field conditions.
Some relationships demonstrated changes between simple and partial correlations. For example, the correlation between DQI and SL, which was weak in the simple correlation analysis (r = 0.24), became a significant and strong negative correlation (r = -0.96) in the partial analysis. Partial correlation provides a clearer interpretation by isolating the effect of other variables, offering insights into possible causeand-effect relationships. In this case, the negative correlation between DQI and SL may be related to excessive shoot elongation, resulting in seedlings of inferior quality. Height alone is not a reliable indicator of seedling quality, as it is influenced by environmental conditions and may reflect etiolation where seedlings reach the target height prematurely but lack the structural quality required for successful field performance.
The production of clonal seedlings is a complex process that initially depends on the physiological quality of the cutting. In the early stages, cuttings rely on their nutrient reserves to survive and initiate rooting. Once the root system is established, shoot and leaf development occurs simultaneously, supporting biomass accumulation and overall seedling growth (KOLLN et al.,2022) These growth-related traits are critical for predicting survival under field conditions (GALLEGOS-CEDILLO et al., 2021) and are widely used as indicators of seedling quality.
To evaluate genotype diversity across all traits in a single analysis, principal component analysis (PCA) was performed using reference points representing ideal maximum and minimum values for shoot and root traits (Figure 1).
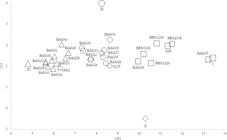
Principal component scatter plot of vegetative traits in clonal seedlings of 28 Coffea canephora genotypes at 128 days after planting in the Western Amazon, Brazil.
The ideal references for vegetative traits were labeled as I, II, III, and IV. The ideotype with the highest values for these traits was identified as (I), while the ideotype with the lowest values was identified as (IV). The reference value with the maximum shoot and minimum root was identified as (II), whereas the minimum shoot and maximum root were identified as (III).
PCA provided a visual representation of the dispersion of genotypes concerning these reference ideotypes, based on the maximum and minimum vegetative performance across genotypes. The results confirmed the presence of genetic variability and enabled the classification of genotypes according to their biomass distribution between shoot and root systems.
Genotypes BAG15, BRS2336, GJ8, BRS1216, BRS3220, BRS3210, and BAG38 were positioned closest to ideotype I, representing the maximum values for both shoot and root traits (Figure 1). Among these, BAG15 was closest to the ideal point, reinforcing its superior performance observed through its high DQI and confirmed by the mean grouping analysis (Table 1). This highlights its potential for commercial seedlingproduction,akeytraitsoughtby nurseries specializing in clonal cultivars of C. canephora.
Genotypes BAG34, BAG19, BAG27, BAG35, BAG26, BAG24, BAG22, BAG33, BAG39, and GJ25 were positioned closer to ideotype III, which represents maximum root development and minimal shoot growth (Figure 1). Although distant from ideotype I the reference for optimal vegetative development proximity to ideotype III may offer adaptive advantages under field conditions. A larger root system combined with a reduced aerial part can reduce transpiration, minimizing water loss and increasing the likelihood of seedling survival after transplanting.
However, GJ25 exhibited an opposite pattern, with a smaller root system and a relatively larger shoot. This imbalance may lead to greater susceptibility to water deficit in the field, potentially resulting in lower survival rates and slower early growth.
In contrast, genotypes BAG43, BAG40, BAG28, BAG23, AS2, BAG32, BAG41, BAG29, BAG21, BAG30, and BAG31 were located near ideotype IV, which represents minimal values for both shoot and root traits. These genotypes displayed limited vegetative development, with low biomass accumulation. Consequently, their reduced water and nutrient reserves may make them more vulnerable to environmental stress following transplantation. Such clones are less likely to be selected by nurseries focused on efficient clonal seedling production for commercial cultivation.
Selection gains for traits associated with high DQI and biomass accumulation (SDM, RDM, and TDM) reflect the selection of genotypes with favorable vegetative profiles, according to various selection indices (Table 5). Selection based solely on DQI resulted in a total gain of 136.53%. Although substantial, this gain was slightly lower than those obtained through other selection indices, which yielded gains of similar or greater magnitude.
The Smith and Hazel index, which applies linear combinations of the evaluated traits, produced the highest estimated total gain at 164.99%, followed closely by the Mulamba and Mock index, based on rank-sum criteria, with a gain of 163.61%. The similarity in results between these indices is likely due to the positive associations among traits, which favor simultaneous selection.
Genotypes BAG15, BRS2336, and GJ8 were consistently selected by all indices as having the greatest potential for seedling production. These were followed by BRS3210 and BRS3220, selected by two indices, and BAG30 and BRS1216, selected by only one. In contrast, BAG32 was consistently selected with negative gains across all indices, followed by BAG43, BAG23, AS2, and BAG41, which were selected with reduced gains in two indices, and BAG35, BAG34, BAG21, and BAG27, which were selected with negative gains in only one index.
The genotypes selected by gain-based indices BAG15, BRS2336, GJ8, BRS3210, BRS3220, BAG30, and BRS1216 (Table 6) were generally located near ideotype I, indicating superior shoot and root development, except for BAG30 (Figure 1). BAG30 was positioned closer to ideotype IV but was selected solely by the direct selection index based on the DQI. The Dickson Quality Index accounts for both seedling vigor and the balance of biomass distribution between shoot and root systems (GOMES et al., 2019). Thus, although BAG30 produced smaller seedlings, it demonstrated an adequate balance between root and shoot biomass.
Estimates of genetic progress (%) using selection indices and univariate direct selection for DQI in Coffea canephora genotypes evaluated for vegetative traits of clonal seedlings in the Western Amazon, Brazil.
Genotypes selected with decreased gains those with lower DQI and lower dry mass present greater challenges for seedling production. These genotypes require more careful management in the nursery to achieve acceptable performance and ensure the production of high-quality seedlings.
CONCLUSION
The 28 Coffea canephora genotypes exhibited clear genetic diversity. Genotypic variance for vegetative seedling traits was consistently greater than environmental variance, indicating strong genetic control. All commercial genotypes, except GJ25 and AS2, demonstrated superior vegetative vigor during the seedling production phase. Among them, BAG15 stood out with the highest initial vigor.
Genotypes BAG30, BAG31, BAG21, BAG29, BAG19, BAG26, BAG24, BAG28, BAG39, BAG41, BAG33, BAG38, BAG43, BAG23, BAG34, and BAG32 were considered promising, either due to a high root-to-shoot dry mass ratio (RDM/SDM) and/or proximity to ideotype III, characterized by increased root development. This trait may enhance seedling survival under field conditions following transplantation.
In contrast, genotypes BAG22, BAG27, BAG35, and BAG40 showed lower performance during the seedling phase. If selected for inclusion in new cultivars, these genotypes will require tailored management in the nursery to improve vegetative traits and promote higher survival rates and faster initial growth after field establishment.
ACKNOWLEDGMENTS
This study was supported by the Federal Institute of Education, Science, and Technology of Rondônia and the Office of the Pro-Rectory for Research, Innovation, and Graduate Studies; the Brazilian Coffee Research and Development Consortium (Consórcio Pesquisa Café); the Legal Amazon Biodiversity and Biotechnology Network (Bionorte); and the Brazilian Agricultural Research Corporation (Embrapa) of Rondônia. The authors also thank the National Council for Scientific and Technological Development (CNPq) for “research productivity”, grants to MCE, RBR and ALT and the Rondônia Foundation for Support to Development of Scientific and Technological Actions and Research (FAPERO) for grant to LFBA (Brazil - financial code 001).
Data Availability:
The data that support the findings of this study can be made available, upon reasonable request, from the corresponding author.
REFERENCES
- ALVARES, C. A. et al. Köppen‟s climate classification map for Brazil. Meteorologische Zeitschrift, 22: 711-728, 2013.
- BALBINO, T. J. et al. Alternative substrates for the production of clonal Coffea canephora seedlings. Pesquisa Agropecuária Brasileira, 59: e03538, 2024.
- CALDEIRA, M. V. W.; FENILLI, T. A. B.; HARBS, R. M. P. Composto orgânico na produção de mudas de aroeiravermelha. Scientia Agraria, 9: 27-33, 2008.
- CRUZ, C. D. Genes Software-extended and integrated with the R, Matlab and Selegen. Acta Scientiarum. Agronomy, 38: 547-552, 2016.
- CRUZ, C. D.; REGAZZI, A. J.; CARNEIRO, P. C. S. Modelos biométricos aplicados ao melhoramento genético Viçosa, MG: UFV, 2004. v. 1, 480 p.
- DICKSON, A.; LEAF, A. L.; HOSNER, J. F. Quality appraisal of white spruce and white pine seedling stock in nurseries. The Forestry Chronicle, 36: 10-13, 1960.
- ESPINDULA, M. C. et al. Robustas Amazônicos: os cafeeiros cultivados em Rondônia Brasília, DF: Embrapa, 2022. 144 p.
- ESPINDULA, M. C. et al. Cafeeiros Robustas Amazônicos: Variabilidade genética explorada em Rondônia. In: SENRA, J. F. de B. et al. (Eds.). Tópicos especiais na produção de cafés de qualidade Vitória, ES: Incaper, 2025. s/v, cap. 2, p. 66-99.
- FERREIRA, O. G.; ROSSI, F. D.; ANDRIGHETTO, C. DDA: Determinador digital de Áreas - Software para determinação de área foliar, índice de área foliar e área de olho de lombo - Versão 1. 2. Santo Augusto, RS: Instituto Federal Faroupilha, 2008.
- FERREIRA, R. T. et al. Intrapopulation recurrent selection in sour passion fruit by mixed models. Revista Brasileira de Fruticultura, 38: 158-166, 2016.
- FERRÃO, M. A. G. et al. Characterization and genetic diversity of Coffea canephora accessions in a germplasm bank in Espírito Santo, Brazil. Crop Breeding and Applied Biotechnology, 21: e36132123, 2021.
- GALLEGOS-CEDILLO, V. M. et al. Plant agronomic features can predict quality and field performance: a bibliometric analysis. Agronomy, 11: 2305, 2021.
- GOMES, S. H. M. et al. Avaliação dos parâmetros morfológicos da qualidade de mudas de Paubrasilia echinata (pau-brasil) em viveiro florestal. Scientia Plena, 15: 1-10, 2019.
- KOLLN, A. M. et al. Influence of nitrogen fertilization in mother plants on the growth and quality of clonal seedlings of Coffea canephora „Robusta‟ plants. Ciência Rural, 52: e20201008, 2022.
- MALAU, S.; SIANTURI, P. N.; SIHOTANG, M. R. Phenotypic and genetic performance of Arabica coffee seedling due to effect of genotype and urea. IOP Conference Series: Earth and Environmental Science, 1183: e012009, 2023.
- MORAES, M. S. et al. Environmental stratification and performance of Coffea canephora clones grown in the Western Amazon. Coffee Science, 16: e161911, 2021.
- MULAMBA, N. N.; MOCK, J. J. Improvement of yield potential of the ETO Blanco maize (Zea mays L.) population by breeding for plant traits. Egyptian Journal of Genetics and Cytology, 7: 40-51, 1978.
- NASCIMENTO, B. et al. Vegetative rescue and propagation of native ilex paraguariensis populations in Santa Catarina state, brazil. Revista Árvore, 47: e4710, 2023.
- NASCIMENTO, W. M. O. et al. Pré-melhoramento do camucamuzeiro: estudo de parâmetros genéticos e dissimilaridade. Revista Ceres, 61: 538-543, 2014.
- PENCE, M. G. et al. Applying knowledge and experience from potato (Solanum tuberosum) to update genetic stability data requirements in the risk assessment for vegetatively propagated biotech crops. Frontiers in Bioengineering and Biotechnology, 12: 1376634, 2024.
- RESENDE, M. D. V. Software Selegen-REML/BLUP: a useful tool for plant breeding. Crop Breeding and Applied Biotechnology, 16: 330-339, 2016.
- ROCHA, R. B. et al. Avaliação do método centróide para estudo de adaptabilidade ao ambiente de clones de Eucalyptus grandis. Ciência Florestal, 15: 255-266, 2005.
- SALES, R. A. et al. Influência de diferentes fontes de matéria orgânica na propagação da Schinus terebinthifolius raddi Scientia Agraria, 18: 99-106, 2017.
- SCHMIDT, R. et al. Genetic Diversity Based on Nutrient Concentrations in Different Organs of Robusta Coffee. Agronomy, 12: 2-18, 2022.
- SCHMIDT, R. et al. Accumulation of Nutrients and the Relation between Fruit, Grain, and Husk of Coffee Robusta Cultivated in Brazilian Amazon. Plants, 12: 2-13, 2023.
- SMITH, H. F. A discriminant function for plant selection. Annals of Eugenics, 7: 240-250, 1936.
- SOUSA, A. L. B. et al. Maturation cycle and fruit-to-bean conversion ratios in Amazon robusta coffee cultivars. Revista Caatinga, 38: e12571, 2024.
- VERDIN FILHO, A. C. et al. Implications of the cut type and apex length of stem cuttings used for the production of plantlets of Conilon coffee. Coffee Science, 15: e151770, 2020.
- VERDIN FILHO, A. C. et al. Limitações causadas pelas dimensões de tubetes sobre o crescimento e qualidade de mudas clonais de cafeeiro conilon. Pensar Acadêmico, 19: 281-296, 2021.
- ZHANG, Y. et al. Crop root system architecture in drought response. Journal of Genetics and Genomics, 52: 4-13, 2025.
Edited by
-
Editor in Chief:
Aurélio Paes Barros Júnior
-
Section Editor:
Salvador Barros Torres

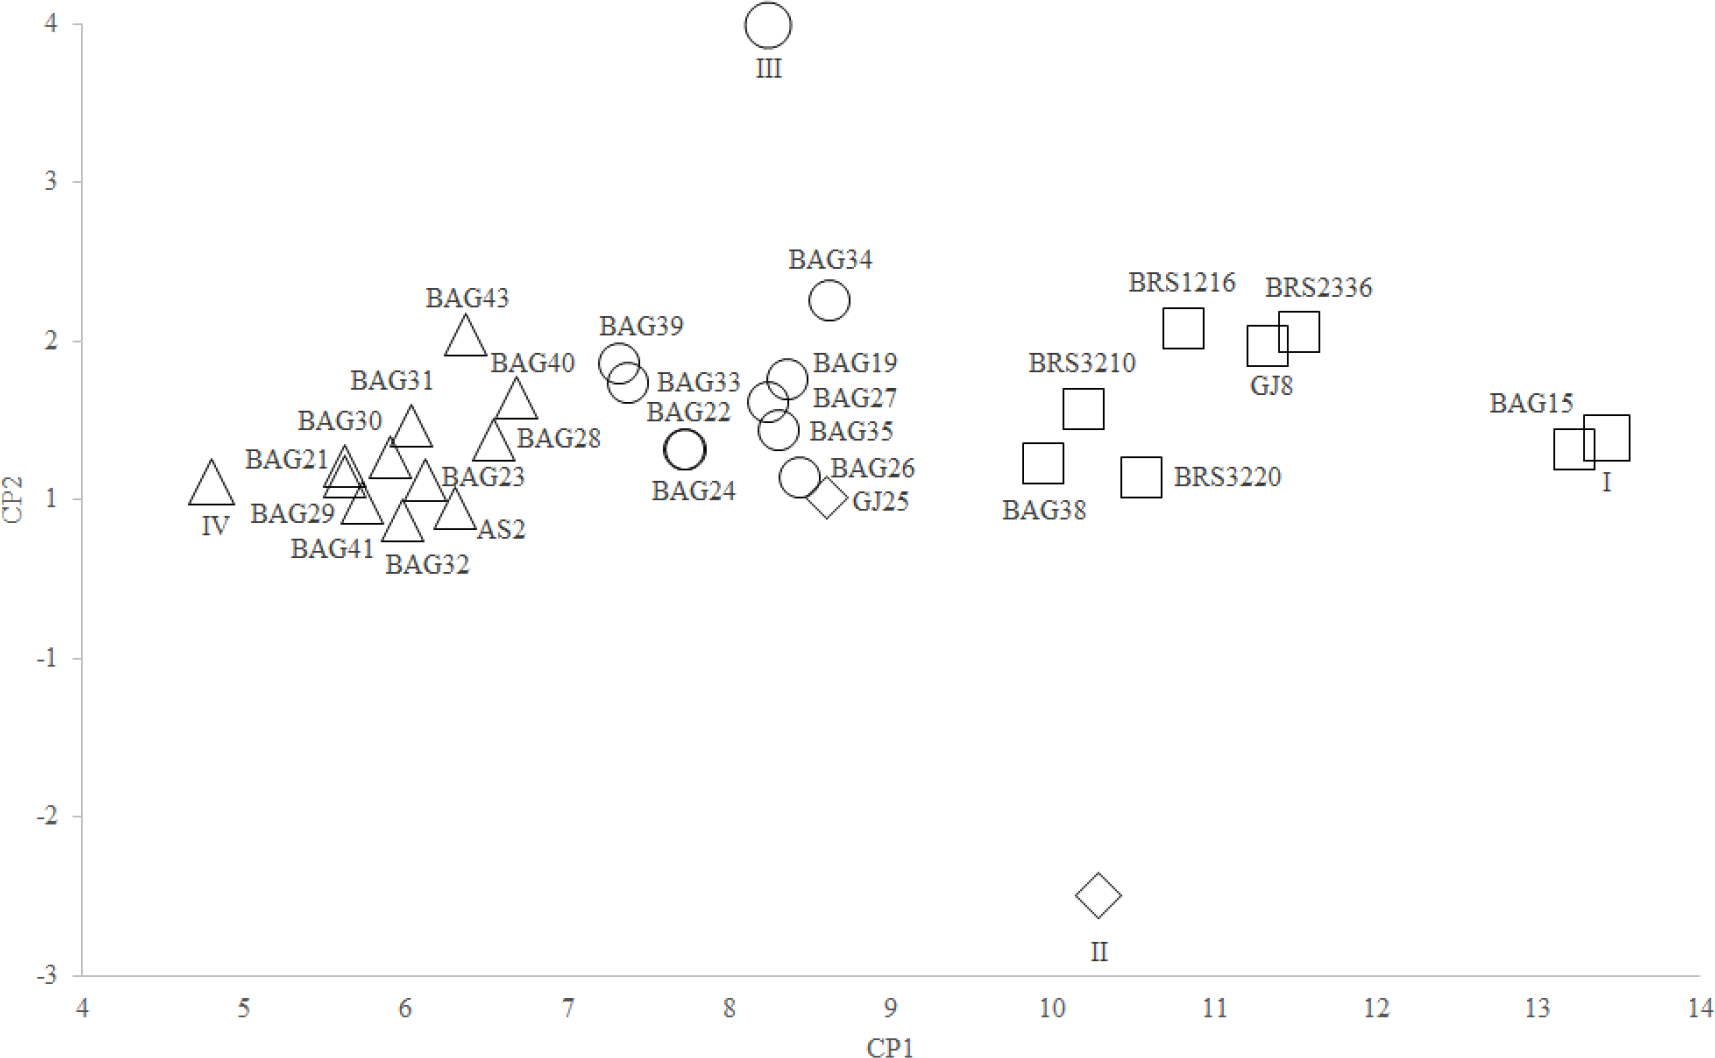 Points I, II, III, and IV represent ideal reference values, where point I corresponds to the maximum estimated values for both shoot and root traits, and point IV to the minimum values. Point II represents a genotype with a maximum shoot and minimum root system, while point III represents the inverse minimum shoot and maximum root development.