 Stochastic short-term mine scheduling targeting stationary grades
Abstract
One of the key objectives in short-term mine planning is to establish a sequence of contiguous blocks organized into diglines, each characterized by consistent low-grade variability and minimal fluctuations, ensuring a stable output. This practice guarantees a steady and reliable supply of ore to the processing plant across various operational phases, each phase outlined for clarity. The creation of this digline requires the generation of multiple random models and involves choosing a model whose grade histogram aligns closely with the predefined criteria. In stochastic mine planning, geological uncertainty and transfer functions are employed to propagate the risk into the mining schedule focusing on grade control. This is accomplished by opting for blocks that present the lowest risk associated with grade uncertainty, a process enhanced by prioritizing blocks situated in geopositions with a proven high probability of occurrence. This study unveils detailed simulation models, clearly outlined digline selection methodologies, and a thorough optimization process, each aspect exemplified within the practical context of a phosphate mine. Our findings confirm the viability of this approach in real industry practice.
Keywords:
short-term; optimization; stochastic; simulation; digline; grade control.
1. Introduction
The Short-term open pit mine planning method proposed by Toledo et al. (2021) has been applied to design diglines and achieve stable grades, reducing the variance between the diglines in deposit with high grade variability. This method has been modified to incorporate point data expressed as block support as a reference model, allowing for comparison with all equiprobable simulated models using the same reference model. The novel contributions of this article include:(i) assessing geological grade uncertainty through the geostatistical simulation, (ii) using a transfer function to generate sequential diglines, in all equiprobable models, and (iii) managing the equiprobable diglines to select blocks with lower geological grade uncertainty, based on the maximization of the occurrence probability.
Phosphorus is an essential commodity for all life on Earth, and no other element or substance can act as a substitute. It is considered non-renewable (Geissler, et al., 2015). Deposits of an industrial scale can be of either sedimentary or igneous origin. Approximately 85% of the phosphate rock ore used today is mined from sedimentary deposits. The main differences between these two types of deposits lie in their geometry, mineralogy, and ore grade variability (Steiner, et al., 2015). The methodology described herein is applied to phosphate deposits of igneous origin with high variability, similar to that of an open pit metallic deposit. However, in other cases, such as sedimentary phosphate deposits, the methodology may not be applicable.
Short-term mine planning scheduling in an open-pit involves several crucial steps. One of these steps is providing sequential diglines to be designed on the exposed ore. When the ore grade is highly variable, maintaining a constant feed and low fluctuation between diglines becomes challenging, and it replicates the statistical properties of large period models to short period models.
In the 1970s, it was observed that local and global estimation techniques, such as kriging (Matheron, 1963), which provide associated uncertainty measures through kriging variance, do not adequately account for the uncertainty of the content in geological blocks. Instead, they primarily consider the layout of the sampling grid and the variographic model. Moreover, these techniques tend to smooth extreme values, resulting in an underestimation of low values and an overestimation of high values. Consequently, they fall short in quantifying and modelling the geological uncertainty associated with blocks much smaller than the drilling grid used to define the reserve. Recognizing the significance and necessity of quantifying geological risk in the mining industry, pioneering work by David (1973), Journel (1974), and Matheron (1976) introduced stochastic simulation. They highlighted its substantial impact on the sensitivity and viability of mining projects.
As a result, the incorporation of geological uncertainty into plans, schedules, mining sequences, and blending strategies directly influences the profitability of any mining venture (Godoy, 2003). This analysis parameter further accentuates the variability and uncertainty of attributes such as grade, ore type, metallurgical recovery, and concentration through the use of a transfer function.
Over the past few decades, the field of geosciences has witnessed the development of various conditional simulation methods for continuous and categorical variables. These innovations include contributions from Deutsch (1992), Dowd (1994), Caers and Journel (1998), Guardiano and Shivastava (1993), and Strebelle (2002). Additionally, there has been a proliferation of multiple realization generation methods tailored for practical applications in the mining industry, exemplified by the approach of direct block simulation (Godoy, 2003).
In stochastic planning, the use of simulated models describing geological uncertainty is imperative. Additionally, it is crucial to consider various other variables, including fleet numbers, allocation, and distances between loading and unloading points. Several studies in this context have contributed to understanding this issue. For instance, Shishvan and Benndorf (2016) and Rahmanpour and Osanloo (2016) quantified the impact of uncertainty on Key Performance Indicators (KPIs). Meanwhile, Toledo (2018, 2023) and Capponi (2019) employed transfer functions to select sequence blocks with low variability in grade among periods. Quigley and Dimitrakopoulos (2020) and Both and Dimitrakopoulos (2020) presented methods for the simultaneous analysis of equipment and mining sequence. Therefore, this uncertainty must be seamlessly integrated into mining programming schedules and equipment allocation, aligning with the most likely scenarios.
This study, employed simulations to address the challenge of finding the quasi-optimal digline for a given short-term mine plan. The problem can be stated as selecting diglines to ensure a constant mean grade, low variability, and low risk in the beneficiation plant grades. The solution should incorporate all operational constraints, including selecting only exposed (free to be mined) ore, defining the number of simultaneously operated mine faces, determining the required tons for the period, specifying the quality of ore target expressed as grade histograms, and establishing the acceptable range of head grades.
It propose an algorithm that searches for a sequence of diglines to be used over a period to fulfill the required characteristics of the target ore. The algorithm takes into account the uncertainty associated with grades, considering both the points of origin previously defined by the planner and the aleatory path over the restricted productive area.. Additionally, it is considered that the economic maximization process was carried out in previous stages, such as long and medium-term planning, where the phases and extraction sequences were defined. Therefore, the short-term planning aims to fulfil the quantity and quality requirements of the material in the enabled areas.
2. Material and methods
2.1 Geoestatistical simulation
Geological uncertainty assessed can be effectivelyachieved though the use of turning bands simulation, a mehod initially conceptualized by Matheron (1973) and further developed by Journel (1974). This method involves performing unconditional simulations by generating numerous independent simulations using concentric lines that sweep across a 2D plane or 3D space. The process can be understood as a simplification where multiple independent 1D simulations are carried out through lines that can be rotated in the space of ℝ2 or ℝ3. This unique approach results in the creation of three-dimensional unconditional realizations (Rossi and Deutsch 2013).
2.2 Change of support
Selective mining units (SMUs) represent the block dimensions used in mine planning (Journel and Huijbregts 1978). The size of these SMUs is inherently connected to the scale of the mining equipment. Geostatistical simulation is typically carried out with point support. However, to effectively apply these simulations to mine planning, a change of support is required. In this context, each run equates a block’s value with the average of simulated values at the points that discretize the corresponding block.
To determine the optimal set of diglines in each model, the grade distribution of randomly generated diglines is compared with the probability distribution of the samples at the appropriate support within the area of influence, referred to as the reference model. To facilitate this comparison, the point support data histogram is changed to block support (SMUs). Subsequently, following the application of the comparison algorithm, the digline with a grade distribution that closely aligns with the reference model is selected.
The change of support for the reference model is performed utilizing the gammabar and affine correction from the Gslib library (Deutch and Journel 1992). Gammabar furnishes the variance adjustment factor, while affine correction pertains to the histogram at the new support level. This support correction process is iterated for each geostatistical domain, resulting in the generation of a new grade distribution as the reference model.
2.3 Computational deterministic optimization
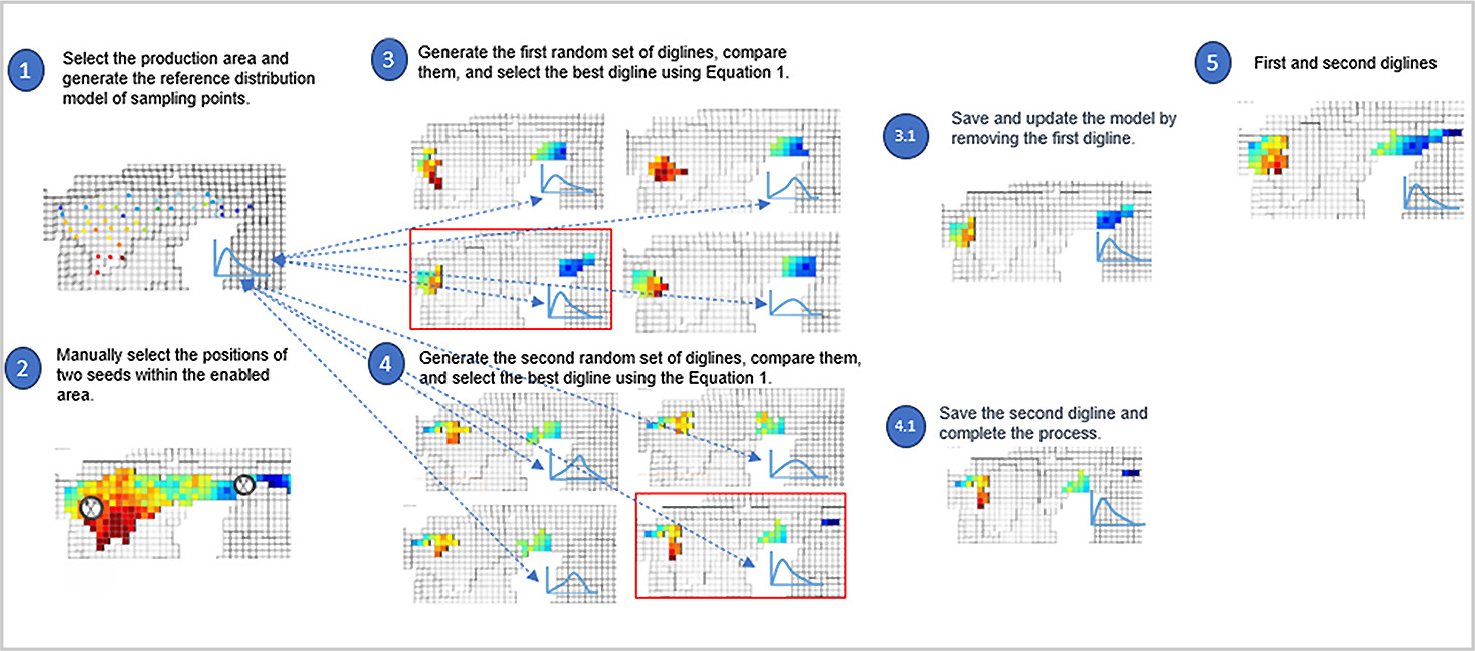
In the proposed optimization analysis, the mine planner initiates by defining the starting point, or potentially multiple starting points, constrained to areas equipped with all necessary services to commence mining operations. The selection of starting points is a crucial task in this process and is associated with the following factors: (i) the number of loading equipment available for mining; (ii) mining availability for its operation; (iii) the minimum number of mining advances required to achieve planned blending. The algorithm initiates a randomized path while considering the operational mining constraints, such as bench limits, selection of adjacent ore blocks, determining the number and location of starting points, production objectives, and timeframes. Subsequently, the first feasible digline is generated. A set of scenarios, each sharing the same starting point and number of blocks, is systematically generated. These scenarios follow distinct random paths, yielding multiple potential diglines. The digline displaying block grades most closely aligned with the reference distribution is chosen among the generated scenarios, while the remaining scenarios are discarded. The selection of the best scenario is accomplished through a quantile-quantile comparison between the grade distribution of the blocks (reference model) and the grade distribution of the blocks generated in each scenario (iteration). Consequently, a set of blocks in the first digline is derived using Equation 1 (Toledo et al.,2021) for a single equiprobable model. This iterative process is reiterated for all equiprobable models.
Figure 1 illustrates the workflow of each equiprobable simulated model.

Scheme of the workflow adopted in the deterministic short-term model for obtaining two diglines.
Where: α : number of iterations; β : number of classes of histogram; i : reference histogram for ore grades of sampling points at the corrected support; y : digline grades histogram from the subset extracted from ore block model
Each equiprobable simulation run includes α = 50 iterations, enabling the exploration of nearly all possible outcomes. The difference between subsequent suboptimal results does not significantly increase at this number of iterations, a phenomenon known as the suboptimality gap. Therefore, additional iterations are unnecessary, as they only marginally improve the results while substantially increasing computational time.
2.4 Computational stochastic performance
To incorporate geological uncertainty (Journel and Kyriakidis, 2004) into the process of defining the stochastic model,{z(l) (uj), uj ∈ A}, j = {1,…,J}, l = {1,..,L}, representing J locations discretizing the deposit A, with L simulated equiprobable scenarios, each simulation (l). The process involves selecting sub-areas V considered as planned production areas, must undergo processing through a transfer function. This function is responsible for the cut-off zc where {zc(l) (uj ) ∈ V}, if z(l) (uj ) ≥ zc is considered ore, and a group of ore blocks D(l) (D ⊂ V ⊂ A) is procured with the aim of achieving grade stationarity.
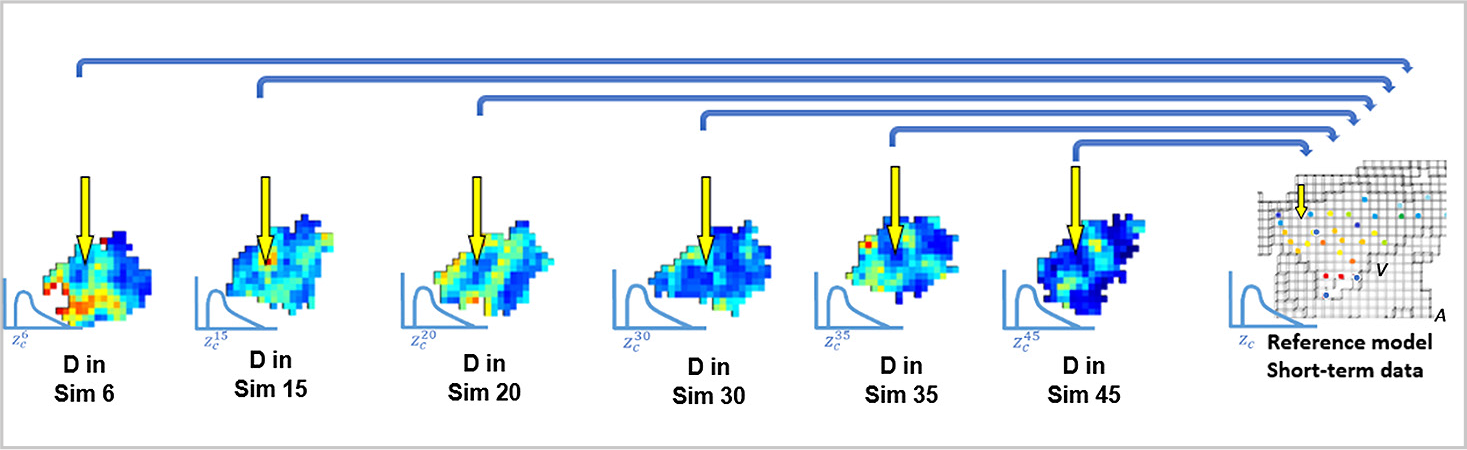
Figure 2 illustrates the process of selecting each digline in all L simulated models. To clarify, each digline depicted in Figure 2 underwent optimization using Equation 1. Consequently, it should be noted that each digline has an equal probability of occurrence.
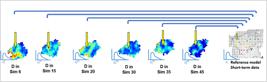
The process of choosing the digline most similar to the reference one on each realization starting from the same seed point.
Stochastic mine planning can be approached by utilizing all realizations (l) of the stochastic model to derive a single quasi-optimal model. A function is applied to each block within each equiprobabel digline, as defined in each simulation. It calculates how many times a block at a location (uj) is included in the diglines across all (l) simulations. Consequently, a block that appears in all (l) simulations will have a 100% incidence, making it the top priority for selection in the set of blocks to be mined. Subsequently, a list of probabilities is generated for each block location (uj) to fulfill the required number of blocks for each digline (k) to achieve a one-week production target. Finally, the selected blocks have the highest probability of occurrence, considering the uncertainty of the grades.
Let {Dk(l) (uj)} represent the diglines for k = {1,2,3…,K} period of mining in the l-th realization, formed by (uj) blocks, tranform to indicator values, 1 if ∈ D(l) and 0 if not, expressed in Equation 2:
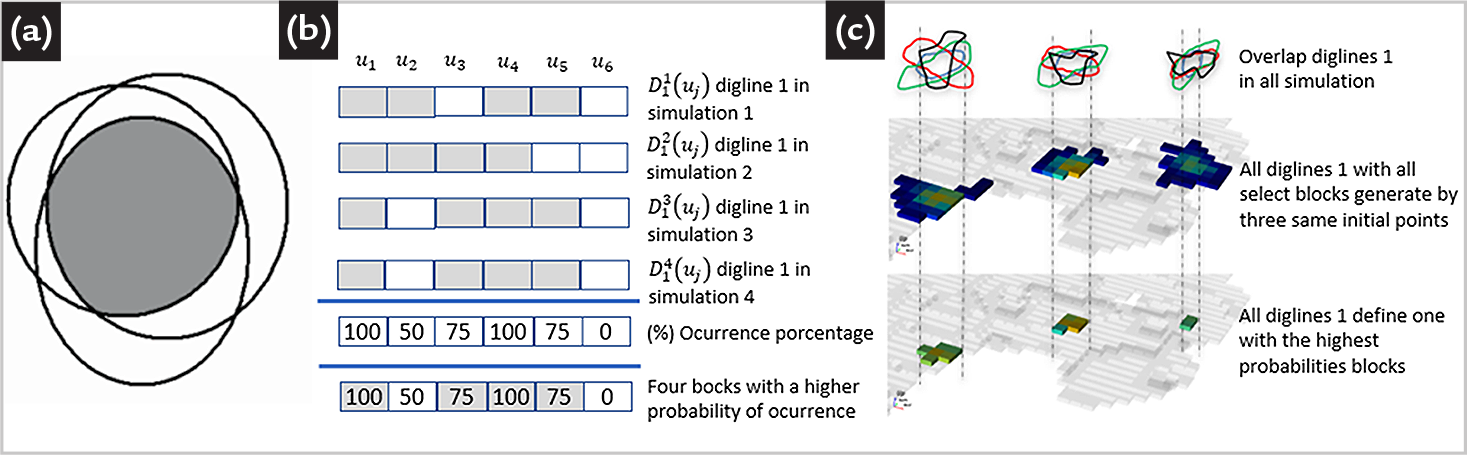
Note that there are K diglines in the L simulations, each consisting of uj blocks. This study presents L×K equiprobable diglines with different mining and sequencing strategies. These multiple models are employed for decision-making, helping to identify the blocks with the highest probability of occurrence per the stochastic models. Figure 3(a) illustrates the uncertainty in defining the diglines, considering the grade uncertainty represented by the region outside the intersection (hatched zone). The intersection region of the sets represents the area where there is a 100% probability of blocks being mined by the multiple simulated diglines. Blocks outside the hatched zone have their probability of selection and assessment, allowing the identification of those with lower geological risk. Figure 3(b) outlines the algorithm for creating a digline that minimizes the geological risk for four equiprobable diglines in four simulations. It demonstrates how four blocks are chosen with the highest likelihood of occurrence. And Figure 3(c) displays the overlaps of three equiprobable diglines, which are then used to generate the probability maps and identify blocks with higher probabilities.
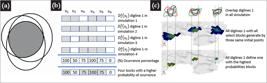
Scheme of digline selection in the stochastic model. (a) The hatched zone represents the blocks selected simultaneously in all simulations (adapted from Writtle and Bozorgebrahimi, 2004). (b) Illustration of four simulations with four blocks selected, considering geological uncertainty. (c) Selection of blocks with the maximum probability among all diglines. The algorithm determines blocks with the highest probability of occurrence.
All realizations are combined to define the (k) diglines in the (l) simulations. The frequency of inclusion for each block in each digline across all (l) equiprobable simulations is counted. The w blocks with maximum probability of occurrence are selected, where w is the number of blocks needed to meet the production requirements for each period, as expressed in Equation 3.
3. Methodology applied to a case study
Sequencing short-term digline models, with grade histograms resembling a reference model and considering the risk of geological uncertainty, requires the following information: i) a stochastic model of the deposit for the most relevant variable in its geological domains; ii) a reference histogram corresponding to the planned mining area; iii) the number and location of available excavators in the enabled areas; iv) the quantity and quality of ore required by the processing plant; and v) transfer functions that optimize the process.
This section presents a case study utilizing a block sequencing optimization algorithm to search for four diglines for a month’s production in an operating phosphate mine. The concept is applied to each of the equiprobable simulated scenario, maintaining consistent seed points, the same number of blocks per week, and the same number of iterations. Subsequently, a stochastic optimization algorithm is employed to optimize the diglines while considering the geological uncertainty of the stochastic model, utilizing all the diglines generated in the simulated models. Finally, a model is constructed with values representing the probability of a block being included in a digline. Blocks with the highest probability of occurrence are selected until they fulfill the required tonnage.
P2O5 was identified as the most significant chemical variable in the deposit, with a cut-off set at 3%.
For the study, a one month horizon is considered, divided into four weeks, with a production target of 50 blocks per week. Additionally, seven seed points representing possible excavator locations are included. The stochastic models of the diglines were derived by comparing the probability distribution. In this case, 1,302 sample points were isolated in semi-annual production areas, as defined by the medium-term planning. The change of support, from points to blocks measuring 25 m x 25 m x 10 m, was performed using these data points. This probability distribution serves as the reference model.
3.1 Geoestatistical simulation
Geostatistical simulations were carried out for the P2O5 within the deposit. For this, two geological domains were used. The variograms for each domain are depicted in Table 1.
Where: Or1, Or2, and Or3 are long, intermediate, and short continuity directions.
C1 is a contribution to the sill; C0 is the nugget effect; R1, R2, and R3 are the ranges of long, intermediate, and short axes expressed in meters.
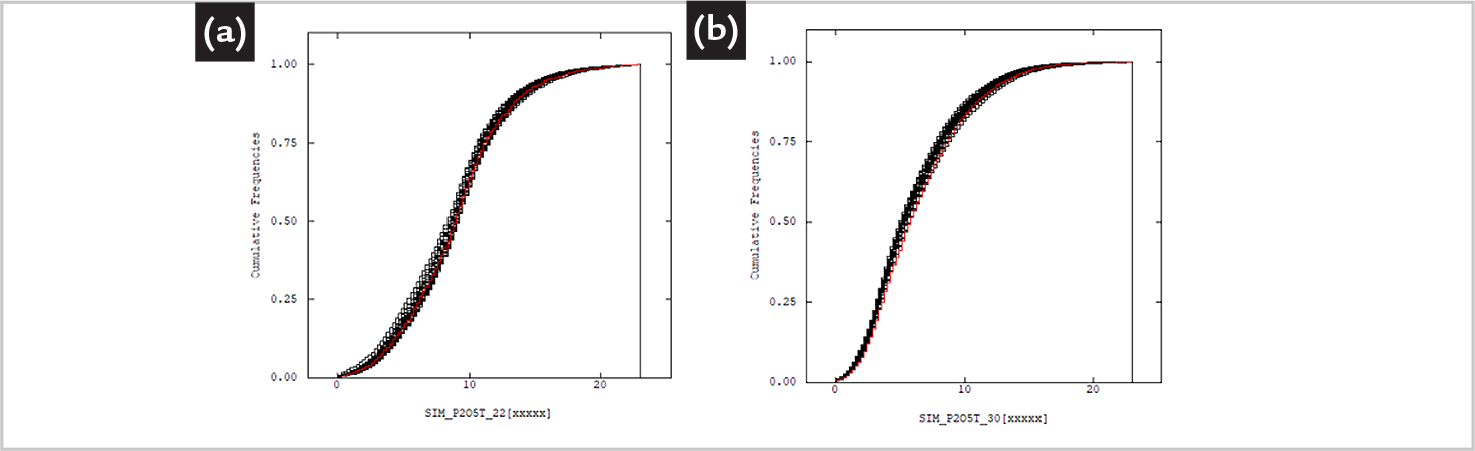
Figure 4 presents he accumulative histograms of the simulated values and the original data declustered for the geological domains 22 (a) and (b) 30, respectively. It is important to note that the cumulative histogram of the original data is depicted by red lines in the middle of the simulation cumulative histograms represented by black lines.
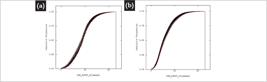
Accumulated histograms from simulated models and original P2O5 data, simulated data in black lines, and original data in red (a) domain 22 and (b) domain 30.
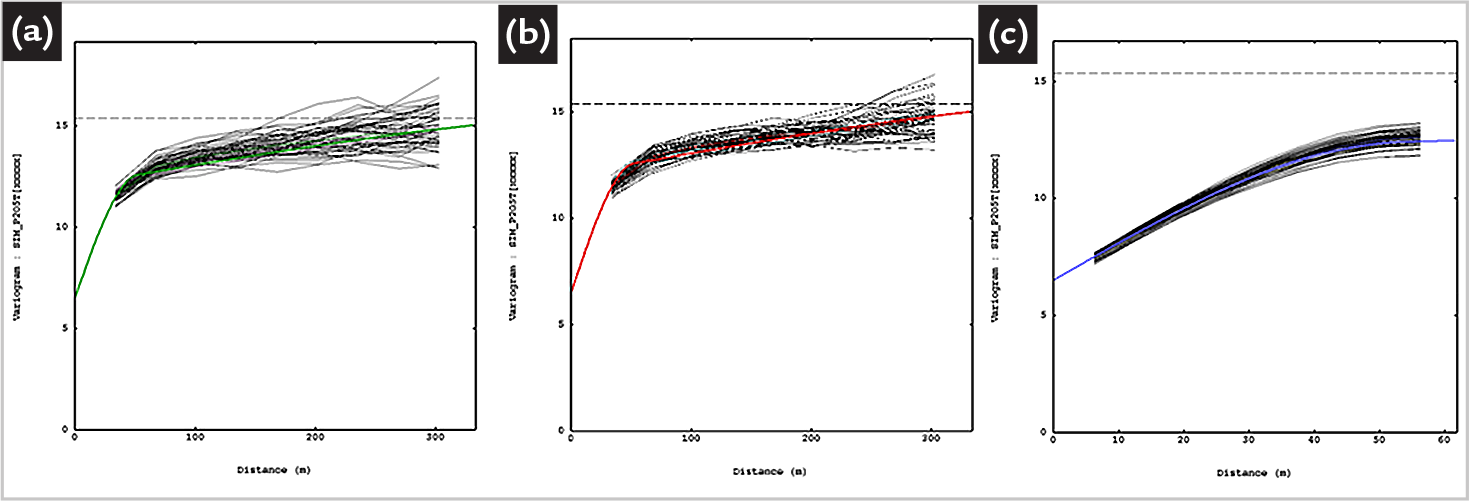
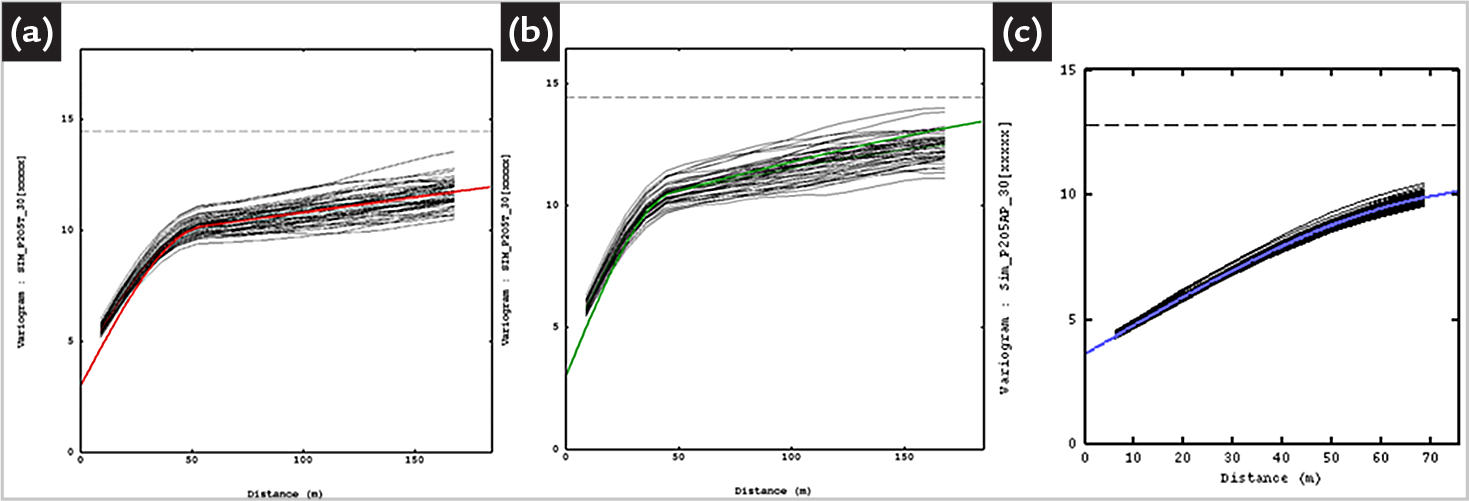
To validate the variograms of the simulated models within geological domains for each variable, the variograms of the corresponding original data were plotted. As such, the simulated variograms representing by black lines were graphically compared to those original data illustrated by green, red, and purple lines.
Figures 5 and 6 demonstrate the validation of the spatial continuity of the simulated models by juxtaposing the simulation variograms (black lines) with those variograms of the original data in (a) long range in the green line, (b) medium continuity in red line and (c) shorter continuity in purple line for the 22 and 30 domains.
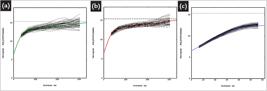
Depicts the variography of simulated models and original P2O5 data for domain 22, showing (a) longer range, (b) medium range, and (c) shorter range variations.
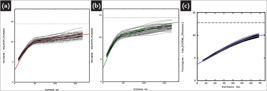
Depicts the variography of simulated models and original P2O5 data for domain 30, showcasing (a) longer range, (b) medium range, and (c) shorter range variations.
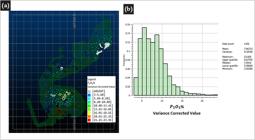
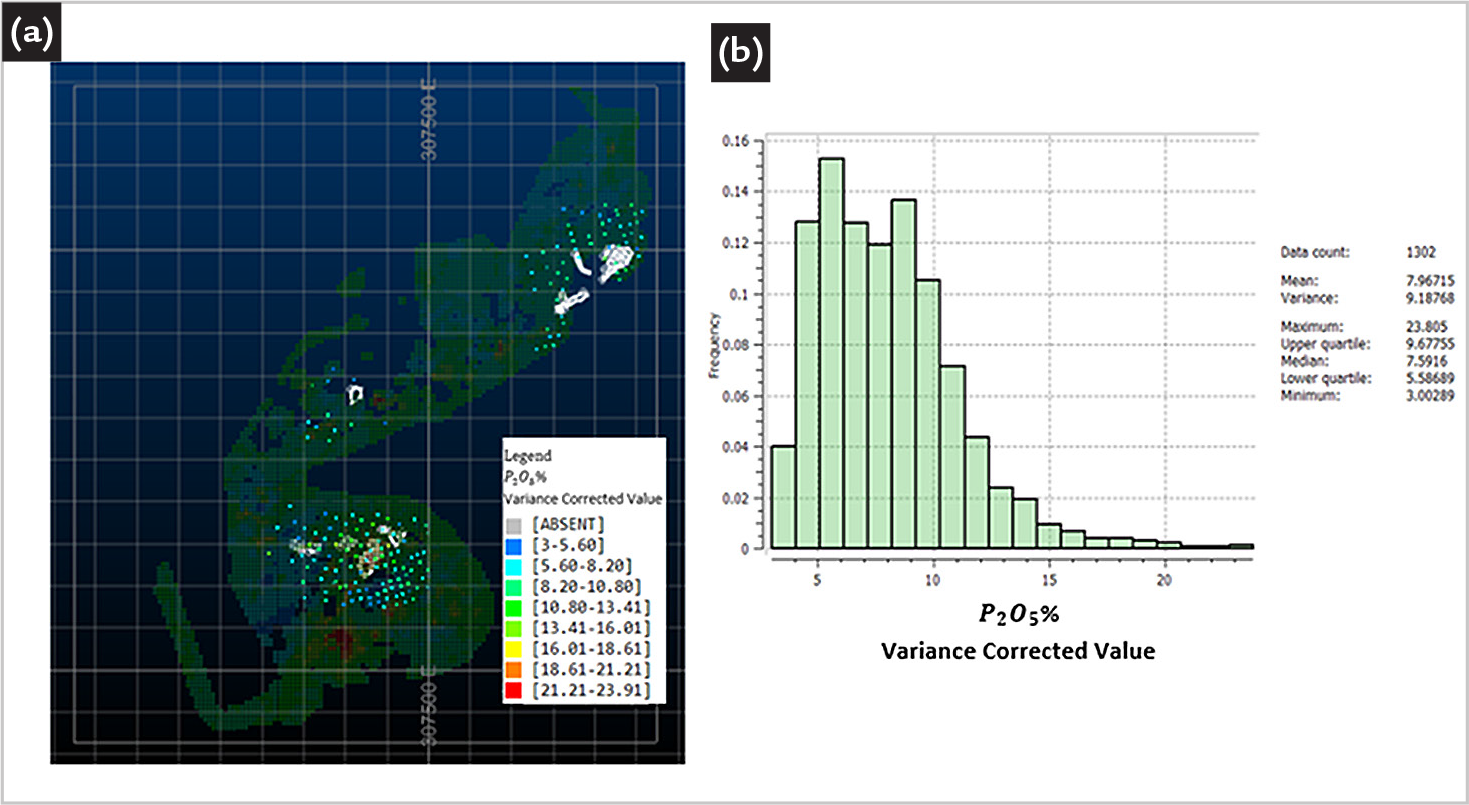
(a) Cloud of sampled points. (b) Histogram of corrected points on the mining support (reference distribution).
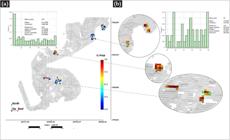
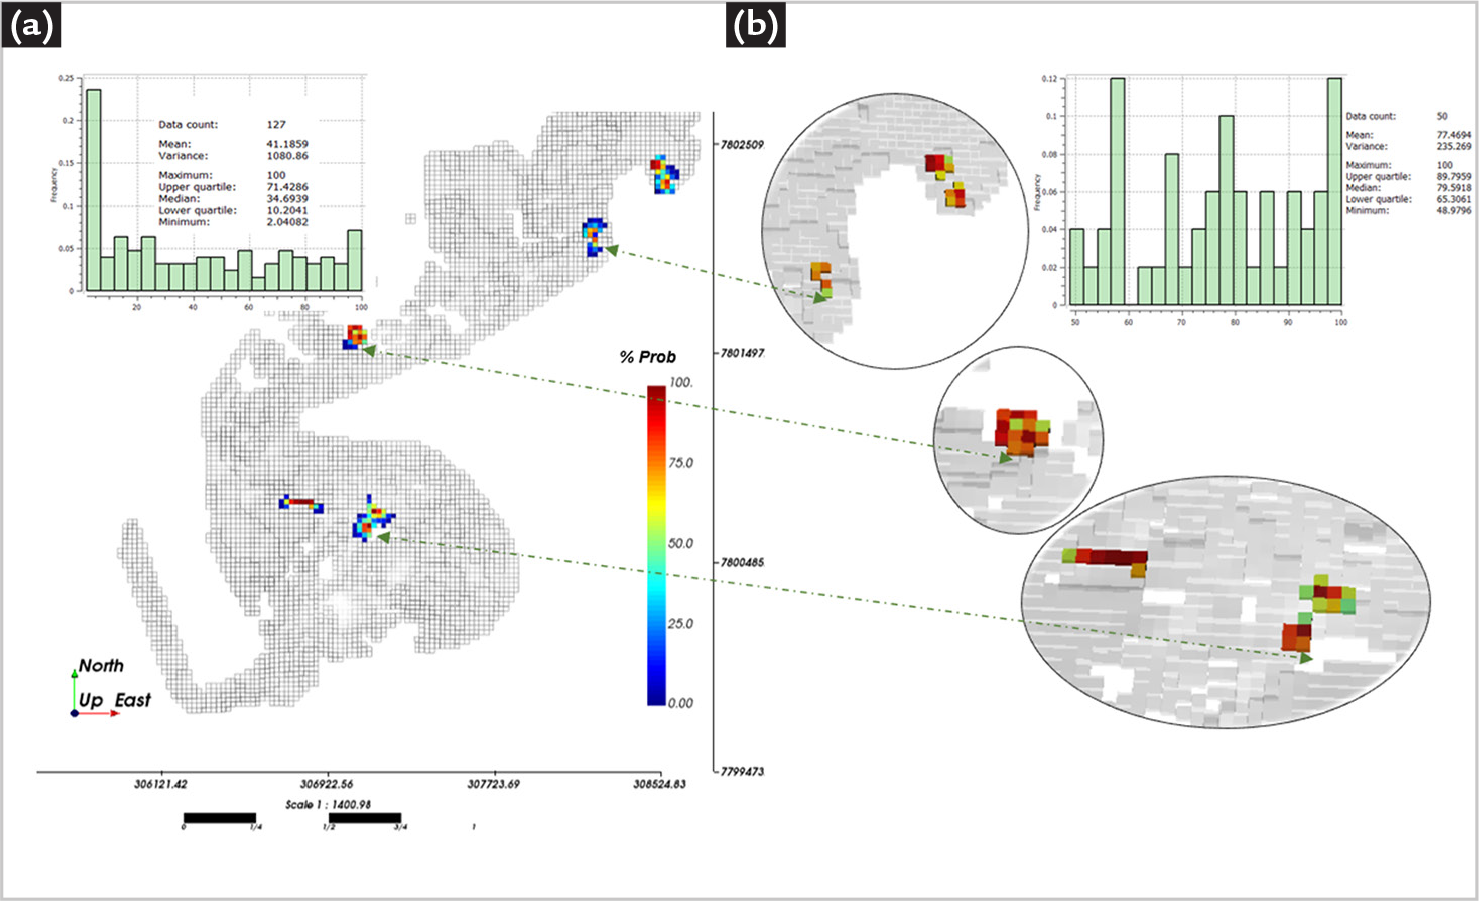
First Period: (a) Probability map for the selection of each block among all 49 initial diglines, involving a total of 127 blocks. (b) Map displaying the 50 blocks with the highest probability of selection.
3.2 Stochastic short-term mine planning
For a one-month time horizon, which is divided into four weeks, with a weekly production target of 50 blocks, seven excavators, and the selection of the locations for these seed points is established to begin the stochastic mining plan.
The stochastic models for each period were generated by identifying subsets of adjacent blocks with a grade frequency distribution most similar to the histogram of the 1,302 data sample points, corrected for support, within the area of interest. The correction was made from point support to block support with dimensions of 25m x 25m x 10m., referred to as the reference model. Figure 4 shows the position of the point cloud and its histogram on the production area programmed by the short-term plan. In practice, it represents bimonthly to semi-annual ore production.
The point cloud in Figure 4 is restricted to a production area near the real diglines mined in white lines. The mean and variance of P2O5 are 7.97 and 9.19 for the probability distribution function was used as a reference model.
Table 2 illustrates the position, identification codes, and grade at the seed points. The selection of each seed point is essential for the development of the sequencing. The diglines will be developed independently for each simulation; these points being the only coincident locations throughout the entire stochastic planning.
The input parameters for sequencing the blocks of stochastic models are shown in Table 3.
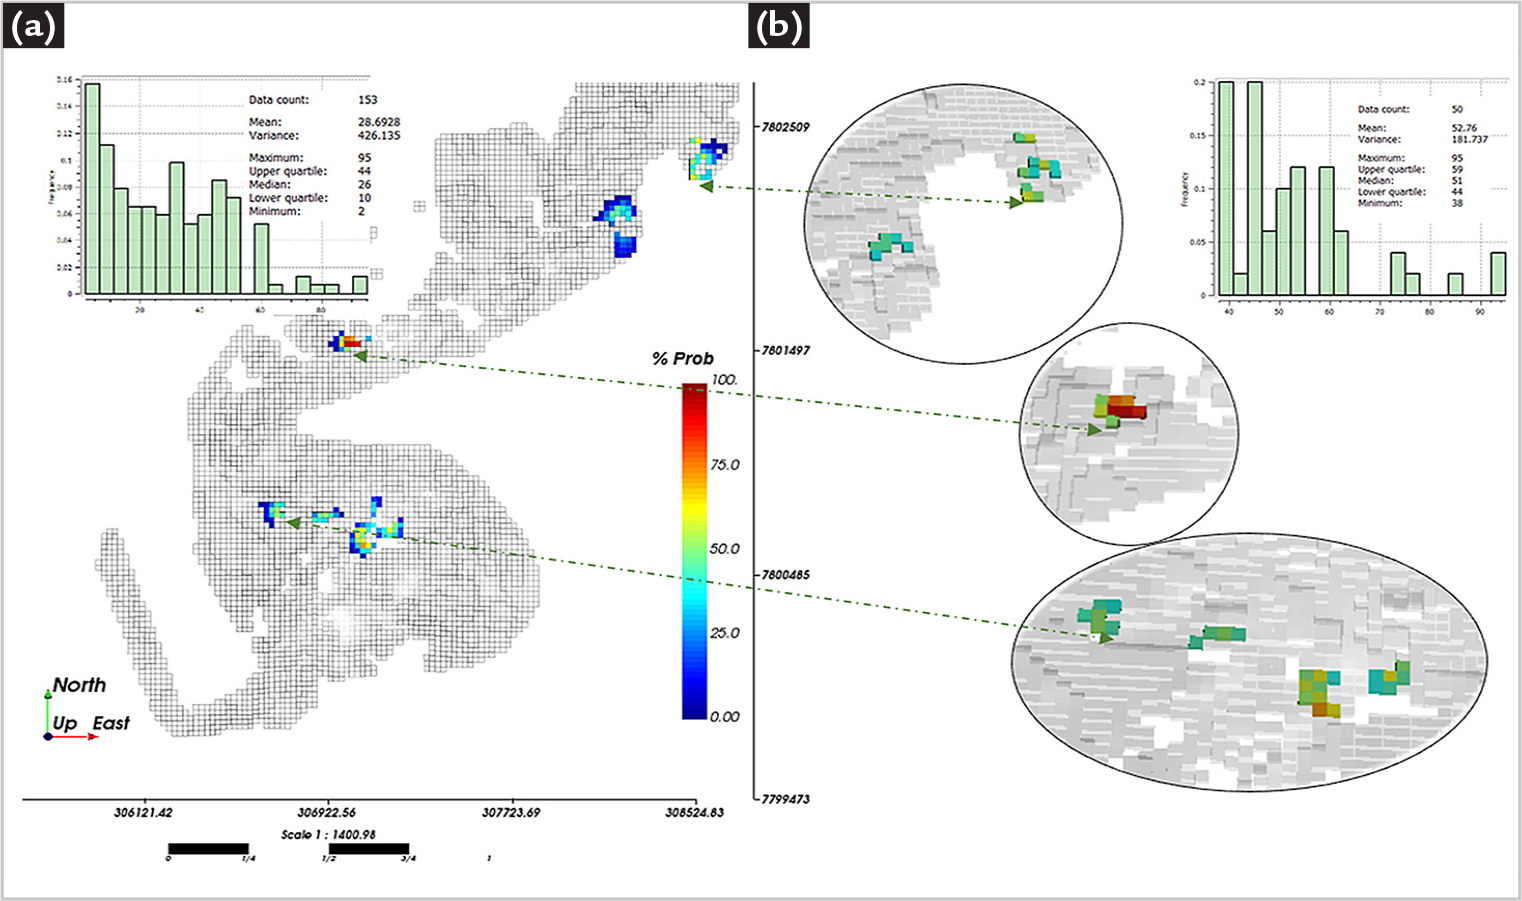
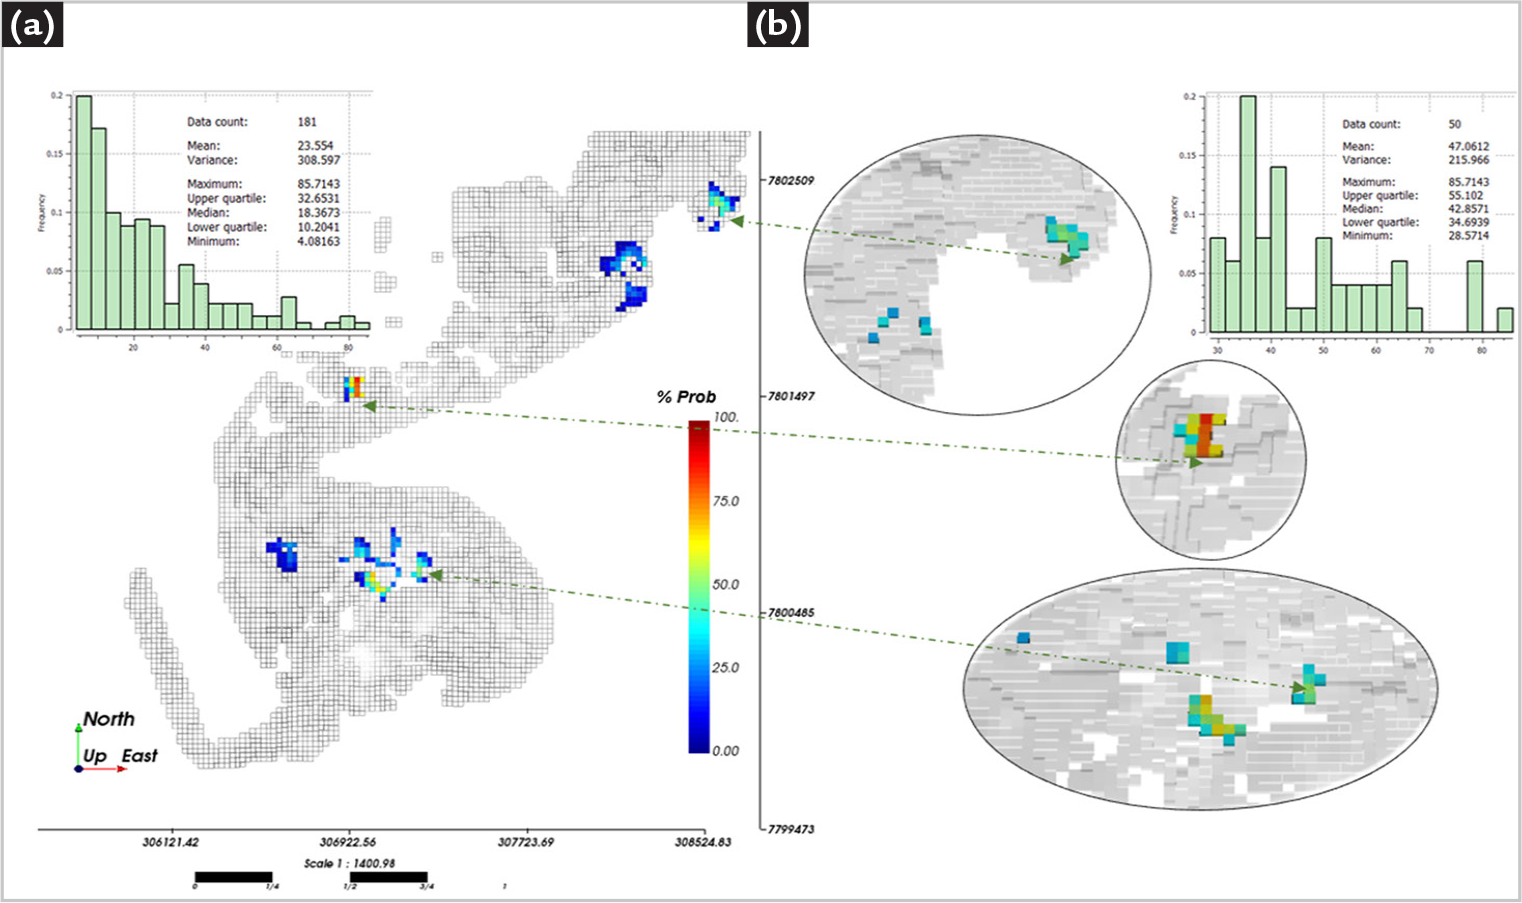
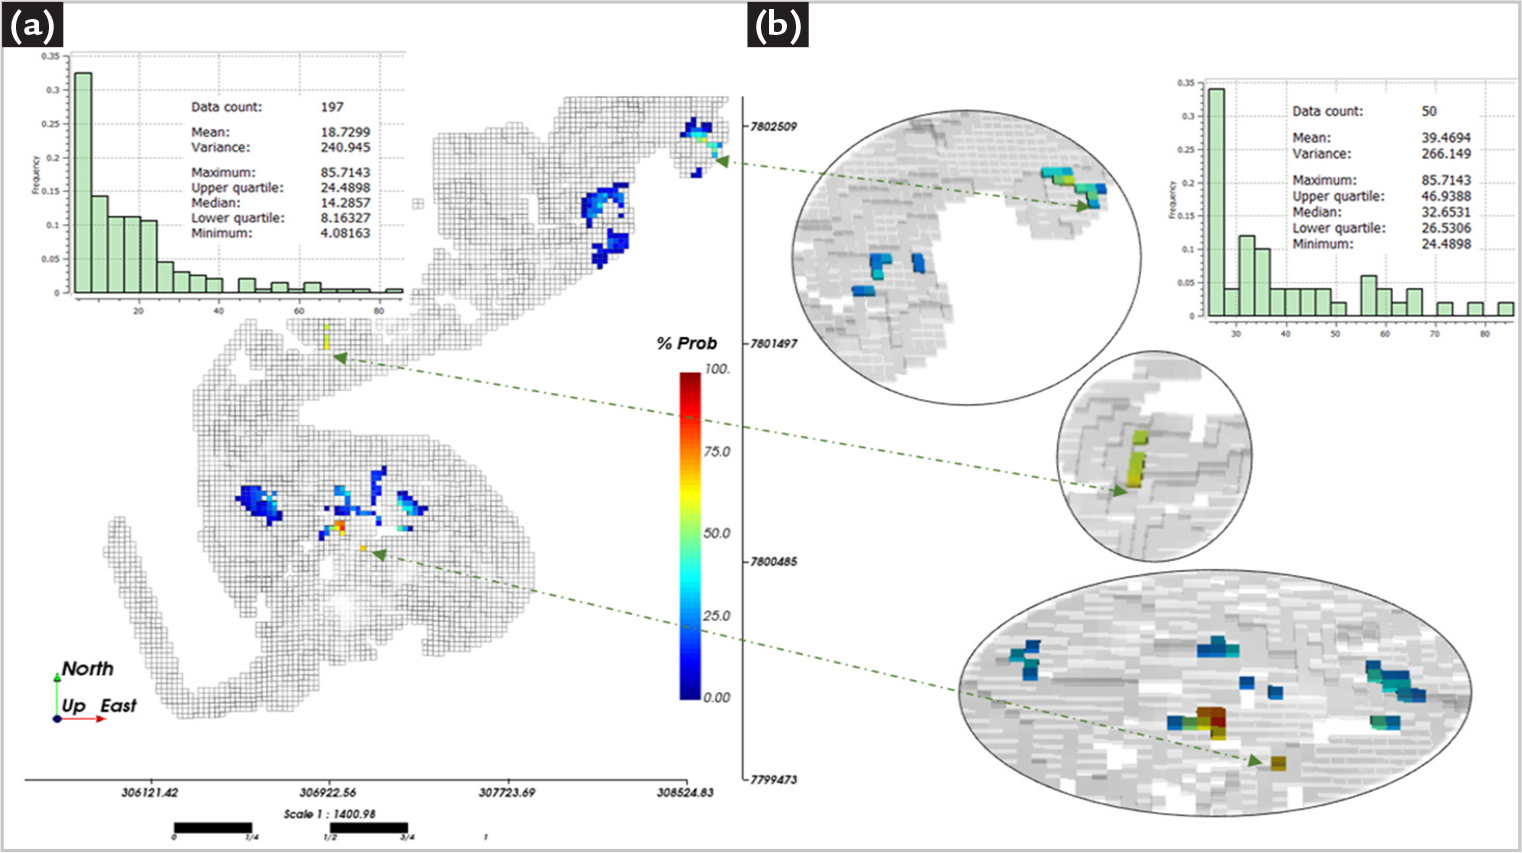
Figures 8, 9, 10, and 11 (a) illustrate the probability of blocks proven by all diglines defined in the 49 equiprobable mine plans for the first, second, third, and fourth periods, with a cut-off Zc ≥ 3% and other parameters as outlined in Tables 2-3 and Section 2. Figures 8, 9, 10, and 11 (b) show the 50 blocks with the highest probability of occurrence in each period, corresponding to each week.
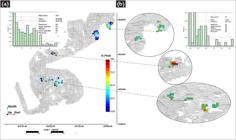
Second Period: (a) Probability map for the selection of each block among all 49 second diglines, comprising a total of 153 blocks. (b) Map displaying the 50 blocks with the highest probability of selection.
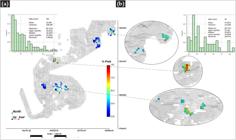
Third Period: (a) Probability map for the selection of each block among all 49 third diglines, consisting of a total of 181 blocks. (b) Map displaying the 50 blocks with the highest probability of selection.
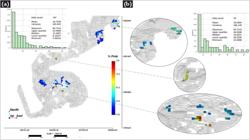
Fourth Period: (a) Probability map for the selection of each block among all 49 fourth diglines, comprising a total of 197 blocks. (b) Map displaying the 50 blocks with the highest probability of selection.
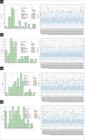
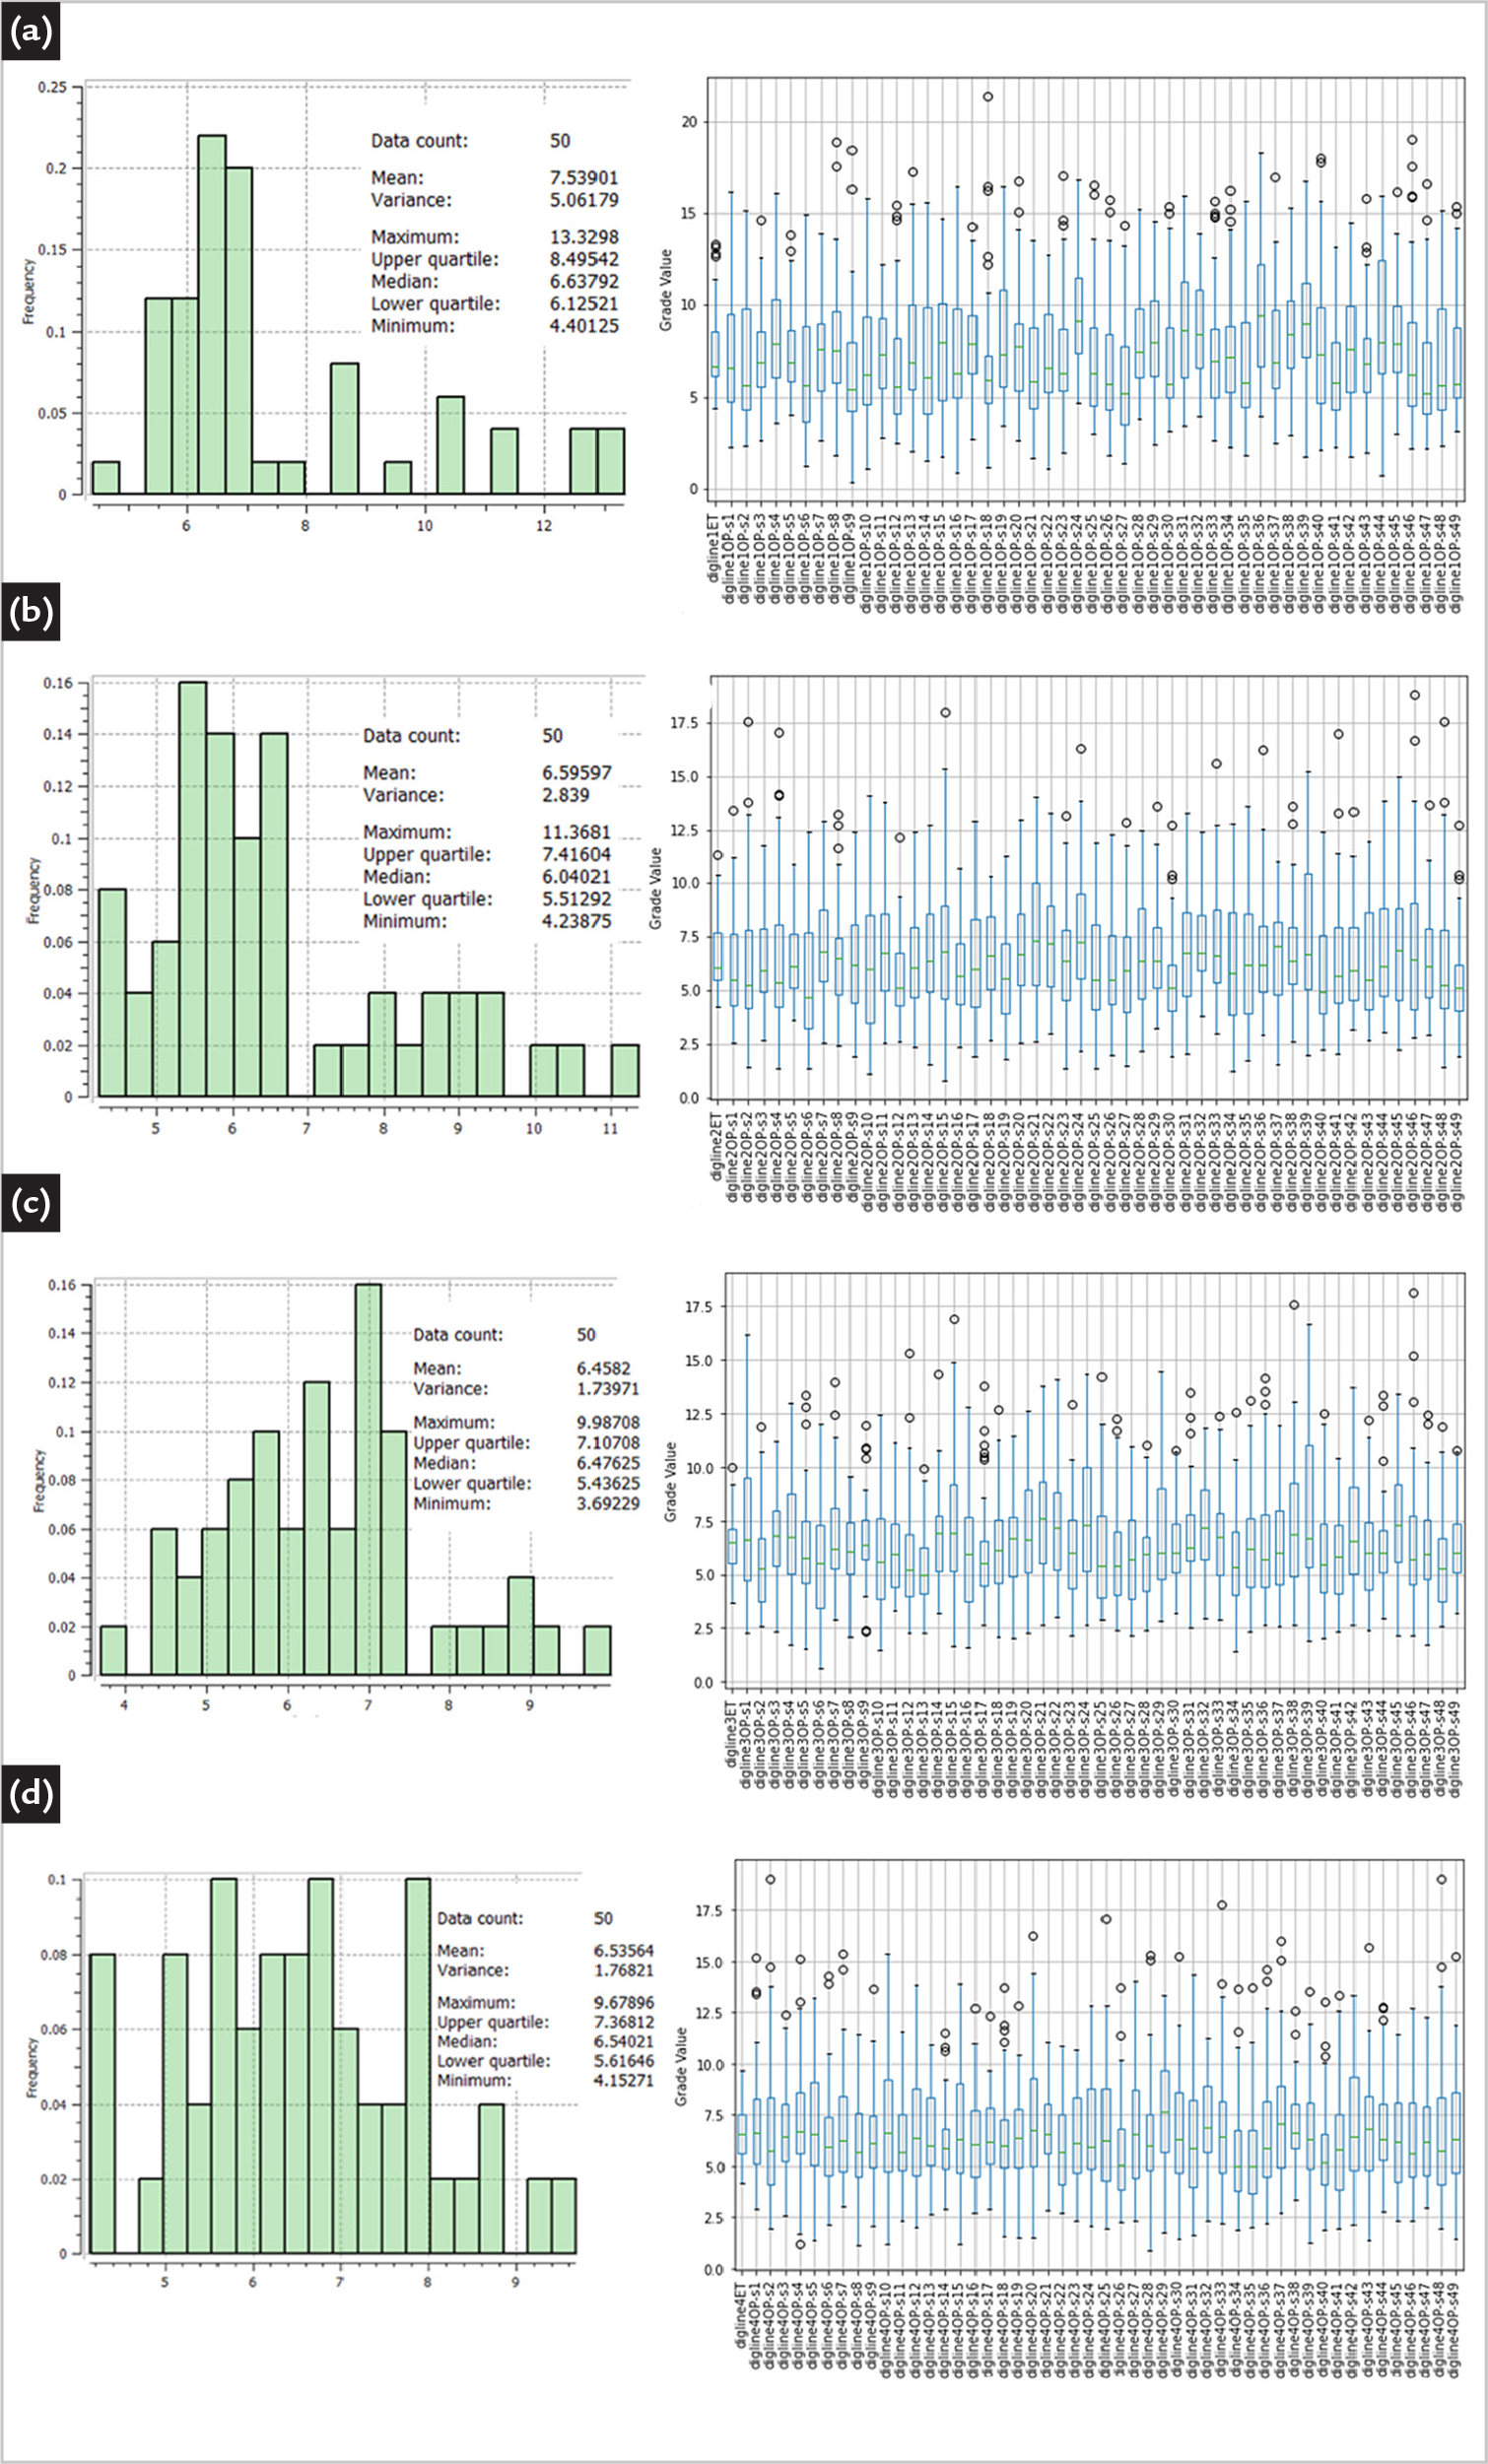
Probability distribution of grades for quasi-optimal diglines plotted on the E-type map, and box plots for quasi-optimal diglines on the E-type map, as well as across all 49 equiprobable simulations during the (a) first, (b) second, (c) third, and (d) fourth periods.
The reduction of the probability value as the periods expand because a larger area (and more blocks) is potentially attainable by possible diglines.
Figure 12 on the right displays histograms for the first (a), second (b), third (c), and fourth (d) periods of the quasi-optimal diglines. Meanwhile, Figure 12 on the left exhibits boxplots of quasi-optimal diglines on the E-type map and across all simulations for the first (a), second (b), third (c), and fourth (d) periods. It is noteworthy that smoothing effects on the mean grade map influence both the maximum and minimum grade values.
Notice that the figure showcase the behaviour of P2O5 grades in the diglines formed by blocks procured by the algorithm with lower geological risk associated with the uncertainty of grades across the stochastic model, revealing the sensitivity to variations in grade behaviour. The difference between equiprobable models and the quasi-optimal model of the diglines is that all the equiprobable diglines were used to generate a quasi-optimal digline that aims to define the geoposition of blocks with less geological risk uncertainty.
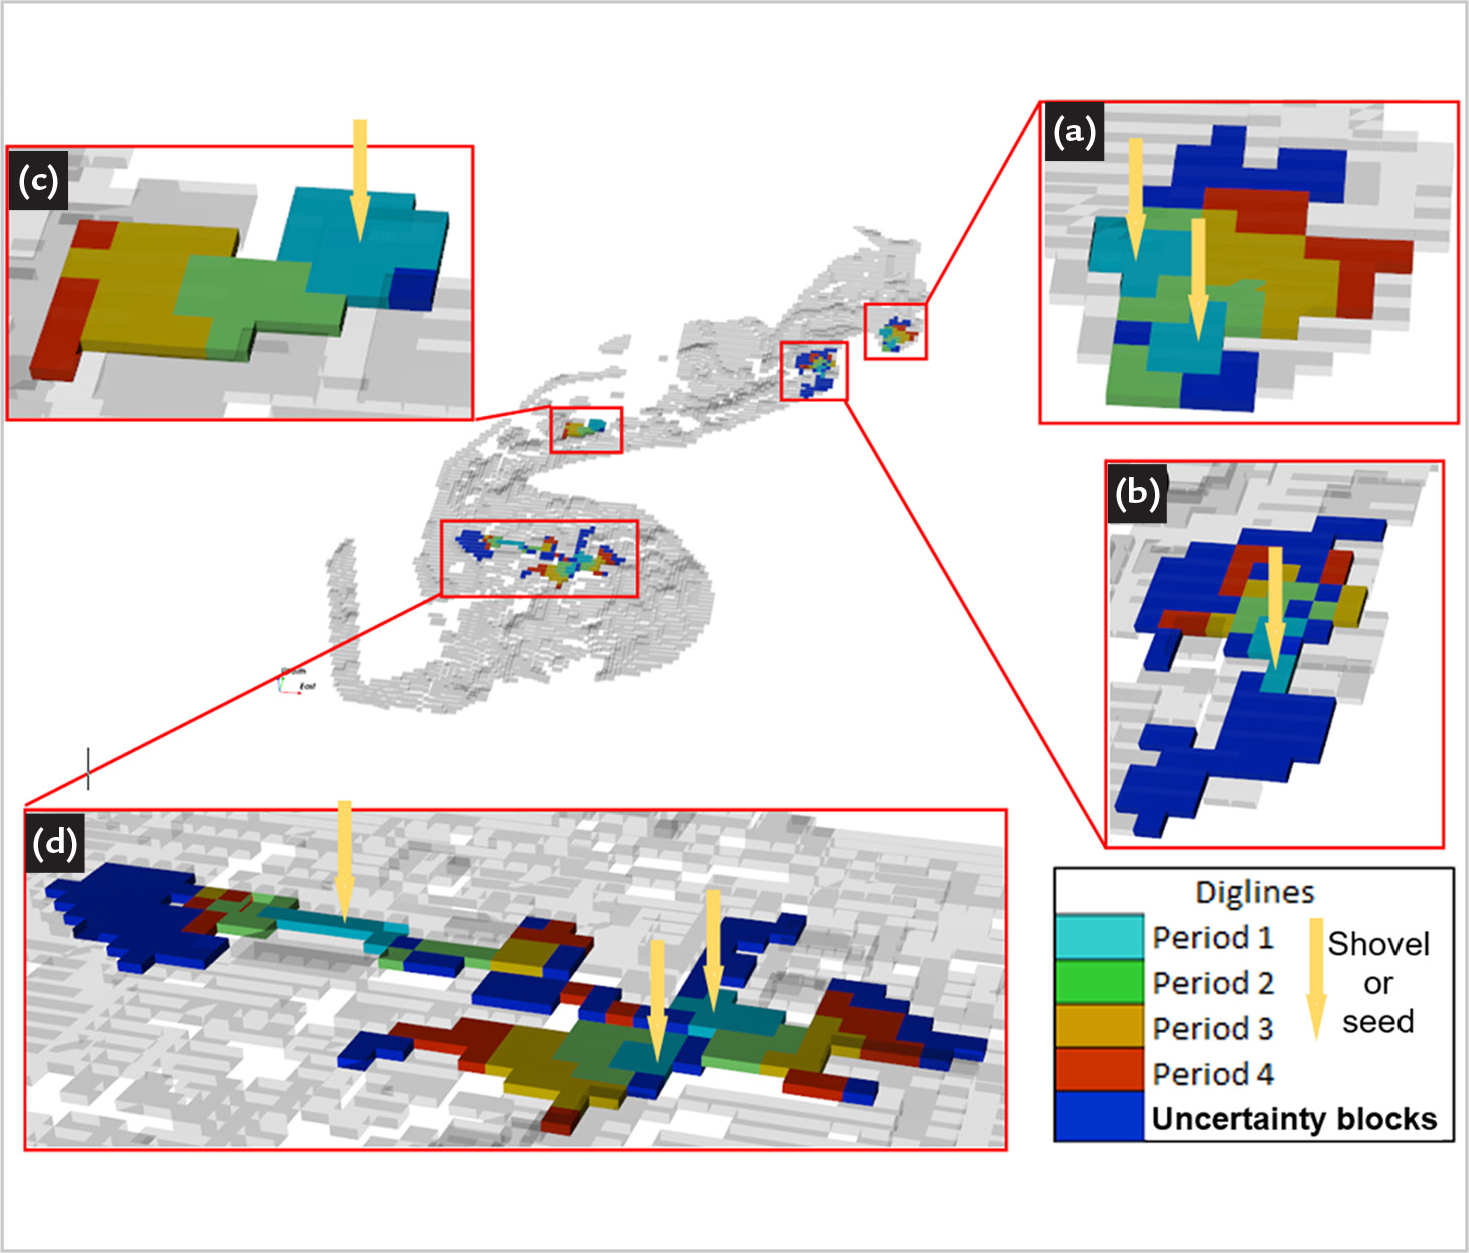
Figure 13 displays the sequence areas for each period, marked by the locations of the seed points. In part (a), seeds 7 and 6 are positioned; in part (b), seed 5 is the starting point; and in part (c), seed 4 marks the beginning. Finally, in part (d), seeds 3, 2, and 1 are located. The excavation lines for the four periods are also shown, as indicated in the legend. Additionally, blocks with the lowest probability of occurrence that were not selected are marked in blue. Specific mining restrictions define the limited development space. However, it's worth noting that in part (c), only one block with a low probability was not selected. It's important to emphasize that when selecting the initial periods in this area, consideration was given to blocks that would later be included in subsequent periods.
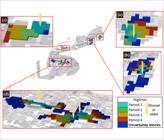
Mining sequence based on the probability distribution of grades, seed points, and optimization under geological uncertainty.
4. Validation
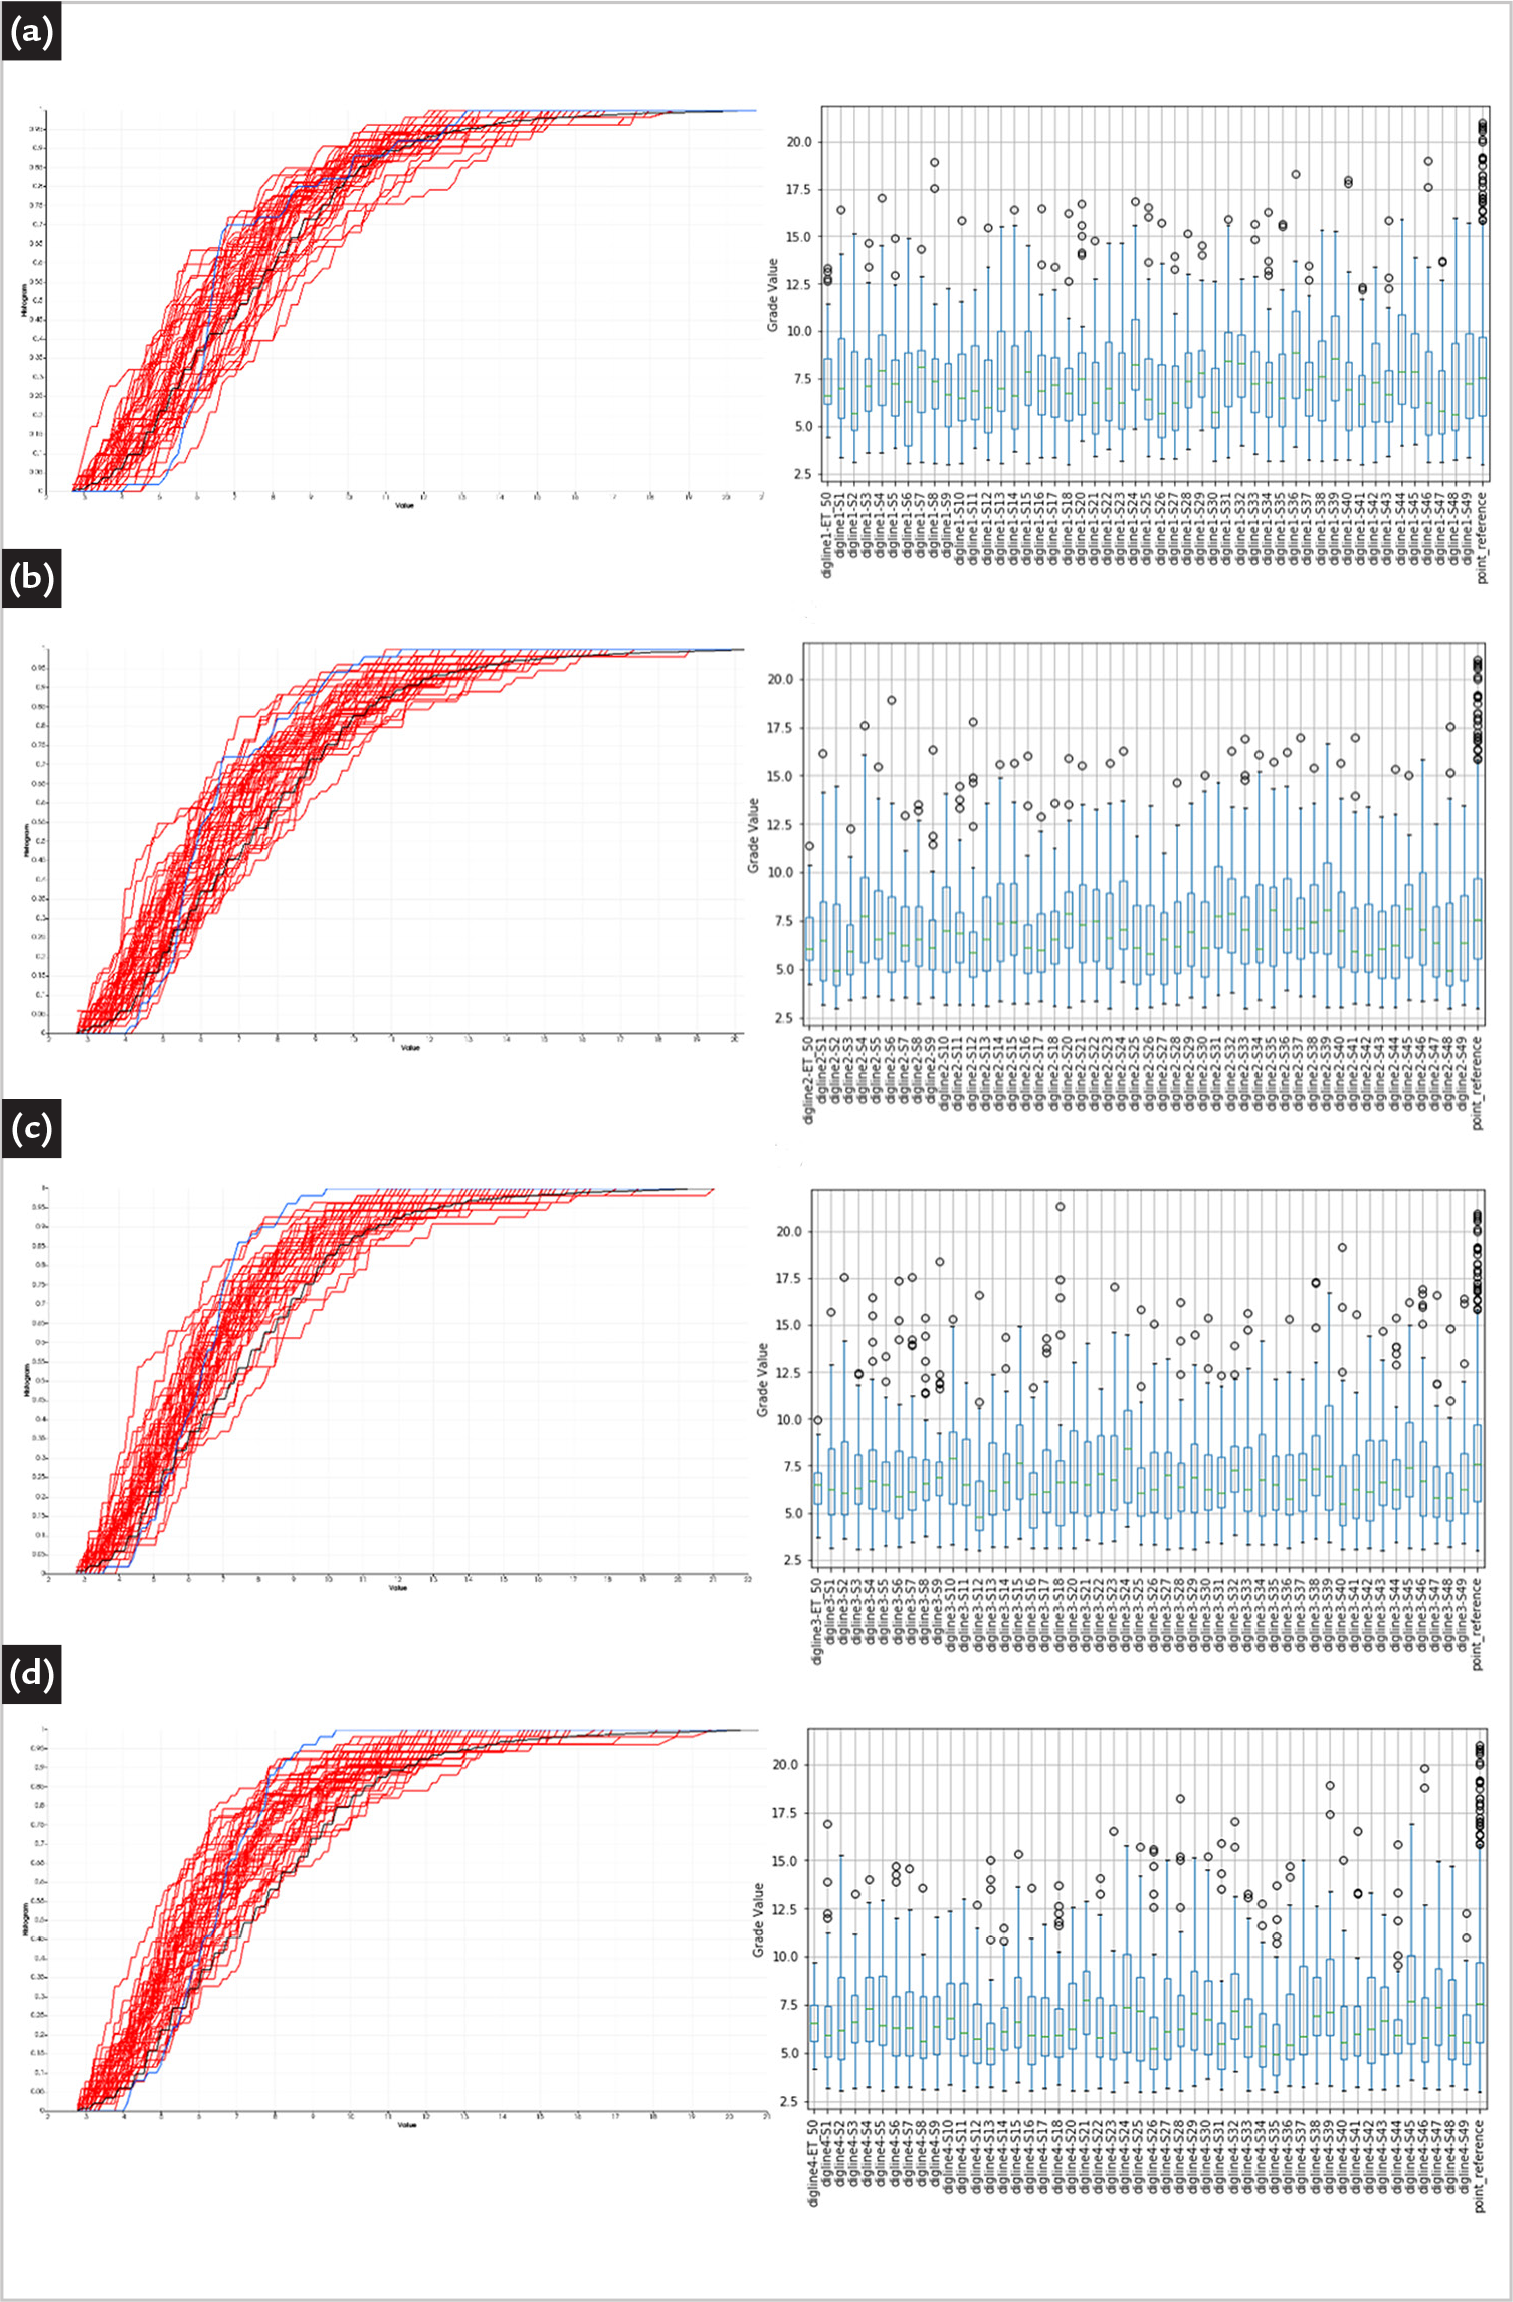
Figure 14 illustrates the cumulative distributions of grades. In red are the equiprobable diglines procured in each of the 49 simulated models, in black, the reference model, and in blue, the quasi-optimal diglines. Also shown are the box plots for the quasi-optimal diglines, the 49 equiprovavel diglines, and the reference model for (a) first, (b) second, (c) third, and (d) fourth periods. The box plots provide a visual comparison, starting with the quasi-optimal digline drawn on the E-type (map of the grade means). Following that are the 49 equiprobable diglines and the reference model.
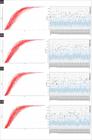
Cumulative distribution of grades: the blue line represents quasi-optimal diglines plotted on the E-type map, the red line corresponds to equiprobable diglines procured in each of the 49 simulated models, and the black line indicates the reference model. Additionally, box plots for the same models are plotted in (a) the first, (b) the second, (c) the third, and (d) the fourth periods.
It is demonstrated that the model generated by the quasi-optimal digline algorithm aligns with the ergoside of the equiprobable diglines obtained in each of the 49 simulations.
5. Discussion
As demonstrated by the results, this study has shown the potential to create maps indicating the likelihood of block occurrences across the 49 simulated models. This was achieved by employing a transfer function that establishes statistical stationarity for each digline, ultimately selecting the 50 most probable blocks for each digline. A key insight from this methodology lies in its ability to optimize the utilization of stochastic models for short-term planning, particularly in exposed areas where seed points and digline development are constrained within the actual pit shell. Traditional manual techniques would render it impractical to analyze and optimize all stochastic models for digline definition. The transformation from point samples to block support enabled the direct comparison of histograms between the reference model and the blocks included in the diglines.
Validation using a map of the mean grades of the 49 equiprobable models, despite its known smoothing effect on extreme values, indicated that the probability distribution functions of diglines closely align with the reference model.
6. Conclusion
This article has introduced a methodology to enhance short-term mining planning by incorporating grade uncertainty into the definition of excavation lines and generating multiple equiprobable mine plans. The approach proposes a single digline by selecting blocks with the highest probability of occurrence, considering the grade uncertainty associated with block values. This effectively embeds geological uncertainty into selecting diglines for short-term mine planning. An algorithm developed in Python 3 utilizes all equiprobable diglines to derive a single optimal model for short-term mining planning. This solution would be virtually impossible to obtain manually due to the sheer number of models that would need to be analyzed to match the probability distribution for grades of a reference model.
This methodology enables the definition of diglines while accounting for geological uncertainty, stationary mean, and grade variance. Additionally, in the event of unforeseen operational constraints, new blocks can be selected based on their probability of selection.
While this case study primarily focused on univariate simulation models, addressing the challenge of assessing multivariate uncertainty in short-term mine planning, it is a subject of ongoing development and will be explored in future studies.
7. Restrictions
The developed algorithms are limited to pit-shell models, specifically targeting grade control in very short-term mine planning for exposed blocks. To extend their applicability to non-exposed blocks, the model would need updates to a broader time horizon (e.g., biannual or annual planning).
8. Disclosure statement
No potential conflict of interest was reported by the authors.
References
-
BOTH, C.; DIMITRAKOPOULOS, R. Joint stochastic short-term production scheduling and fleet management optimization for mining complexes. Optimization and Engineering, v. 21, n. 4, p. 1717-1743, 2020. DOI: https://doi.org/10.1007/s11081-020-09495-x
» https://doi.org/10.1007/s11081-020-09495-x -
CAERS, J.; JOURNEL, A. Stochastic reservoir simulation using neural networks trained on outcrop data. In: ANNUAL TECHNICAL CONFERENCE AND EXHIBITION - SPE - 49026, 1998. DOI: https://doi.org/10.2118/49026-MS
» https://doi.org/10.2118/49026-MS -
CAPPONI, L. N. Planejamento estocástico de curto prazo incorporando a incerteza da estimativa no controle de teores. Tese (Doutorado) - Universidade Federal do Rio Grande do Sul - UFRGS, Porto Alegre, 2019. DOI: http://hdl.handle.net/10183/212870
» http://hdl.handle.net/10183/212870 - DAVID, M. Tools for planning: variances and conditional simulations. In: APCOM SYMPOSIUM, University of Arizona, 11, 1973. D10-D23.
- DEUTSCH, C. V.; JOURNEL, A. Geostatistical software library and user’s guide. New York, 119, 147, p. 578, 1992.
-
DIMITRAKOPOULOS, R.; JEWBALI, A. Joint stochastic optimisation of short and long term mine production planning: method and application in a large operating gold mine. Mining Technology, v. 122, n. 2, p. 110-123, 2013. DOI: https://doi.org/10.1179/1743286313Y.0000000040
» https://doi.org/10.1179/1743286313Y.0000000040 - DOWD, P. Risk assessment in reserve estimation and open-pit planning. Transactions of the Institution of Mining and Metallurgy - Section A - Mining Industry, 103:A148, 1994.
-
GEISSLER, B.; MEW, M.; WEBER, O.; STEINER, G. Efficiency performance of the world's leading corporations in phosphate rock mining. Resources, Conservation and Recycling, 105, p. 246-258, 2015. DOI: https://doi.org/10.1016/j.resconrec.2015.10.008
» https://doi.org/10.1016/j.resconrec.2015.10.008 - GODOY, M. The effective management of geological risk in long-term scheduling of open pit mines. PhD diss, University of Queensland, Brisbane, 2003.
-
GUARDIANO, F.; SRIVASTAVA, R. M. Multivariate geostatistics: beyond bivariate moments. Geostatistics Tróia’92, v. 1, Dordrecht: Springer Netherlands. p. 133-144. DOI: https://doi.org/10.1007/978-94-011-1739-5_12
» https://doi.org/10.1007/978-94-011-1739-5_12 - JOURNEL, A. G.; HUIJBREGTS, C. J. Mining geostatistics. Harcout Brace: France Academic Press, 1978.
- JOURNEL, A. G.; KYRIAKIDIS, P. C. Evaluation of mineral reserves: a simulation approach. Oxford University Press, 2004.
-
JOURNEL, A. G. Geostatistics for conditional simulation of ore bodies. Economic Geology, SecG, 69:5, p. 673-687, 1974. DOI: https://doi.org/10.2113/gsecongeo.69.5.673
» https://doi.org/10.2113/gsecongeo.69.5.673 -
MATHERON, G. Principles of geostatistics. Economic Geology, v. 58, n. 8, p. 1246-1266. DOI: https://doi.org/10.2113/gsecongeo.58.8.1246
» https://doi.org/10.2113/gsecongeo.58.8.1246 -
MATHERON, G. Forecasting block grade distributions: the transfer functions. In: ADVANCED GEOSTATISTICS IN THE MINING INDUSTRY. In: NATO ADVANCED STUDY INSTITUTE HELD AT THE ISTITUTO DI GEOLOGIA APPLICATA OF THE UNIVERSITY OF ROME, Italy, 13-25, Oct., 1975, p. 237-251, 1976. DOI: https://doi.org/10.1007/978-94-010-1470-0
» https://doi.org/10.1007/978-94-010-1470-0 - NEUFELD, C. T.; NORRENA, K. P.; DEUTSCH, C. V. Guide to geostatistical grade control and dig limit determination. 2005 (Guidebook series, 1).
- NORRENA, K. P. Decision making using geostatistical models of uncertainty. (Dissertação) - Department of School of Mining and Petroleum Engineering, Edmonton, Alberta, Canadá, 2007.
-
QUIGLEY, M.; DIMITRAKOPOULOS, R. Incorporating geological and equipment performance uncertainty while optimizing short-term mine production schedules. International Journal of Mining Reclamation and Environment, v. 34, n. 5, p. 362-383, 2020. DOI: https://doi.org/10.1080/17480930.2019.1658923
» https://doi.org/10.1080/17480930.2019.1658923 -
RAHMANPOUR, M.; OSANLOO, M. Resilient decision making in open pit short-term production planning in presence of geologic uncertainty. International Journal of Engineering, v. 29, n. 7, p. 1022-1028, 2016. Available at: https://api.semanticscholar.org/CorpusID:115084869
» https://api.semanticscholar.org/CorpusID:115084869 -
ROSSI, M. E.DEUTSCH, C. V. Mineral resource estimation. Springer Science & Business Media, 2013. DOI: https://doi.org/10.1007/978-1-4020-5717-5
» https://doi.org/10.1007/978-1-4020-5717-5 -
SOLEYMANI SHISHVAN, M.; BENNDORF, J. The effect of geological uncertainty on achieving short-term targets: a quantitative approach using stochastic process simulation. Journal of the Southern African Institute of Mining and Metallurgy, v. 116, n. 3, p. 259-264, 2016. DOI: http://dx.doi.org/10.17159/2411-9717/2016/v116n3a7
» http://dx.doi.org/10.17159/2411-9717/2016/v116n3a7 -
STEINER, G.; GEISSLER, B.; WATSON, I.; MEW, M. C. Efficiency developments in phosphate rock mining over the last three decades. Resources, Conservation and Recycling 105, p. :235-245, 2015. DOI: https://doi.org/10.1016/j.resconrec.2015.10.004
» https://doi.org/10.1016/j.resconrec.2015.10.004 -
STREBELLE, S. Conditional simulation of complex geological structures using multiple-point statistics. Mathematical Geology, 34, p. 1-21, 2002. DOI: https://doi.org/10.1023/A:1014009426274
» https://doi.org/10.1023/A:1014009426274 -
TOLEDO, A. A. T. Desenho de polígonos e sequenciamento de blocos de minério para planejamento de curto prazo procurando estabilização dos teores. Dissertação (Mestrado) - Universidade Federal do Rio Grande do Sul - UFRGS, Porto Alegre, Brasil, 2018. Available at: http://hdl.handle.net/10183/180128
» http://hdl.handle.net/10183/180128 -
TOLEDO, A. A. T. Sequenciamento estocástico de blocos de minério para uso no planejamento de curto prazo, procurando estabilização multivariada dos teores. Dissertação (Mestrado) - Universidade Federal do Rio Grande do Sul - UFRGS, Porto Alegre, Brasil. Disponível em: http://hdl.handle.net/10183/180128
» http://hdl.handle.net/10183/180128 -
TOLEDO, A. A. T.; MARQUES, D. M.; COSTA, J. F. C. L. CAPPONI, L. N. Short-term mine scheduling targeting stationary grades. REM - International Engineering Journal, v. 75, n. 1, p. 73-82, 2021. DOI: https://doi.org/10.1590/0370-44672020750134
» https://doi.org/10.1590/0370-44672020750134 - WHITTLE, D.; BOZORGEBRAHIMI, A. Hybrid pits-linking conditional simulation and lerchs-grossmann through set theory. Orebody Modelling and Strategic Mine Planning, 14, p. 22-24, 2004.