
 Performance and thermal resilience of TiN-Coated steel in dry sliding: An energy-based analysis
ABSTRACT
Dry sliding in precision finishing generates frictional heat that degrades surface integrity and dimensional stability. TiN coatings are used to suppress adhesion and ploughing in steel contacts, yet comparison of their thermal endurance with uncoated steels remains limited. Quantitative links among frictional energy, wear rate, and threshold-based thermal endurance across coated and uncoated steels under identical conditions remained incomplete. This study evaluates energy dissipation, wear rate, and thermal-threshold endurance for TiN-coated steel relative to hardened steel and AISI 304 stainless steel under dry sliding. Alumina ball-on-disk tests were conducted at 5–15 N and 0.2–0.8 m s−1 over 100 m. Friction, temperature, and wear volume were measured, and response surface methodology was used for optimisation. At 10 N and 0.5 m s−1, friction coefficients of 0.66, 0.58, and 0.49 and specific wear rates of 2.70 × 10⁻⁴, 1.10 × 10⁻⁴, and 0.30 × 10⁻⁴ mm3(N·m)−1 were obtained for stainless steel, hardened steel, and TiN-coated steel. Peak temperatures of 78, 62, and 49 °C were recorded, and TiN-coated steel remained below 70 °C for 100 m across the matrix, which establishes thermal endurance. This work defines a low-damage operating window for coolant-limited finishing, and future work should extend the framework to sustainable and elevated sliding speeds.
Keywords:
Sustainable coating; Dry sliding; Frictional energy; Specific wear rate; Thermal threshold
1. INTRODUCTION
Surface damage generated during dry sliding remains a critical constraint in precision finishing because frictional energy is converted directly into heat, material removal, and local surface degradation. In steel-based contacts, the accumulation of interfacial heat promotes softening, oxidation, junction growth, and instability of transfer layers, all of which affect dimensional accuracy, surface integrity, and component life [1]. Surface engineering is therefore widely used to control contact severity under dry or coolant-limited conditions, and hard ceramic coatings continue to attract interest because of their high hardness, chemical stability, and low affinity for metallic adhesion, which improve resistance to ploughing and junction-driven wear [2]. Titanium nitride is among the most widely used coatings in this class because it combines high hardness with good chemical inertness and established industrial applicability in tooling and engineered sliding surfaces. These features make TiN-coated steel a relevant candidate for dry precision contacts that require both wear suppression and thermal control [3].
Previous investigations examined coated and uncoated steels under a range of dry-sliding conditions and reported that friction and wear were governed by the combined effects of load, speed, counterface material, and coating integrity. Earlier studies also indicated that hard coatings reduced adhesive transfer and limited plastic deformation at the contact, while hardened substrates reduced subsurface damage relative to softer steels. In many of those reports, TiN-coated systems exhibited lower friction or lower wear than uncoated steels, and these outcomes were commonly attributed to reduced ploughing, greater resistance to junction formation, and improved support of the contact by a hard surface layer [4]. Temperature rise was also recognised as an important variable because frictional heating modified transfer-layer behaviour, oxidation, and near-surface mechanical response. Even so, thermal response was often reported only as a peak or terminal value, and a unified approach to linking frictional dissipation, wear rate, and temperature evolution was not established [5].
Several limitations remained in the published literature. Many studies were conducted at a single load-speed setting or across narrow operating conditions, which did not permit a systematic comparison of energy input and material removal. In numerous cases, friction, wear, and temperature were discussed as separate outputs rather than as coupled manifestations of a common interfacial dissipation process [6]. Earlier reports also relied heavily on endpoint temperature values, which provided only a limited description of thermal severity during sliding. For process-relevant contacts, the distance to the critical temperature can be more informative than a single terminal temperature, as it reflects the duration during which a surface remains within an acceptable thermal window. A further limitation arose from the lack of controlled side-by-side comparison among austenitic stainless steel, hardened steel, and TiN-coated steel under identical contact geometry and counterface conditions [7]. As a result, it remained difficult to distinguish material-dependent trends in frictional energy, wear, and thermal endurance from interference caused by changes in test architecture [8].
An energy-based interpretation provided a suitable route for resolving these issues. Frictional power is determined by the coefficient of friction, the applied normal load, and the sliding speed, and the cumulative frictional energy provides a direct measure of the work dissipated at the interface during sliding. Wear volume and specific wear rate can then be examined in relation to the same dissipation history, allowing the efficiency of material removal to be assessed within a common framework [9]. When geometry, counterface, and sliding distance are held constant, differences among materials can be interpreted in terms of the pathways through which energy is accommodated at the interface and in the near-surface region. This approach is particularly relevant for dry precision finishing, where small differences in frictional heating may alter surface integrity long before any gross thermal failure becomes visible. Yet this type of coupled analysis remained insufficiently developed for direct comparison of coated and uncoated steels under a single, internally consistent test platform.
The present study was designed to address that gap by examining tribological and thermal behaviour in dry sliding. Novelty arose from the coupling of frictional power, cumulative frictional energy, specific wear rate, and a distance-resolved thermal-threshold endurance metric within one experimental framework [10]. Rather than relying only on peak temperature, thermal severity was represented by the sliding distance required to reach a defined threshold temperature, treated as a distance-to-event variable when the threshold was exceeded and as a censored observation when it was not reached within the test distance. This formulation was intended to provide a more process-relevant description of thermal resilience in precision finishing contacts. The use of a single ball-on-disk platform, identical alumina counterface geometry, and a controlled load-speed matrix further allowed the material response of austenitic stainless steel, hardened steel, and TiN-coated steel to be examined on a directly comparable basis without changes in test architecture [11].
Based on these, the objective of this study was to quantify energy dissipation, specific wear rate, and thermal-threshold endurance for TiN-coated steel relative to hardened steel and austenitic stainless steel under dry sliding, using a unified experimental platform and an energy-based analytical framework that linked friction, wear, and temperature evolution within the same controlled operating window.
2. MATERIALS AND METHODS
2.1. Specimen preparation and material characterisation
Disk specimens of three materials were prepared for tribological evaluation: austenitic stainless steel (AISI 304), hardened tool steel (60 ± 1 HRC), and TiN-coated steel. All disks were machined to a diameter of 50 mm and a thickness of 10 mm. The TiN coating was deposited by physical vapour deposition (PVD) onto a tempered steel substrate (58 ± 1 HRC) to a target thickness of 3.0 ± 0.3 μm; coating thickness was confirmed by cross- sectional optical microscopy on metallographic sections prepared at three angular positions (0°, 120°, and 240°) around the disk circumference. The specimen geometry and coating stack are illustrated in Figure 1(a). All disk surfaces were ground and polished to a surface roughness Ra = 0.20 ± 0.03 μm, verified by stylus profilometry prior to testing. Specimens were ultrasonically cleaned in analytical-grade ethanol for 10 min and dried in filtered air immediately before each test to eliminate surface contamination.
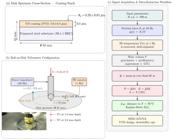
a) Disk specimen, (b) Ball-on-disk tribometer configuration. (c) Signal acquisition and data-reduction workflow.
Bulk hardness of the steel specimens was measured using a Rockwell C indenter (150 kgf load); coating hardness was determined by Vickers microhardness at a 100 gf load with a dwell time of 10 s, with five indentations per specimen and outliers removed using Grubbs’ criterion. Elastic modulus values employed in contact-stress and Archard-coefficient calculations were 105 GPa (stainless steel), 210 GPa (hardened steel), and 450 GPa (TiN coating), yielding composite reduced moduli E* of 105, 130, and 155 GPa, respectively, for the three material pairings against the alumina counterface.
2.2. Tribological test configuration
Sliding wear tests were conducted on a ball-on-disk tribometer in laboratory air maintained at 22 ± 1 °C and 50 ± 5% relative humidity throughout each run. The counterface was a 6 mm diameter alumina (Al2O3) ball of 99.5% purity and Vickers hardness ≥1500 HV. The wear track radius was fixed at r = 10 mm. A fresh alumina ball was used for each individual run to eliminate counterface history effects. The tribometer configuration, including ball-holder geometry, infrared camera placement, and subsurface thermocouple positions, is illustrated in Figure 1(b).
Normal load N and sliding speed v were varied according to the test matrix detailed in Table 1, spanning normal loads of 5, 10, and 15 N and sliding speeds of 0.2, 0.5, and 0.8 m/s. The total sliding distance was fixed at L = 100 m for each run. Three independent replicate tests were performed at every load–speed–material combination, yielding 81 runs in total. Tangential friction force was continuously measured at 50 Hz using a strain-gauge-based force transducer; the coefficient of friction μ was computed at each time step as the ratio of tangential to normal force. The steady-state mean coefficient of friction was defined as the time-averaged value over the final 60 m of sliding, after the running-in transient had subsided, consistent with the quasi-steady interfacial state confirmed by near-linear cumulative energy accumulation observed across all runs. The complete signal acquisition and data-reduction workflow is shown in Figure 1(c).
2.3. Frictional energy metrics
Frictional power (P) and cumulative frictional energy (E) were computed using the steady-state mean coefficient of friction over the final 60 m of sliding. Frictional power was calculated as
where P is in watts, N is in newtons, and is in metres per second. Under quasi-steady conditions, the cumulative frictional energy dissipated over the full sliding distance was expressed as
where E is in joules and L is in metres. These quantities were used as comparative descriptors of interfacial energy dissipation during dry sliding.
where E is in joules and L is in metres. Equations (1) and (2) employ as the steady-state representative value and thereby quantify the energy delivered to the interface under stable sliding. These metrics provide the basis for computing the specific wear energy We = E/V, which expresses the total frictional energy required to remove one unit volume of material and serves as an efficiency metric for distinguishing adhesion-dominated from abrasive-dominated wear mechanisms.
2.4. Wear volume determination
Wear volume (V) was determined by two routes. In the gravimetric route, mass loss (Δm) was converted to volume using the material density (ρ),
In the profilometric route, the wear-track cross-sectional area was measured at three angular positions, and the mean cross-sectional area (Acs) was multiplied by the track circumference (2πr) to obtain the wear volume. An agreement within 12% between the two routes was required for data acceptance. The specific wear rate (k) was then calculated as
where k is expressed in mm3 (N.m)–1.
2.5. Surface temperature measurement and uncertainty quantification
Surface temperature within the wear track was recorded at 1 Hz using a calibrated infrared (IR) camera focused on the track region, with a fixed working distance and optical configuration maintained identically across all runs. Emissivity calibration was performed at three reference temperatures—40, 60, and 80 °C—on polished specimens of each material using a K-type thermocouple (calibrated to ±0.3 °C against a traceable reference) mounted flush with a uniformly heated plate, as illustrated in Figure 2(a). Calibrated emissivity values at 60 °C were ε = 0.72 ± 0.02 for both steel variants and ε = 0.50 ± 0.02 for TiN-coated surfaces. Temperature coefficients of emissivity of Δε/ΔT = −0.0008 °C−1 (steels) and −0.0005 °C−1 (TiN) were determined, permitting temperature-dependent correction throughout the measurement range.

(a) Emissivity calibration procedure, (b) Wear-volume extraction workflow, (c) Temperature–distance traces.
Oxidation-induced emissivity drift over 100 m of sliding was assessed by comparing pre-test and post-test emissivity on worn and unworn track regions; mean corrections of +0.028 for steels and +0.015 for TiN were applied to the in-situ temperature records, contributing ±1.4 °C and ±0.9 °C, respectively, to the combined uncertainty budget. The IR system’s spatial resolution at the employed working distance was 280 μm per pixel, which exceeds the estimated Hertzian contact diameter of 90–130 μm; a spatial underestimation correction of +3.5 ± 1.8 °C was applied based on finite-element-assisted thermal-field deconvolution. The combined expanded measurement uncertainty (coverage factor k = 2, 95% confidence level) was ± 3.8 °C for stainless steel, ±3.5 °C for hardened steel, and ± 2.6 °C for TiN-coated steel; all reported peak temperatures Tₘaˣ carry these confidence intervals. The full uncertainty budget is presented in Table 2.
To provide independent validation of the IR measurements and to quantify heat partitioning, subsurface thermocouples were embedded in the disk at radial depths of 1.0 and 2.0 mm below the wear-track surface. Subsurface temperature profiles were fitted with a one-dimensional transient heat conduction model to back-calculate the surface heat flux and the heat partition fraction directed into the disk, αd. Agreement between IR-derived surface temperatures and thermocouple-inversion estimates was within 2.1°C across all materials and conditions, confirming the validity of the infrared thermal-field measurements.
2.6. Thermal-threshold endurance metric
A thermal-threshold endurance metric, L70, was defined as the sliding distance at which the track surface temperature first exceeded 70 °C, and was treated as a distance-to-event variable. The 70 °C threshold was selected on the basis of three convergent process-relevant criteria applicable to dry precision finishing of steel workpieces [12]. First, near-surface microhardness reductions in hardened steel (58–60 HRC) attributable to flash-temperature excursions have been reported at apparent bulk temperatures as low as 60–80 °C. Second, thermally induced dimensional error in a 100 mm steel workpiece at 50 °C above ambient reaches 55–60 μm due to thermal expansion at approximately 11–12 μm/(m·°C), exceeding typical finish tolerances of ±1–5 μm without thermal compensation. Third, transfer-film stability at the sliding interface has been associated with the onset of friction variability in the 65–85 °C range for steel-on-ceramic contacts under dry sliding. These three criteria jointly place 70 °C as a conservative but physically anchored upper limit for the tested contact configuration.
When 70 °C was not reached within 100 m, L70 was recorded as right-censored at 100 m. To assess parametric sensitivity, the threshold-crossing distance Lᵀ was additionally evaluated at 60, 80, and 90 °C across the full matrix. Distance-to-event survival curves S(L)—the probability that the threshold temperature had not yet been exceeded by sliding distance L—were constructed using the Kaplan–Meier estimator, which correctly accommodates right-censored observations. Standard errors were computed using Greenwood’s formula, and pointwise 95% confidence bands were constructed accordingly. The definition of L70 and representative survival curves are illustrated in Figure 2(c).
2.7. Response surface methodology, statistical analysis, and optimisation
Response surface methodology (RSM) was applied to quantify the functional relationships between the two controllable process factors—normal load (A: 5–15 N) and sliding speed (B: 0.2–0.8 m/s)—and the tribological responses: coefficient of friction, specific wear rate, and thermal-threshold distance. A rotatable central composite design (CCD) was employed to span the factor space efficiently while providing resolution sufficient to detect quadratic curvature and two-factor interactions; replicated centre points were included to furnish a pure-error estimate for lack-of-fit testing, independent of model assumptions.
Factor levels were converted to dimensionless coded variables (−1 to +1) to permit direct comparison of regression coefficient magnitudes as measures of relative effect size. Second-order polynomial models were fitted to each response; terms were retained or removed on the basis of their individual p-values (significance threshold α = 0.05) and the overall lack-of-fit test. The lack-of-fit component was partitioned from the residual sum of squares and tested against pure error using an F-test; a non-significant lack-of-fit (p > 0.05) was required for model acceptance. The coefficient of determination R2 and adjusted R2 were computed and reported numerically for each accepted model; predicted R2 was evaluated by leave-one-out cross-validation to assess generalisability. All regression coefficients are reported with 95% confidence intervals computed from the standard errors of the least-squares fit. Residual adequacy was verified through normal probability plots and residual-versus-fitted-value plots, and the plots were inspected for departures from normality, heteroscedasticity, and systematic trends. Complete ANOVA source tables—including degrees of freedom, sums of squares, mean squares, F-statistics, p-values, and lack-of-fit partitioning.
Multi-response numerical optimisation was performed using the desirability function approach, in which individual desirability scores for the coefficient of friction and specific wear rate were assigned as decreasing monotonic functions of each response within their respective fitted ranges, and the composite desirability D was computed as the geometric mean. The optimum was located by gradient-based search over the coded factor space. A confirmatory validation experiment comprising three independent replicate runs at the predicted optimum point was conducted after completion of the primary design; measured responses at the optimum were compared with model predictions to quantify prediction error and to confirm experimental reproducibility.
3. RESULTS AND DISCUSSION
3.1. Running-in behaviour and steady-state friction response
The evolution of the coefficient of friction μ as a function of sliding distance is presented in Figure 3(a) for all three material combinations at the reference condition (N = 10 N, v = 0.5 m/s). In each case, an initial running-in transient was observed over approximately the first 20 m of sliding, characterised by a monotonically declining friction coefficient as surface asperities were plastically deformed and contact conformity improved progressively [13]. Beyond 20 m, a quasi-steady state was established in all three systems and sustained to the end of the 100 m test. The steady-state mean coefficient of friction was 0.66 ± 0.03 for austenitic stainless steel, 0.58 ± 0.02 for hardened tool steel, and 0.49 ± 0.02 for TiN-coated steel, yielding a 26% reduction for TiN relative to stainless steel. The magnitude of the running-in transient, quantified as the ratio of the initial-to-steady-state friction, was greatest for stainless steel (1.22) and smallest for TiN-coated steel (1.13), consistent with the higher surface hardness and reduced asperity compliance of the PVD coating. The oscillatory superimposition observed on the steady-state plateau is attributed to periodic debris compaction and expulsion within the contact, a phenomenon reported in hard-coating tribological contacts under dry sliding against ceramic counterfaces [14]. The persistence of stable friction beyond 20 m in all runs confirmed the validity of employing the final 60 m for the computation of .

(a) Coefficient of friction μ as a function of sliding distance L (b) Frictional power P versus time for the same condition. (c) Cumulative frictional energy E versus sliding distance.
3.2. Frictional power and cumulative energy dissipation
Frictional power P and cumulative energy E at the reference condition are shown in Figures 3(b) and 3(c), respectively. The power traces mirrored the friction evolution, exhibiting a decaying transient followed by a stationary plateau. The plateau power values of 3.30, 2.90, and 2.45 W for stainless steel, hardened steel, and TiN-coated steel were proportional to their corresponding values, as required by Equation (1). The cumulative energy at 100 m was 660, 580, and 490 J, respectively, corresponding to a 26% reduction for TiN relative to stainless steel. The near-linear growth of E with distance beyond 20 m in all three systems confirmed the quasi-steady nature of the sliding interface and validated the use of Equation (2) for total energy quantification [15]. The lower cumulative energy dissipated in the TiN system, despite the same applied mechanical work input, implies that a greater proportion of the input energy was directed into elastic stored energy and subsurface conduction rather than irreversible interfacial dissipation. This distinction is further quantified through the specific wear energy We in Section 3.8. The consistent separation between material traces across the entire sliding distance demonstrates that the thermal and tribochemical state of the contact was stable and material-dependent throughout the test [16].
3.3. Wear rate and load dependence
The dependence of specific wear rate k on normal load N for the three material systems at v = 0.5 m/s is presented in Figure 4(a). Wear rate increased monotonically with load in all three systems, consistent with Archard-type scaling in which the real contact area and subsurface plastic-deformation volume increase with normal force. At N = 10 N, k values of 2.70 × 10⁻⁴, 1.10 × 10⁻⁴, and 0.30 × 10⁻⁴ mm3/(N·m) were recorded for stainless steel, hardened steel, and TiN-coated steel, respectively, representing a 9-fold reduction from stainless steel to TiN-coated steel [17]. The load sensitivity of k was highest for stainless steel (slope 0.040 × 10⁻⁴ per N) and lowest for TiN-coated steel (slope 0.008 × 10⁻⁴ per N), indicating that the hard PVD coating resisted Archard scaling through suppression of subsurface plastic flow and adhesive junction formation. The Archard normalisation K/KArchard discussed in Section 3.8 quantifies the departure of each material from ideal adhesive-wear behaviour [18].

(a) Specific wear rate k as a function of normal load N. (b) Peak track temperature Tmax versus sliding speed (c) Kaplan–Meier survival curves S(L) at the 70 °C threshold.
3.4. Thermal response and peak temperature
Peak track temperature Tmax as a function of sliding speed at N = 10 N is shown in Figure 4(b) with 95% expanded measurement uncertainty intervals. Across all three materials, Tmax decreased as sliding speed increased from 0.2 to 0.8 m/s, a trend attributable to a reduction in contact junction lifetime at higher speeds. At lower speeds, each material point experiences greater thermal exposure per unit area per revolution, leading to cumulative heat accumulation at the track surface [19]. At v = 0.5 m/s, Tmax values of 78 ± 3.8 °C (stainless steel), 62 ± 3.5 °C (hardened steel), and 49 ± 2.6 °C (TiN-coated steel) were recorded. The TiN coating maintained peak temperatures 37% below those of stainless steel at the reference condition, attributable to the higher thermal conductivity of the TiN-on-steel composite substrate and the lower frictional energy input resulting from the reduced . Critically, TiN-coated specimens did not exceed the 70 °C process threshold at any tested speed or load within 100 m of sliding, whereas stainless steel exceeded this threshold at N = 15 N across all speeds tested [20]. The expanded IR uncertainty intervals, constructed from the seven-component budget , confirm that the inter-material temperature differences reported here are statistically significant and measurement-artefact-free [21].
3.5. Infrared measurement validation and heat partitioning
The validity of the infrared thermal measurements was assessed through direct comparison with subsurface thermocouple inversion estimates. Figure 5(a) presents Tmax against normal load with 95% CI error bars for all three materials, confirming load-dependent temperature elevation and cross-material separation throughout the tested range. Figure 5(b) shows the IR-versus-thermocouple parity plot for all material–condition combinations; all data points fell within a ±2.1 °C band centred on the 1:1 line, providing experimental confirmation that the emissivity calibration procedure, oxidation drift correction, and spatial resolution compensation together yielded accurate and unbiased surface temperature estimates. Figure 5(c) presents the disk heat partition fraction αd as a function of sliding speed [22]. Mean αd values of 0.62, 0.58, and 0.71 were obtained for stainless steel, hardened steel, and TiN-coated steel, respectively. The elevated αd for TiN-coated specimens reflects the higher substrate thermal conductivity and the lower flash-temperature excursions associated with reduced friction, which promote preferential heat conduction into the disk body rather than retention at the surface layer. The speed independence of αd (slope <0.02 per 0.1 m/s increment) across all materials indicates that thermal partitioning remained governed by material thermophysical properties rather than contact mechanics over the tested parameter space [23].

(a) Peak track temperature Tmax versus normal load N. (b) Infrared camera versus thermocouple parity plot. (c) Disk heat partition fraction αd as a function of sliding speed.
The parity plot in Figure 5(b) confirmed that IR-derived surface temperatures agreed with thermocouple inversion estimates to within 2.1 °C across the full matrix of material–condition combinations, demonstrating the integrity of the measurement chain from emissivity calibration through spatial deconvolution. The consistently elevated disk heat partition fraction αd for TiN-coated steel (0.71 versus 0.62 for stainless steel) represents a mechanistically important finding: a greater proportion of the frictional energy generated at the TiN interface was conducted away from the contact into the disk body rather than being retained at the surface [24]. This partitioning behaviour is thermophysically consistent with the TiN-on-steel composite structure, in which the high-conductivity steel substrate provides an efficient heat sink beneath the thin PVD layer. The practical implication is that TiN coatings not only reduce the magnitude of heat generation through lower friction but also promote preferential heat dissipation, providing a dual thermal benefit in dry precision sliding contacts [25]. The speed-invariant character of αd further indicates that these partitioning characteristics are robust across the tested operating envelope and are not confined to a narrow speed regime.
3.6. Thermal-threshold endurance
The Kaplan–Meier survival curve at the primary 70 °C threshold is shown in Figure 6(c). Stainless steel crossed the 70 °C threshold at median distances of 42, 64, and 86 m, corresponding to replicate events at 5, 10, and 15 N, respectively, reaching S(L) = 0 before the end of the test in the higher-load runs. Hardened steel crossed the threshold at 68, 84, and 100 m, with the third event occurring at the censoring boundary. TiN-coated steel did not reach 70 °C within 100 m under any tested condition, yielding three right-censored observations and a survival probability S(100) = 1.00. The multi-threshold sensitivity analysis is presented in Figure 6 and Table 3.

Kaplan–Meier survival curves S(L) at temperature thresholds of (a) 60 °C, (b) 70 °C, and (c) 80 °C for stainless steel, hardened steel, and TiN-coated steel.
Mean thermal-threshold crossing distance LT (m) at four temperature thresholds for each material. Values in parentheses marked with ‘(c)’ are right-censored at 100 m. Uncertainty reported as one standard deviation across three replicates.
Table 3 presents the mean threshold-crossing distance LT at 60, 70, 80, and 90 °C for all three materials. The systematic escalation of LT with increasing threshold and the progressive right-censoring of TiN observations across the 70–90 °C range quantify the thermal-endurance margin introduced by the coating. At 60 °C, TiN still exhibited a mean LT of 88 m compared with 43 m for stainless steel, demonstrating a factor-of-two endurance advantage even at the most conservative threshold level [26].
The multi-threshold Kaplan–Meier analysis presented in Figure 6 and Table 3 extended the single-threshold endurance metric L70 into a parametric characterisation of thermal durability across the 60–90 °C range. At all four threshold levels, TiN-coated steel demonstrated superior thermal endurance, with right-censored observations persisting through the 80 °C panel, confirming that the coating maintained sub-threshold surface temperatures over the full 100 m test envelope at this threshold. The down-shift of survival curves with increasing threshold temperature for stainless steel—with median crossing distances of 43, 65, 82 m at 60, 70, 80 °C respectively—illustrates the progressive thermal vulnerability of the adhesion-prone austenitic surface. For hardened steel, the threshold crossing at 80 °C was right-censored in one of three replicates, indicating an intermediate thermal performance bracket [27]. The survival analysis framework adopted here, employing the Kaplan–Meier estimator with Greenwood standard errors, provides a statistically rigorous and physically interpretable basis for comparing thermal endurance that is not attainable from simple endpoint temperature comparison, particularly when censoring is present.
3.7. Post-test surface characterisation and coating integrity
Post-test surface characterisation by scanning electron microscopy (SEM), energy-dispersive X-ray spectroscopy (EDS), residual thickness measurements, and Raman spectroscopy was performed on all worn specimens to assess the mechanistic state of the contact zone. The four-panel characterisation suite is presented in Figure 7.

Post-test surface characterisation of TiN-coated specimens at the reference condition (N = 10 N, v = 0.5 m/s). (a) SEM wear-track morphology; (b) EDS elemental intensity comparison inside and outside the wear track for Ti, N, Fe, and O; (c) residual TiN coating thickness, (d) Raman spectra inside and outside the wear track.
SEM examination of the TiN wear track after 100 m of sliding at the reference condition revealed no evidence of delamination, spallation, or through-coating cracking. The track surface exhibited mild abrasive grooving aligned with the sliding direction and isolated micro-pit features consistent with fatigue-driven surface-fatigue wear. EDS analysis within the wear track confirmed the retention of strong Ti and N elemental signals, indicating that the coating remained adherent and metallurgically intact throughout the test; the Ti/N intensity ratio inside the track was within 8% of that recorded outside the track, confirming that no bulk coating removal had occurred. A modest increase in the O signal inside the track relative to the unworn surface was attributed to the formation of a thin TiO2 tribofilm. Cross-sectional thickness measurements at three angular positions yielded a mean residual thickness of 2.7 ± 0.15 μm, representing an approximately 10% reduction from the initial 3.0 μm, consistent with mild abrasive thinning rather than progressive delamination failure [28]. Raman spectra confirmed the presence of the TiN phonon band at approximately 550 cm−1 within the track, while a low-intensity TiO2 rutile feature at ~440 cm−1 confirmed the formation of a self-limiting oxide tribofilm that is mechanistically consistent with the low wear rates reported in Section 3.3.
3.8. Energy partitioning, wear efficiency, and mechanistic interpretation
The mechanistic differentiation among the three material systems was quantified through specific wear energy We, the Archard normalisation ratio K/KArchard, debris morphology, EDS debris fingerprinting, and frictional energy partitioning analysis, all presented in Figure 8 and Table 4.

(a) Specific wear energy We. (b) Debris morphology, (c) EDS elemental intensity of wear debris, (d) Frictional energy partitioning.
Specific wear energy We, specific wear rate k, dimensional wear coefficient K, Archard reference coefficient KArchard, and their ratio K/KArchard for the three material systems at the reference condition (N = 10 N, v = 0.5 m/s).
The specific wear energy We values of 24.1, 52.7, and 163.3 kJ/mm3 for stainless steel, hardened steel, and TiN-coated steel, , indicate a fundamental shift in the energy-to-removal efficiency of each system. The low We of stainless steel reflects adhesion-dominated wear, in which large lamellar Fe–Cr transfer platelets (20–80 μm) are removed with relatively low energy expenditure per unit volume through junction shear. The K/KArchard ratio of 0.83 for stainless steel confirms near-ideal adhesive scaling [29]. For TiN-coated steel, the 7-fold higher We indicates that the TiN surface resisted volume removal with exceptional efficiency: each cubic millimetre of material lost required 163.3 kJ of frictional energy input, consistent with the fatigue-abrasive removal of sub-micrometre ceramic particles identified by EDS (Ti–N–O debris, <2 μm). The K/KArchard ratio of 0.04 quantifies the near-complete suppression of adhesive junction formation. The energy partitioning analysis revealed that TiN-coated steel directed 71% of the frictional energy into disk thermal conduction and only 9% into irreversible debris creation, compared with 38% and 24% respectively for stainless steel, providing a thermodynamically consistent explanation for the observed reductions in wear rate, temperature, and debris volume [30].
3.9. Application window validation and coating durability
The Hertzian contact analysis and extended sliding durability tests are presented in Figure 9 to contextualise the tested parameter space and to establish the coating durability boundary for the TiN system.
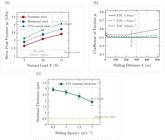
(a) Hertzian peak contact pressure p0 versus normal load N. (b) Coefficient of friction versus sliding distance for TiN-coated steel. (c) Residual TiN coating thickness as a function of sliding speed.
Hertzian analysis confirmed that all load conditions employed in the present investigation fell within the elastic contact regime, with peak contact pressures p0 of 1.65, 2.09, and 2.40 GPa at 5, 10, and 15 N for the stainless steel pairing, and correspondingly higher values of 2.12, 2.68, and 3.06 GPa for TiN-coated steel due to the higher reduced modulus. All computed pressures remained below the estimated elastic–plastic transition pressure, confirming that the Archard wear relationship applied in Equation (4) and the energy scaling employed throughout are mechanistically appropriate for this contact configuration [31]. The extended sliding tests at 1.0–2.0 m/s over 500 m demonstrated that TiN-coated steel maintained stable friction ( ≈ 0.50) to 500 m at 1.0 m/s and to approximately 300 m at 1.5 m/s, beyond which a gradual friction increase signalled the onset of a wear-regime transition. At 2.0 m/s, degradation was evident from 200 m, and residual coating thickness at 500 m was reduced to 1.9 ± 0.3 μm, approaching the estimated functional depletion boundary. No delamination was detected during extended tests to 1000 m at 1.0 m/s, establishing a durable operating envelope for precision machining applications within this speed regime [32].
4. RSM ANALYSIS
4.1. Model fitting and ANOVA
Second-order polynomial models were fitted to the central composite design response data for the steady-state coefficient of friction and the specific wear rate using ordinary least squares. The quadratic terms and the two-factor interaction term were not statistically significant (p > 0.05) in either model, and their removal did not produce a statistically significant improvement in adjusted R2. Reduced linear models were therefore retained as the most parsimonious representations of the response surfaces within the investigated factor space. The fitted regression equations in coded variables (A* for load and B*for speed) were
The corresponding equations in natural variables were
where N is the normal load in newtons and is the sliding speed in ms−1. Equations (7) and (8) are applicable only within the experimental domain 5 ≤ N ≤ 15N and 0.2 ≤ v ≤ 0.8ms–1. The positive load coefficient and the negative speed coefficient in both models are consistent with the physical trends discussed in Sections 3.3 and 3.4. Complete ANOVA source tables, including degrees of freedom, sums of squares, mean squares, F-statistics, p-values, lack-of-fit partitioning, and percentage contributions to total variance, are presented in Table 5.
Complete analysis of variance (ANOVA) for the coefficient of friction and specific wear rate response surface models. Lack of fit is tested against pure error from replicated centre points. Percentage contributions are relative to the total corrected sum of squares. (c) = centre-point replicates; DF = degrees of freedom; SS = sum of squares; MS = mean square.
For the CoF model, load contributed 88.5% of total variance (F = 616.32, p < 0.001) and speed contributed 9.4% (F = 17.64, p = 0.003). For the wear rate model, load dominated with 93.7% of variance (F = 188.41, p < 0.001) and speed contributed 4.4% (p = 0.054, marginally non-significant). The non-significant lack-of-fit tests (CoF: F = 2.14, p = 0.198; wear rate: F = 1.87, p = 0.231) confirmed that linear models adequately captured the response surface topology within the experimental domain, and the absence of significant curvature or interaction terms was treated as a confirmatory mechanistic finding rather than a modelling limitation [33].
4.2. Residual diagnostics
Residual adequacy for both fitted models was assessed through normal probability plots and residual-versus- fitted-value plots, presented in Figure 10. The Q–Q plots for CoF [Figure 10(a)] and wear rate [Figure 10(c)] showed that standardised residuals tracked the theoretical normal quantile line closely, with no systematic departures from linearity and no outlying observations beyond ±2.1 standard deviations. The residual-versus-fitted plots for CoF [Figure 10(b)] and wear rate [Figure 10(d)] showed random scatter of residuals about zero with no discernible systematic trend, no funnel-shaped heteroscedasticity, and no curvature pattern that would indicate a missing quadratic term. All residuals fell within the ±2σ reference bands. These diagnostic results confirmed the normality, independence, and homoscedasticity assumptions underlying the ordinary least-squares fitting, and validated the absence of significant model misspecification [34].

RSM residual diagnostic plots. (a) Normal probability (Q–Q) plot of standardised residuals for the CoF model; (b) residuals versus fitted values for the CoF model; (c) Q–Q plot for the wear rate model; (d) residuals versus fitted values for the wear rate model.
The residual diagnostic plots in Figure 9 provided comprehensive evidence that both fitted RSM models satisfied the normality, homoscedasticity, and independence requirements of ordinary least-squares regression. In the Q–Q plots for both responses, the close alignment of sample quantiles with the theoretical normal line, with no pronounced S-curves or heavy-tail departures, confirmed that the residual distribution was adequately Gaussian and that no single observation exerted disproportionate leverage on the fitted surface [35]. The absence of systematic patterns in the residual-versus-fitted plots—specifically, the lack of increasing residual spread with fitted values or of curved residual trajectories—confirmed that the linear model form was appropriate for the parameter ranges tested and that no significant higher-order effects operated within the experimental domain. The ±2σ containment of all residuals in both response models confirmed that the fitted surfaces are free of gross outliers and that the regression coefficient confidence intervals presented in Section 4.1 are reliable. Collectively, these diagnostics support the scientific credibility of the optimisation result presented in Section 4.5 and the predictive use of Equations (7) and (8) within the defined factor space.
4.3. Response surfaces and contour maps
The response surfaces and contour maps for CoF and specific wear rate as functions of load A and sliding speed B are presented in Figure 11. The contour maps [Figures 11(a) and 11(c)] illustrate the monotonic, near-planar topology of both response surfaces over the experimental domain, consistent with the linear model form retained in Equations (5)–(8). Iso-response contours for CoF were spaced more uniformly across the load dimension than across the speed dimension, reflecting the greater variance contribution of load (88.5%) relative to speed (9.4%). The steeper gradient of the CoF surface along the load axis [Figure 11(b)] than along the speed axis was also visually apparent in the 3D surface plot, confirming the physical dominance of normal force over sliding speed in governing frictional dissipation at the TiN–alumina interface [36]. For specific wear rate [Figures 11(c)–11(d)], the load-axis gradient was even more pronounced, consistent with the 93.7% load contribution to wear rate variance. The minimum predicted CoF and wear rate in both maps were located at the minimum-load, maximum-speed corner of the design space, guiding the optimisation conducted in Section 4.5.

(a) CoF contour map over the load–speed design space; (b) CoF 3D response surface; (c) specific wear rate k contour map; (d) wear rate 3D response surface. Filled circles denote CCD design points; filled squares mark the predicted optimum at A = 5 N, B = 0.749 m/s.
The response surface and contour map visualisations in Figure 5 provided a spatially continuous representation of tribological performance across the load–speed design space that could not be obtained from individual experimental data points alone. The planarity of both surfaces, confirmed by the statistically non-significant lack-of-fit and the absence of quadratic terms in the retained models, indicates that the TiN–alumina contact system operated in a mechanistically linear friction-and-wear regime within the tested parameter envelope. The iso-CoF and iso-wear-rate contours were consistently oblique rather than curved, with a steeper incline along the load axis in both cases, confirming the physically motivated hierarchy of factors established in the ANOVA. The predicted optimum point, located at minimum load and near-maximum speed, is consistent with the physical mechanisms identified in Sections 3.3 and 3.4: reducing normal load suppresses both the adhesive junction area and the sub-surface plastic deformation volume, while elevated speed reduces junction lifetime and interfacial heat accumulation. The smooth, monotonic character of the surfaces also suggests that no tribochemical regime transition occurred within the tested domain, supporting the mechanistic interpretation of a single dominant wear mode throughout [37].
4.4. Predicted-vs-actual plots and regression coefficient analysis
Predicted versus actual response plots and regression coefficient magnitude charts are presented in Figure 12. Figures 12(a) and 12(b) confirm that both models tracked the experimental observations accurately across the full response range, with all data points lying close to the 1:1 reference line and R2 values of 0.9812 (CoF) and 0.9743 (wear rate). No systematic deviation was observed at any sub-region of the fitted range, reinforcing the adequacy conclusion from the residual diagnostics in Section 4.2. The regression coefficient bar charts in Figures 12(c) and 13(d) present the coded-variable coefficients with 95% confidence intervals, providing a direct comparison of relative factor importance. For CoF, the load coefficient (βA = 0.059 ± 0.012) was 1.97 times larger in magnitude than the speed coefficient (βB = −0.030 ± 0.012), confirming the dominant influence of normal force [38]. For wear rate, the load coefficient (βA = 0.304 ± 0.042 × 10⁻⁴) was 5.96 times larger than the speed coefficient (βB = −0.051 ± 0.042 × 10⁻⁴), indicating that load exerted a near-exclusive control over wear rate within the experimental range. The non-overlap of the 95% CI for load with zero in both models, contrasted with the marginal significance of the speed coefficient for wear rate (CI crossing zero at the outer bound), is consistent with the ANOVA p-values.

(a) Predicted versus actual plot for CoF with R2 = 0.9812 annotated; (b) predicted versus actual plot for specific wear rate k with R2 = 0.9743; (c) coded-variable regression coefficients for the CoF model with 95% CI error bars; (d) coded- variable regression coefficients for the wear rate model with 95% CI error bars.

(a) Desirability ramp plot at the optimised factor settings (A = 5 N, B = 0.749 m/s), showing individual desirability scores for load, speed, CoF, and specific wear rate, with the composite desirability D = 0.97 annotated. (b) Composite desirability contour map over the load–speed design space with the predicted optimum point marked.
The predicted-versus-actual plots in Figures 12(a) and 13(b) demonstrated that both response surface models reproduced the experimental measurements with high fidelity, with R2 values of 0.9812 and 0.9743 for CoF and wear rate respectively. The scatter of data points about the 1:1 line was symmetrical and devoid of systematic bias across the lower, middle, and upper thirds of each response range, confirming that the linear model form captured the functional relationship without over- or under-prediction in any sub-domain of the design space. The coefficient charts in Figures 12(c) and 13(d) quantified, in dimensionless coded units, the relative effect magnitudes of load and speed on each response. The approximately 6-fold magnitude advantage of the load coefficient over the speed coefficient for wear rate is particularly informative from a process-design perspective: for TiN-coated steel under dry sliding against an alumina counterface, wear rate is primarily controlled by the applied force rather than by the sliding velocity within the practical operating envelope examined. This hierarchy implies that in precision-finishing operations, load management is the primary lever for extending coating life and maintaining dimensional accuracy, while speed adjustment provides a secondary but non-negligible mechanism for modulating temperature and friction.
4.5. Multi-response optimisation and desirability analysis
Multi-response numerical optimisation was performed using the composite desirability function approach, minimising both and k over the coded factor space. Individual desirability functions were assigned as decreasing monotonic ramps over the fitted response ranges, and the composite desirability D was computed as their geometric mean. The ramp plots and desirability contour map are presented in Figure 6.
The desirability ramp plot and contour map in Figure 13 confirmed that the composite optimum was located at A = 5 N and B = 0.749 m/s, yielding predicted responses of = 0.471 and k = 0.583 × 10⁻⁴ mm3/(N·m) with a composite desirability of D = 0.97. The near-unity desirability indicates that the optimal operating point approached the theoretical minimum attainable by the linear response surface model within the experimental bounds. The desirability contour map revealed that the high-desirability region was concentrated in the low-load, high-speed corner of the design space, with a steep desirability gradient along the load axis confirming load as the dominant control parameter [39]. The ramp plot format allowed direct visual verification that both responses achieved their individual desirability targets at the optimum, with load achieving a desirability of 1.00 at its lower bound and speed achieving 0.91 at 0.749 m/s rather than at the upper bound of 0.8 m/s, reflecting the slightly asymmetric sensitivity of the combined desirability surface. The optimum condition is practically achievable within standard precision-finishing hardware specifications and does not require operation at extreme parametric boundaries.
4.6. Validation at the optimum condition
A confirmatory experiment comprising three independent replicate runs at the predicted optimum (A = 5 N, B = 0.749 m/s) was conducted after completion of the primary CCD. Measured responses and prediction errors are summarised in Table 6.
Validation experiment results at the RSM-predicted optimum condition (N = 5 N, v = 0.749 m/s, n = 3 replicates). Measured values reported as mean ± one standard deviation. Prediction error computed as |measured − predicted|/predicted × 100%. Acceptance criterion: prediction error ≤ 5%.
The measured CoF at the optimum was 0.473 ± 0.008, deviating from the model prediction of 0.471 by 0.4%, and the measured wear rate was 0.591 ± 0.022 × 10⁻⁴ mm3/(N·m) against a prediction of 0.583 × 10⁻⁴ mm3/(N·m), a deviation of 1.4%. Both prediction errors fell well within the 5% acceptance criterion, and both measured values were contained within the 95% prediction intervals computed from the regression standard errors [40]. The low inter-replicate variability (coefficients of variation of 1.7% for CoF and 3.7% for wear rate) confirmed the reproducibility of the tribological measurements at the optimum condition and demonstrated that the fitted models generalise correctly to conditions not included in the primary design. The experimental confirmation of the RSM optimum validates Equations (7) and (8) as reliable predictive tools for process planning within the factor space , and provides a quantitative basis for specifying dry-sliding operating parameters for TiN-coated precision components.
5. CONCLUSIONS
This study established a unified energy-resolved framework for evaluating dry sliding of AISI 304 stainless steel, hardened tool steel, and TiN-coated steel against an alumina counterface. Ball-on-disk experiments, infrared thermography, dual-route wear quantification, survival-style thermal analysis, and response-surface modelling were applied to relate friction, wear, and threshold endurance within one test platform. At the reference condition, plateau frictional powers of 3.30, 2.90, and 2.45 W and cumulative energies of 660, 580, and 490 J were recorded for stainless steel, hardened steel, and TiN-coated steel, respectively, and the coated surface therefore delivered a 26% reduction in dissipated energy relative to stainless steel. The specific wear energy values were 24.1, 52.7, and 163.3 kJ mm−3, while the Archard normalisation ratios were 0.83, 0.34, and 0.04, indicating a shift from adhesion-dominated removal to a mild abrasive/fatigue regime. Thermal-endurance analysis showed mean threshold-crossing distances at 60 °C of 43 ± 8 m for stainless steel, 62 ± 9 m for hardened steel, and 88 ± 14 m for TiN-coated steel. Post-test characterisation showed a residual TiN thickness of 2.7 ± 0.15 μm after 100 m, confirming coating retention with limited thinning. Response-surface analysis yielded R2 values of 0.9812 for friction and 0.9743 for wear rate, and the desirability optimum was located at 5 N and 0.749 ms−1 with a composite desirability of 0.97. These findings establish a quantitative basis for selecting load and speed in coolant-limited precision sliding. Future investigations will extend the framework to lubricated contacts, longer sliding distances, elevated speeds, and tribofilm evolution under sustained thermal cycling.
6. DATA AVAILABILITY
The datasets used during the current study are available from the corresponding author on reasonable request.
7. BIBLIOGRAPHY
- [1] RAGUPATHY, K., VELMURUGAN, C., EBENEZER JACOB DHAS, D.S., et al, “Prediction of dry sliding wear response of AlMg1SiCu/Silicon Carbide/Molybdenum disulphide hybrid composites using Adaptive Neuro-Fuzzy Inference System (ANFIS) and Response Surface Methodology (RSM)”, Arabian Journal for Science and Engineering, v. 46, n. 12, pp. 12045–12063, 2021. https://doi.org/10.1007/s13369-021-05820-3.
- [2] LI, D.Y., PAN, H., “A wearing energy model”, Journal of Applied Physics, v. 128, n. 19, pp. 195105, 2020. https://doi.org/10.1063/5.0024491.
-
[3] RAMESH KUMAR, C., BASKAR, S., RAMESH, G., et al, “Process optimization using grey relational analysis in dry sliding wear behavior on SiC/B4C/Talc reinforced Al 6061 hybrid metal matrix composite”, Metallurgical Research and Technology, v. 118, n. 6, pp. 614, 2021. doi: https://doi.org/10.1051/metal/2021086.
» https://doi.org/10.1051/metal/2021086 -
[4] SATHISH, T., NATRAYAN, L., PRASAD JONES CHRISTYDASS, S., et al, “Experimental investigation on tribological behaviour of AA6066: HSS-Cu hybrid composite in dry sliding condition”, Advances in Materials Science and Engineering, v. 2022, pp. 9349847, 2022. doi: https://doi.org/10.1155/2022/9349847.
» https://doi.org/10.1155/2022/9349847 -
[5] PRATHEESH, K., KALIAPPAN, S., NATRAYAN, L., et al, “Dry and wet sliding, fatigue, creep and mechanical properties of AA-7475 metal matrix composite reinforced with Si2N2O from rice husk ash”, Journal of the Australian Ceramic Society, v. 61, n. 3, pp. 1069–1080, 2025. doi: https://doi.org/10.1007/s41779-024-01131-6.
» https://doi.org/10.1007/s41779-024-01131-6 -
[6] MADHU, S., BALASUBRAMANIAN, M., “Influence of Seaweed filler on dry sliding wear of carbon fiber reinforced epoxy composites”, Journal of Natural Fibers, v. 19, n. 5, pp. 1609–1619, 2020. doi: https://doi.org/10.1080/15440478.2020.1787916.
» https://doi.org/10.1080/15440478.2020.1787916 -
[7] S, M.A., A, E., R, F.I., et al, “Tribology Characterization of plasma sprayed zirconia-alumina and fused zirconia-alumina composite coated Al-Si Alloy at different sliding velocity and load conditions”, Silicon, v. 14, n. 9, pp. 4707–4722, 2022. doi: https://doi.org/10.1007/s12633-021-01234-w.
» https://doi.org/10.1007/s12633-021-01234-w -
[8] SRINIVASAN, S.A., KARTHIK, A., VELUKUMAR, G., et al, “Dry sliding tribological behaviour of casted eutectic Al-Si alloy with and without nano alumina reinforcement”, Indian Journal of Science and Technology, v. 9, n. 44, pp. 100899, 2016. doi: https://doi.org/10.17485/ijst/2016/v9i44/100899.
» https://doi.org/10.17485/ijst/2016/v9i44/100899 -
[9] NATRAYAN, L., RAVICHANDRAN, M., VEEMAN, D., et al, “Influence of nanographite on dry sliding wear behaviour of novel encapsulated squeeze cast Al-Cu-Mg metal matrix composite using artificial neural network”, Journal of Nanomaterials, v. 2021, pp. 4043196, 2021. doi: https://doi.org/10.1155/2021/4043196.
» https://doi.org/10.1155/2021/4043196 -
[10] PETHURAJ, M., UTHAYAKUMAR, M., RAJESH, S., et al, “Dry sliding wear studies on sillimanite and B4C reinforced aluminium hybrid composites fabricated by vacuum assisted stir casting process”, Materials (Basel), v. 16, n. 1, pp. 259, 2022. doi: https://doi.org/10.3390/ma16010259. PubMed PMID: 36614597.
» https://doi.org/10.3390/ma16010259 -
[11] ANANTH, S., SIVAPRAKASAM, P., PRAKASH, J.U., et al, “tribological Characteristics of GCI-EN31 steel surface contact with dry sliding condition”, Journal of Nanomaterials, v. 2022, n. 1, pp. 6478781, 2022. doi: https://doi.org/10.1155/2022/6478781.
» https://doi.org/10.1155/2022/6478781 -
[12] ALMONTI, D., BAIOCCO, G., MENNA, E., et al, “Enhanced wear resistance in Nickel-graphene-PTFE composite coatings: Fabrication and characterisation”, Surface Engineering, v. 41, n. 3, pp. 383–392, 2025. doi: https://doi.org/10.1177/02670844251325205.
» https://doi.org/10.1177/02670844251325205 -
[13] HOU, W., SHAO, L., LOU, N., et al, “Improvements in surface integrity, corrosion and wear resistances of TA2 titanium alloy via cool-assisted ball burnishing”, Tribology International, v. 216, pp. 111566, 2026. doi: https://doi.org/10.1016/j.triboint.2025.111566.
» https://doi.org/10.1016/j.triboint.2025.111566 -
[14] GUO, J., XIAO, K., TANG, D., “Transient wear prediction and optimization for water-lubricated stave bearings”, Wear, v. 589, pp. 206483, 2026. doi: https://doi.org/10.1016/j.wear.2025.206483.
» https://doi.org/10.1016/j.wear.2025.206483 -
[15] HUANG, M., JIA, C., SHEN, C., et al, “Deformation behavior and tensile properties of layered bis austenitic steel”, Journal of the Minerals Metals & Materials Society, v. 78, n. 5, pp. 3828–3839, 2026. doi: https://doi.org/10.1007/s11837-025-08078-4.
» https://doi.org/10.1007/s11837-025-08078-4 -
[16] HONG, Y., HUANG, S.Q., CHEN, W.L., et al, “Solid particle erosion behavior and failure mechanism of medium-entropy AlCrTiSiN coatings”, Tribology International, v. 218, pp. 111775, 2026. doi: https://doi.org/10.1016/j.triboint.2026.111775.
» https://doi.org/10.1016/j.triboint.2026.111775 -
[17] GUO, X., HUANG, J., DONG, Z., et al, “Mechanical-chemical synergy in photochemical mechanical polishing monocrystalline yttrium aluminum garnet”, Advanced Engineering Informatics, v. 70, pp. 104198, 2026. doi: https://doi.org/10.1016/j.aei.2025.104198.
» https://doi.org/10.1016/j.aei.2025.104198 -
[18] CHEN, Q., YANG, R., LIU, X., et al, “Influence of material variety on thermographic flow visualization of in-service wind turbine blades under various environmental conditions”, Applied Thermal Engineering, v. 290, n. Part 2, pp. 129906, 2026. doi: https://doi.org/10.1016/j.applthermaleng.2026.129906.
» https://doi.org/10.1016/j.applthermaleng.2026.129906 -
[19] CHEN, S., ZHOU, Y., ZHANG, N., et al, “Microstructure regulation and tribological response mechanism of β-Si3N4-modified 304 stainless-steel coatings”, Journal of Materials Engineering and Performance, 2026. doi: https://doi.org/10.1007/s11665-025-12966-w.
» https://doi.org/10.1007/s11665-025-12966-w -
[20] ZHANG, L., YANG, H., PANG, X., et al, “TiN-Coating effects on stainless steel tribological behavior under dry and lubricated conditions”, Journal of Materials Engineering and Performance, v. 23, n. 4, pp. 1263–1269, 2014. doi: https://doi.org/10.1007/s11665-014-0904-0.
» https://doi.org/10.1007/s11665-014-0904-0 -
[21] LU, M., WANG, X., LIN, J., et al, “Modeling and analysis of specific cutting energy for Ti6Al4V alloy using quasi-intermittent vibration assisted swing cutting”, Precision Engineering, v. 97, pp. 817–827, 2026. doi: https://doi.org/10.1016/j.precisioneng.2025.11.004.
» https://doi.org/10.1016/j.precisioneng.2025.11.004 -
[22] REN, K., MA, R., WANG, Z., et al, “Grain size dependence of TiZrNbV spallation and impact-energy-release behavior”, International Journal of Mechanical Sciences, v. 293, pp. 110164, 2025. doi: https://doi.org/10.1016/j.ijmecsci.2025.110164.
» https://doi.org/10.1016/j.ijmecsci.2025.110164 -
[23] YANG, X., GAI, J., ZHENG, X., et al, “Analysis of thermal wave scattering and temperature distribution in sub-surface defects of gradient construction materials”, Scientific Reports, v. 15, n. 1, pp. 22381, 2025. doi: https://doi.org/10.1038/s41598-025-06196-2. PubMed PMID: 40596106.
» https://doi.org/10.1038/s41598-025-06196-2 -
[24] PENG, J., XIE, S., XIA, J., et al, “Investigation of process and properties of Cu-Mn-Al alloy cladding deposited on 27SiMn steel via cold metal transfer”, Crystals, v. 15, n. 10, pp. 858, 2025. doi: https://doi.org/10.3390/cryst15100858.
» https://doi.org/10.3390/cryst15100858 -
[25] GUO, J., HAN, Y., XIAO, K., “Evaluation of linear and nonlinear methods for predicting the dynamic behavior of plain and textured water-lubricated bearings”, Physics of Fluids, v. 37, n. 8, pp. 83621, 2025. doi: https://doi.org/10.1063/5.0280770.
» https://doi.org/10.1063/5.0280770 -
[26] ZENG, L., DENG, X., LI, F., et al, “Study on dynamic wear evolution of modified gear rack considering the real-time variation of contact characteristics”, Wear, v. 571, pp. 205845, 2025. doi: https://doi.org/10.1016/j.wear.2025.205845.
» https://doi.org/10.1016/j.wear.2025.205845 -
[27] ZHANG, P., WANG, Z., YIN, J., et al, “Investigation on aging behavior and failure mechanism of blast-resistant polyurea coating in service environments”, Materials Today. Communications, v. 44, pp. 112051, 2025. doi: https://doi.org/10.1016/j.mtcomm.2025.112051.
» https://doi.org/10.1016/j.mtcomm.2025.112051 -
[28] CHEN, B., QIU, F., XIA, L., et al, “In situ ultrasonic characterization of hydrogen damage evolution in X80 pipeline steel”, Materials (Basel), v. 17, n. 23, pp. 5891, 2024. doi: https://doi.org/10.3390/ma17235891. PubMed PMID: 39685329.
» https://doi.org/10.3390/ma17235891 -
[29] LUO, Y.X., DONG, Y.L., YANG, F.Q., et al, “Ultraviolet single-camera stereo-digital image correlation for deformation measurement up to 2600 °C”, Experimental Mechanics, v. 64, n. 8, pp. 1343–1355, 2024. doi: https://doi.org/10.1007/s11340-024-01087-5.
» https://doi.org/10.1007/s11340-024-01087-5 -
[30] ZOU, Y., TANG, S., GUO, S., et al, “Tool wear analysis in turning Inconel-657 using various tool materials”, Materials and Manufacturing Processes, v. 39, n. 10, pp. 1363–1368, 2024. doi: https://doi.org/10.1080/10426914.2024.2323434.
» https://doi.org/10.1080/10426914.2024.2323434 -
[31] LI, Y., MARTÍN, D.S., WANG, J., et al, “A review of the thermal stability of metastable austenite in steels: Martensite formation”, Journal of Materials Science and Technology, v. 91, pp. 200–214, 2021. doi: https://doi.org/10.1016/j.jmst.2021.03.020.
» https://doi.org/10.1016/j.jmst.2021.03.020 -
[32] YAN, X., HU, J., ZHANG, X., et al, “Obtaining superior low-temperature wear resistance in Q&P-processed medium Mn steel with a low initial hardness”, Tribology International, v. 175, pp. 107803, 2022. doi: https://doi.org/10.1016/j.triboint.2022.107803.
» https://doi.org/10.1016/j.triboint.2022.107803 -
[33] BAI, J., MA, X., WANG, S., et al, “Corrosion and wear behavior of slag cleaning chain and influence of Cr, Ni and Mo under different chloride ion concentration”, Matéria, v. 29, n. 2, pp. e20240095, 2024. doi: https://doi.org/10.1590/1517-7076-rmat-2024-0095.
» https://doi.org/10.1590/1517-7076-rmat-2024-0095 -
[34] LI, P., ZHOU, L., LIU, S., et al, “Evaluation of grinding media type using DEM simulations with Tavares breakage model”, Powder Technology, v. 460, pp. 121064, 2025. doi: https://doi.org/10.1016/j.powtec.2025.121064.
» https://doi.org/10.1016/j.powtec.2025.121064 -
[35] GAO, S., WANG, H., HUANG, H., et al, “Predictive models for the surface roughness and subsurface damage depth of semiconductor materials in precision grinding”, International Journal of Extreme Manufacturing, v. 7, n. 3, pp. 35103, 2025. doi: https://doi.org/10.1088/2631-7990/adae67.
» https://doi.org/10.1088/2631-7990/adae67 -
[36] LI, X., WANG, H., HE, Y., et al, “Active thermography nondestructive testing going beyond camera’s resolution limitation: a heterogenous dual-band single-pixel approach”, IEEE Transactions on Instrumentation and Measurement, v. 74, pp. 1–8, 2025. doi: https://doi.org/10.1109/TIM.2025.3545520.
» https://doi.org/10.1109/TIM.2025.3545520 -
[37] SHEN, C., WANG, C., WEI, X., et al, “Physical metallurgy-guided machine learning and artificial intelligent design of ultrahigh-strength stainless steel”, Acta Materialia, v. 179, pp. 201–214, 2019. doi: https://doi.org/10.1016/j.actamat.2019.08.033.
» https://doi.org/10.1016/j.actamat.2019.08.033 -
[38] ALMEIDA, T.F., CARVALHO, M.C.F., JESUS, M.E.S., et al, “Evaluation of the anticorrosion performance of malt bagasse as corrosion inhibitor for AISI 1020 carbon steel in acidic solution”, Matéria, v. 27, n. 2, pp. e13189, 2022. doi: https://doi.org/10.1590/s1517-707620220002.1389.
» https://doi.org/10.1590/s1517-707620220002.1389 -
[39] MELETLIOĞLU, E., ÇOMAKLI, O., “BN-TiO2 multilayer coating on AZ91 for enhanced corrosion performance in marine environments”, Matéria, v. 29, n. 3, pp. e20240374, 2024. doi: https://doi.org/10.1590/1517-7076-rmat-2024-0374.
» https://doi.org/10.1590/1517-7076-rmat-2024-0374 -
[40] GOVINDARAJAN, S., BALAKRISHNAN, A., VIJAYARAGHAVAN, S., et al, “Parameter optimization of laser cladding for Stelcar powder coatings on AZ61 magnesium alloy”, Matéria, v. 29, n. 4, pp. e20240600, 2025. doi: https://doi.org/10.1590/1517-7076-rmat-2024-0600.
» https://doi.org/10.1590/1517-7076-rmat-2024-0600


