 Investigation on the mechanical properties of coated carbide ceramic inserts for EDM using Inconel 800
ABSTRACT
A mathematical model based on surface roughness and material rate reduction response variables was used to evaluate and predict die sinking electrical discharge machining (EDM) parameters like peak current and pulse active and inactive states. In this study, we examined our model’s ANOVA using p and f tests on Inconel 800 to enhance process characteristics based on their response to the surface method. The ANOVA results show that the maximum current value dominates MRR, followed by pulse active state and pulse inactive state. We use the Composite Desirability (CD) function to obtain the most favourable characteristics. During optimisation, the goal is to set upper and lower limits for MRR and surface roughness, respectively. The determination of the most favourable configuration for process variables is 15 kA, 17 μs, and 24 μs for maximum current, pulse active state, and pulse inactive state, respectively. At optimal parameters of highest MRR of 0.1423 mm3/min and lowest value for surface roughness is 1.8946 μm were predicted. Confirmation experiments show that the anticipated values are very closely matched with the findings from experiments with less than 5% error.
Keywords:
Die sinking EDM; Optimization; RSM; Central Composite Design; MRR; Ra
1. INTRODUCTION
Despite its recent popularity, electrical discharge machining (EDM) is one of numerous non-traditional machining processes. Prefer EDM because it produces stress-free parts, has a higher MRR with excellent dimensional accuracy, is an economical process, and can easily machine tough conductive materials [1]. The EDM process is readily available to machine intricate 3D complex shapes [2]. Moreover, modern industries are constantly striving to machine complex profiles in difficult-to-cut or highly conductive materials such as ceramic, metal matrix, and super alloys [3]. Nickel-based superalloy Inconel 800 is used in turbines, heat exchangers, furnaces, and aerocomponents because it has great properties, such as being strong at high temperatures, not cracking when exposed to chloride stress corrosion, and not rusting [4]. But the traditional machining of Inconel800 presents challenges because of its inherent features, including limited work hardening, low heat transfer coefficient, and high toughness [5]. The primary goal of machining strong alloys is to achieve maximum effectiveness and improved surface treatment, all while maintaining reasonable manufacturing costs. This can be achieved with high MRR, but doing so will result in a low surface finish [6]. As a result, several researchers have investigated methods for identifying optimal process parameters by employing appropriate optimisation procedures.
They studied Inconel 718’s die sinking EDM machining characteristics with a copper electrode [7]. They discovered that maximum current had a significant impact on tool wear rate, surface roughness, and MRR. Tool lift time and duty cycle were the least critical characteristics [8]. The response surface method examined the impact of EDM parameters on Inconel 718. The peak current had a significant influence on the MRR, with the pulse on time following closely behind [9]. Using an empirical mathematical model, the researchers evaluated the impact of die sinking EDM. The researchers discovered that the timing of the pulse and the magnitude of the peak current had an effect on the MRR [10]. Simultaneously, both the off and on time pulses have an impact on the surface roughness, known as Ra. The application entails using AISI 420 stainless steel in conjunction with a copper electrode inside a die-sink EDM apparatus. This study investigated MRR and electrode wear in relation to pulse time, gap voltage, and pulse current. The influencing characteristics were the ascending peak current, pulse on time, and gap voltage. Researchers investigated the EDM process parameters on Inconel 718 and 625 [11]. The primary features influencing the MRR and electrode wear rate are pulse on time and current. It is important to note, however, that the peak current is the primary factor contributing to MRR [12]. We employed the response surface approach optimisation technique to address the machining constraints of powdered EDM on Inconel 800. Influences such as tool material, pulse on time, discharge current, and powder particles. Factors such as pulse active time, tool material, and discharge current, among others, have an impact on MRR [13].
The EDM machining We examine the performance of EDM machining on various Inconel materials, such as 718 and 6. The researchers developed a comprehensive approach that incorporates an optimisation path, a satisfaction function, the Taguchi technique, and a fuzzy interface system [14]. The researchers used the response surface methodology to create a mathematical model of wire EDM performance on Inconel 625 [15]. We discovered that surface roughness altered the gap voltage and pulse on/off time. The investigation included creating a through hole in Inconel 625 material. The study revealed that the surface roughness of cylindrical holes exhibited an increase in response to the rise of the pulse on time [16]. The existing literature substantiates that several researchers have conducted studies on process variables on Inconel and other materials. The influence of process variables on Inconel 800 is still understudied [17]. As a result, the current investigation focuses on machining Inconel 800 material using a decease-tumbling EDM. The objective is to analyse the performance characteristics by changing process variables like peak or maximum current (I), pulse on time (Ton), and off time (Toff). The measured responses include MRR and surface roughness (Ra) [18]. We have implemented the Response Surface Methodology (RSM) optimisation method to define the ideal configuration of process characters for EDM. This approach aims to effectively reduce surface roughness while simultaneously increasing the MRR. We have devised a study using the Central Composite Design (CCD) methodology to achieve this objective [19].
2. MATERIALS AND METHODS
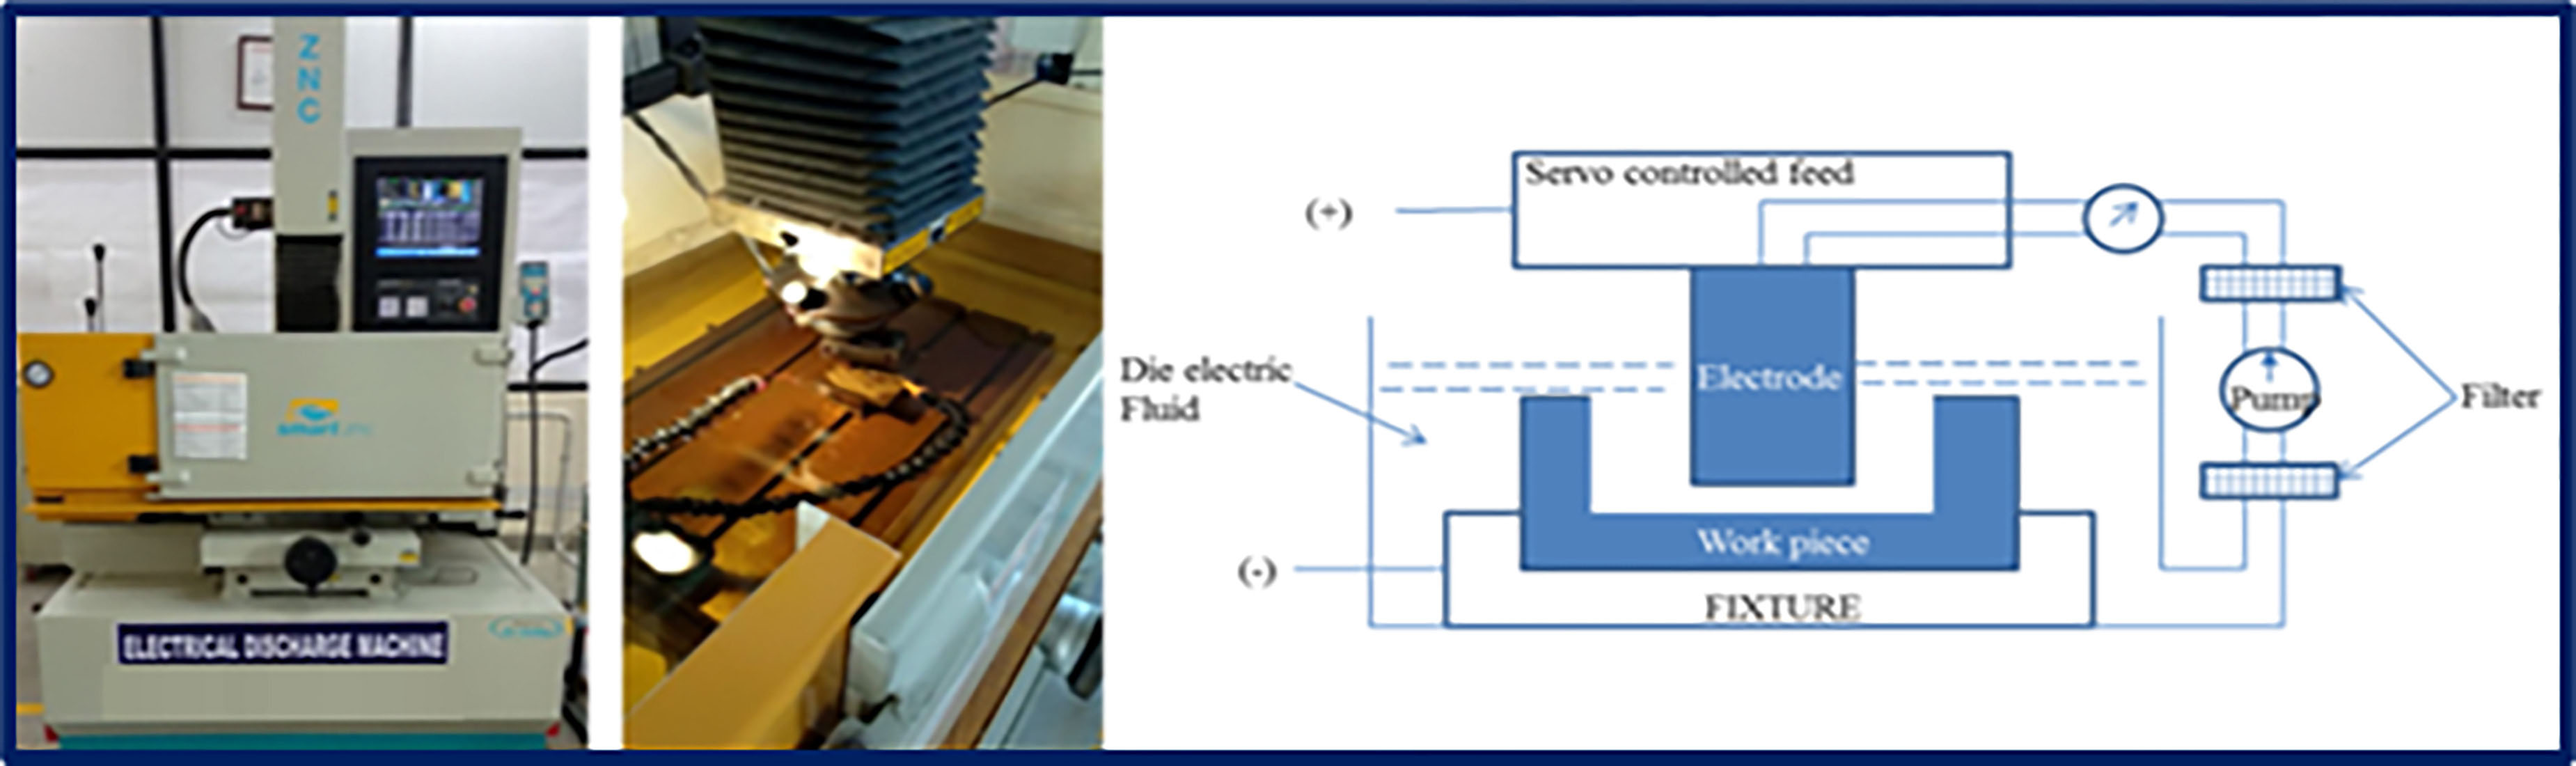
The process of machining occurs on Inconel 800 by the ZNC EDM machine shown in Figure 1A to examine how three distinct input inputs affect two outcome responses. The process utilizes an odourless, thermally resistant die electric fluid, DEF 92, which has excellent properties. We recirculate the EDM fluid after filtering the used oil. Each time, we complete the filtration process before recirculating the EDM fluid. We ensured the appropriate setting by conducting pilot tests prior to the experiments. Figures 1B and 1C, respectively, illustrate the machining of Inconel and the schematic diagram that depicts the EDM’s operational mechanism.
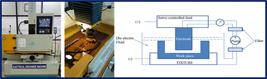
(A) Die sinking EDM machine (B) Machining of Inconel 800 (C) Schematic diagram of working of EDM machine.
We select the super alloy Inconel 800 for conducting experiments, and Table 1 displays the chemical structure of the selected substance. We select a brass alloy electrode material with face dimensions of 4 mm and 15 mm (b & l). We used a surface planner to plan the electrode’s surface before machining it on a rectangular flat plate.
2.1. Optimization technique
RSM is excellent for linking input factors to measured output responses [16,17,18]. Although there are various techniques for optimization, many researchers have found success by using the RSM since it is one of the most efficient methods. The variable Y that represents the answer is referred to as the dependent variable, while the values of x1, x2, etc. are known as the separate variables. All these parameters may be used to define Equation 1 in RSM
The expected variable is Ŷ, the result variable is Y, the error is ε, the function that responds is F, and the variables that are independent input parameters are x1, x2,… An Equation 2 first-order linear response model describes MRR and Ra (surface roughness) in this study.
Where, c0, c1, model coefficients to be calculated. First-order response model cannot demonstrate system nonlinearity. Therefore, a second-order equation (Eq. 3) may represent a non-linear function. This is due to the fact that the second order is able to accurately anticipate the responses.
The readings for c0, c1, etc. are derived from the data obtained via experimentation. To get the optimum match with the quadric model, the Central Composite Design (CCD) might be used. Cube surface, 2k factorial (k being the number of factors), star points or 2k axial points, and centre points make up CCD.
2.2. Process parameters and experimental design matrix
The independent input variables were selected as pulse on time (Ton), Pulse off time (TMoff) and maximum current (A) and outcome variables were selected as MRR and Ra. The specified input characters are explained in Table 2.
Table 3 provides an overview of the experimental design and the studies carefully developed using CCD; the total trials carried out are twenty. Moreover, this research employs a complete quadratic model with a 95% confidence interval (CI) to analyze the results. The p and f tests evaluated the significance of the model terms. The ANOVA test determines whether models are acceptable. At each stage, we validate the model’s appropriateness by deleting each inconsequential term one at a time using the backward elimination approach.
3. CHARACTERIZATIONS
3.1. ANOVA and percentage of contribution
3.2. Surface roughness
For any machined product, the quality of finishing is characterised by accurate dimensions and surface polish. Moreover, irregularities in surfaces have the potential to diminish an object’s value. Therefore, precise inspection must assist in assessing the surface roughness of the finished item. Several methods are available for investigating and predicting the surface roughness of machined products. The following is a list of some of the methods available: (i) Experimental investigation; (ii) Artificial Neural Networks (ANN); (iii) machining theory-based analytical models; (iv) based on DoE [ 20–22]. The current study employs an experimental design to investigate surface roughness.
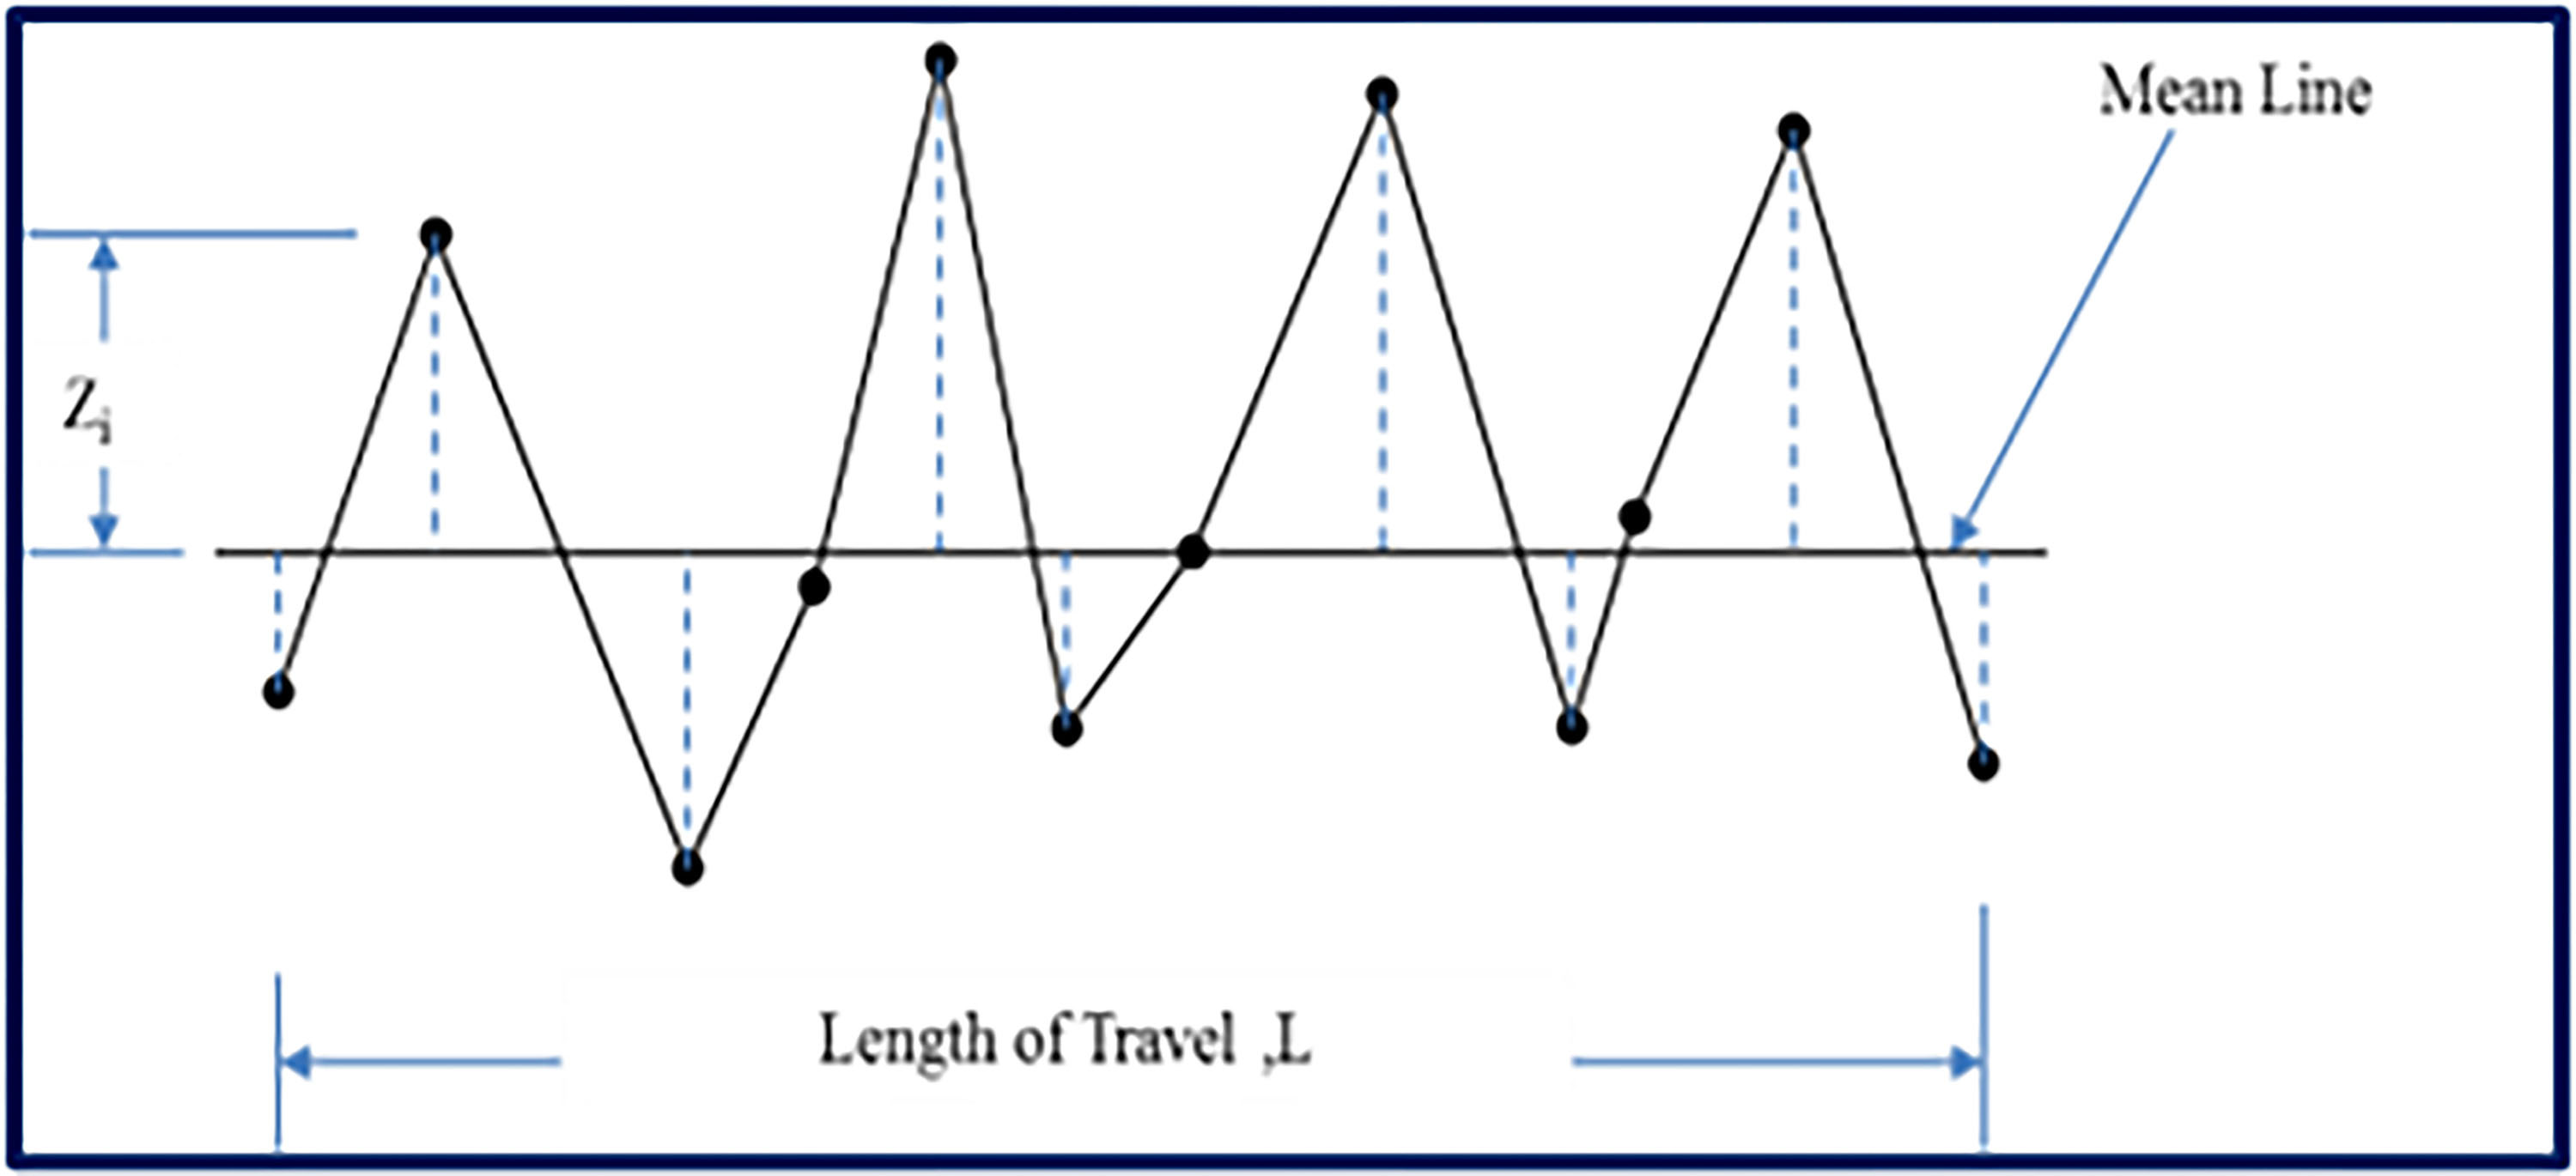
Generally, we can quantify surface roughness using three parameters: Rmax, Rt, and Ra. We adopt the surface roughness of average profiles (Ra) values in this work, as industries typically prefer Ra during controlled production processes. Figure 2 presents the schematic measurement of Ra. Equation 5 presents the general equation for the calculation of average surface roughness [23]. We considered the surface roughness tester model SJ210 when determining the abrasiveness of the surface. The length cut-off of the tester is 0.79 millimetres, the stroke length of the stylus was 4 millimetres, and the speed of the stylus was 0.26 millimetres per second. Three trials are taken for each trial, and the average of the values is given in Table 4.

Where, n = data points taken in numbers; Zi = Deviation of profile from mean line.
3.3. MRR – Material Removal Rate
During machining the calculated loss of work piece material in mm3 /min is known as MRR. Equation 6 is the formula to calculate MRR.The Inconel 800 work piece material is measured before machining and after machining using digital electronics balance machine.
Where,
Wp = Workpiece weight previous to machining in grams; Wf = Final workpiece weight next to machining in grams; ρw/p= Workpiece density in kg/m3; t = time of machining in seconds.
4. RESULTS AND DISCUSSION
4.1. Surface roughness
Table 4 describes the measured actual roughness records for all trials. Table 5 results from the ANOVA conducted on surface roughness, the maximum current is not significantly (p > 0.05), although the other model variables are significant. The fact that F’s value is 2.46, less than the tabulated F value of 8.89, indicates that the fit inadequacy is also inconsequential. Therefore, the second-order model is adequate, also conducted the significance test for the response’s surface roughness. Table 5 presents the results of an ANOVA on a simplified model that incorporates backward elimination for surface roughness. It is noticed that in the linear model except peak current, the remaining two independent variables, Ton and Toff are significant. Simultaneously, the square value of I * I demonstrates significance, while the remaining square terms prove insignificant, leading to their removal from Table 4. Similarly, in two-way interactions I × Toff, I × Ton and Ton × Toff are significant.
Model summary below Table 5 shows the results of S, R-Sq, and R-Sq (adj), R-Sq is one of the statistical measures utilised in order to locate the positive connection between the different independent variables and responses. Generally, a higher R-sq value indicates a higher fit between the actual data and the model. According to this research’s executive summary of the model for MRR indications, we see that the value of R-Sq (94.68%) is very close to unity. This indicates that the model accurately reflects the results of the experiments. Furthermore, adding a variable can improve the R-sq results of any given model. Therefore, only relying on R-sq data is not sufficient to identify the ideal regression model. Therefore, we also take into account the R-sq (adj) value to mitigate uncertainty, as the inclusion of redundant terms in the model reduces the R-sq (adj) amount18]. R2(adj) value for surface roughness is 91.23%, or 0.9123 (closer to unity). This confirms that the model in Table 5 maintains a fairly satisfactory relationship between the observed values and those projected.
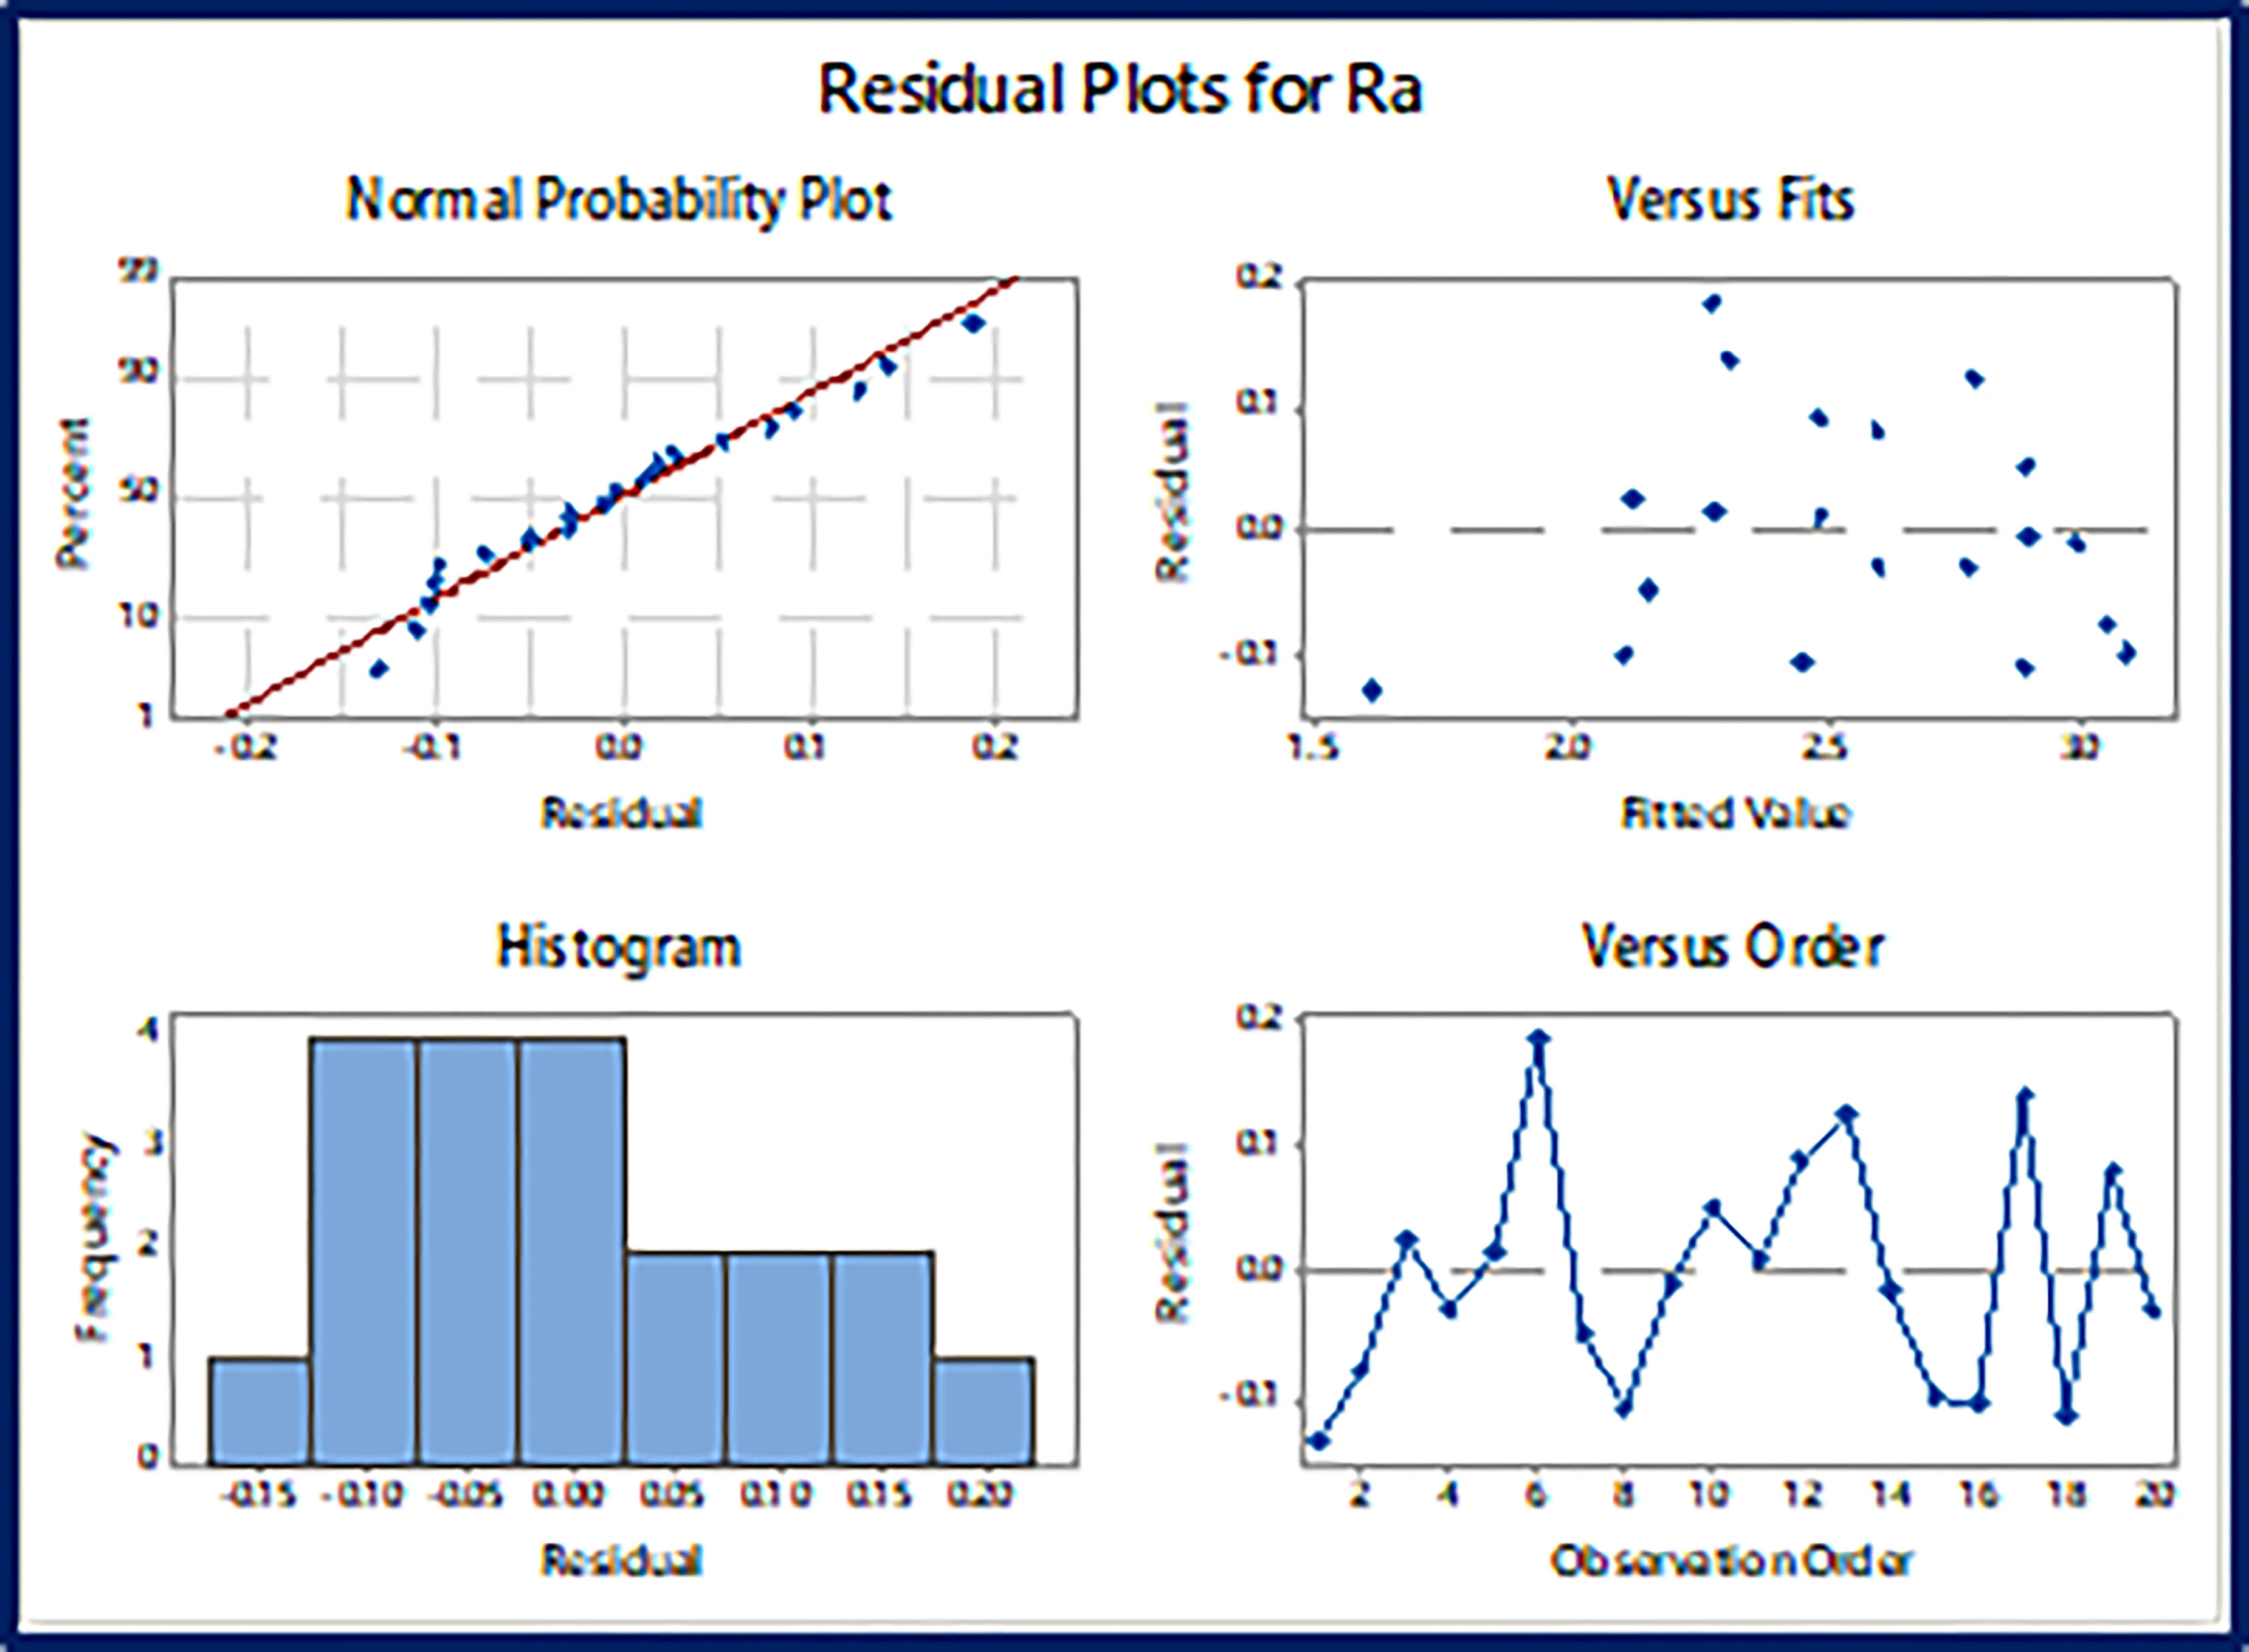
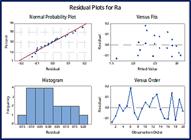
Moreover, from Table 5 in the linear model, the most significant independent parameter is Ton which contributes a maximum of 40%. The second significant parameter is Toff which contributes a percentage of 4%, and the least significant parameter is 0.01%. Therefore, we confirm that peak current bears minimal responsibility for surface roughness. However, we assume that peak current, which is 5.34% in square terms, is the most significant parameter. Also, with interaction terms, the percentages of contribution of I × Toff, I × Ton and Ton × Toff are 13.3, 3.75, and 4.9, respectively. The first plot in Figure 3 displays the normal probability chart, and the residuals align with the normal line.
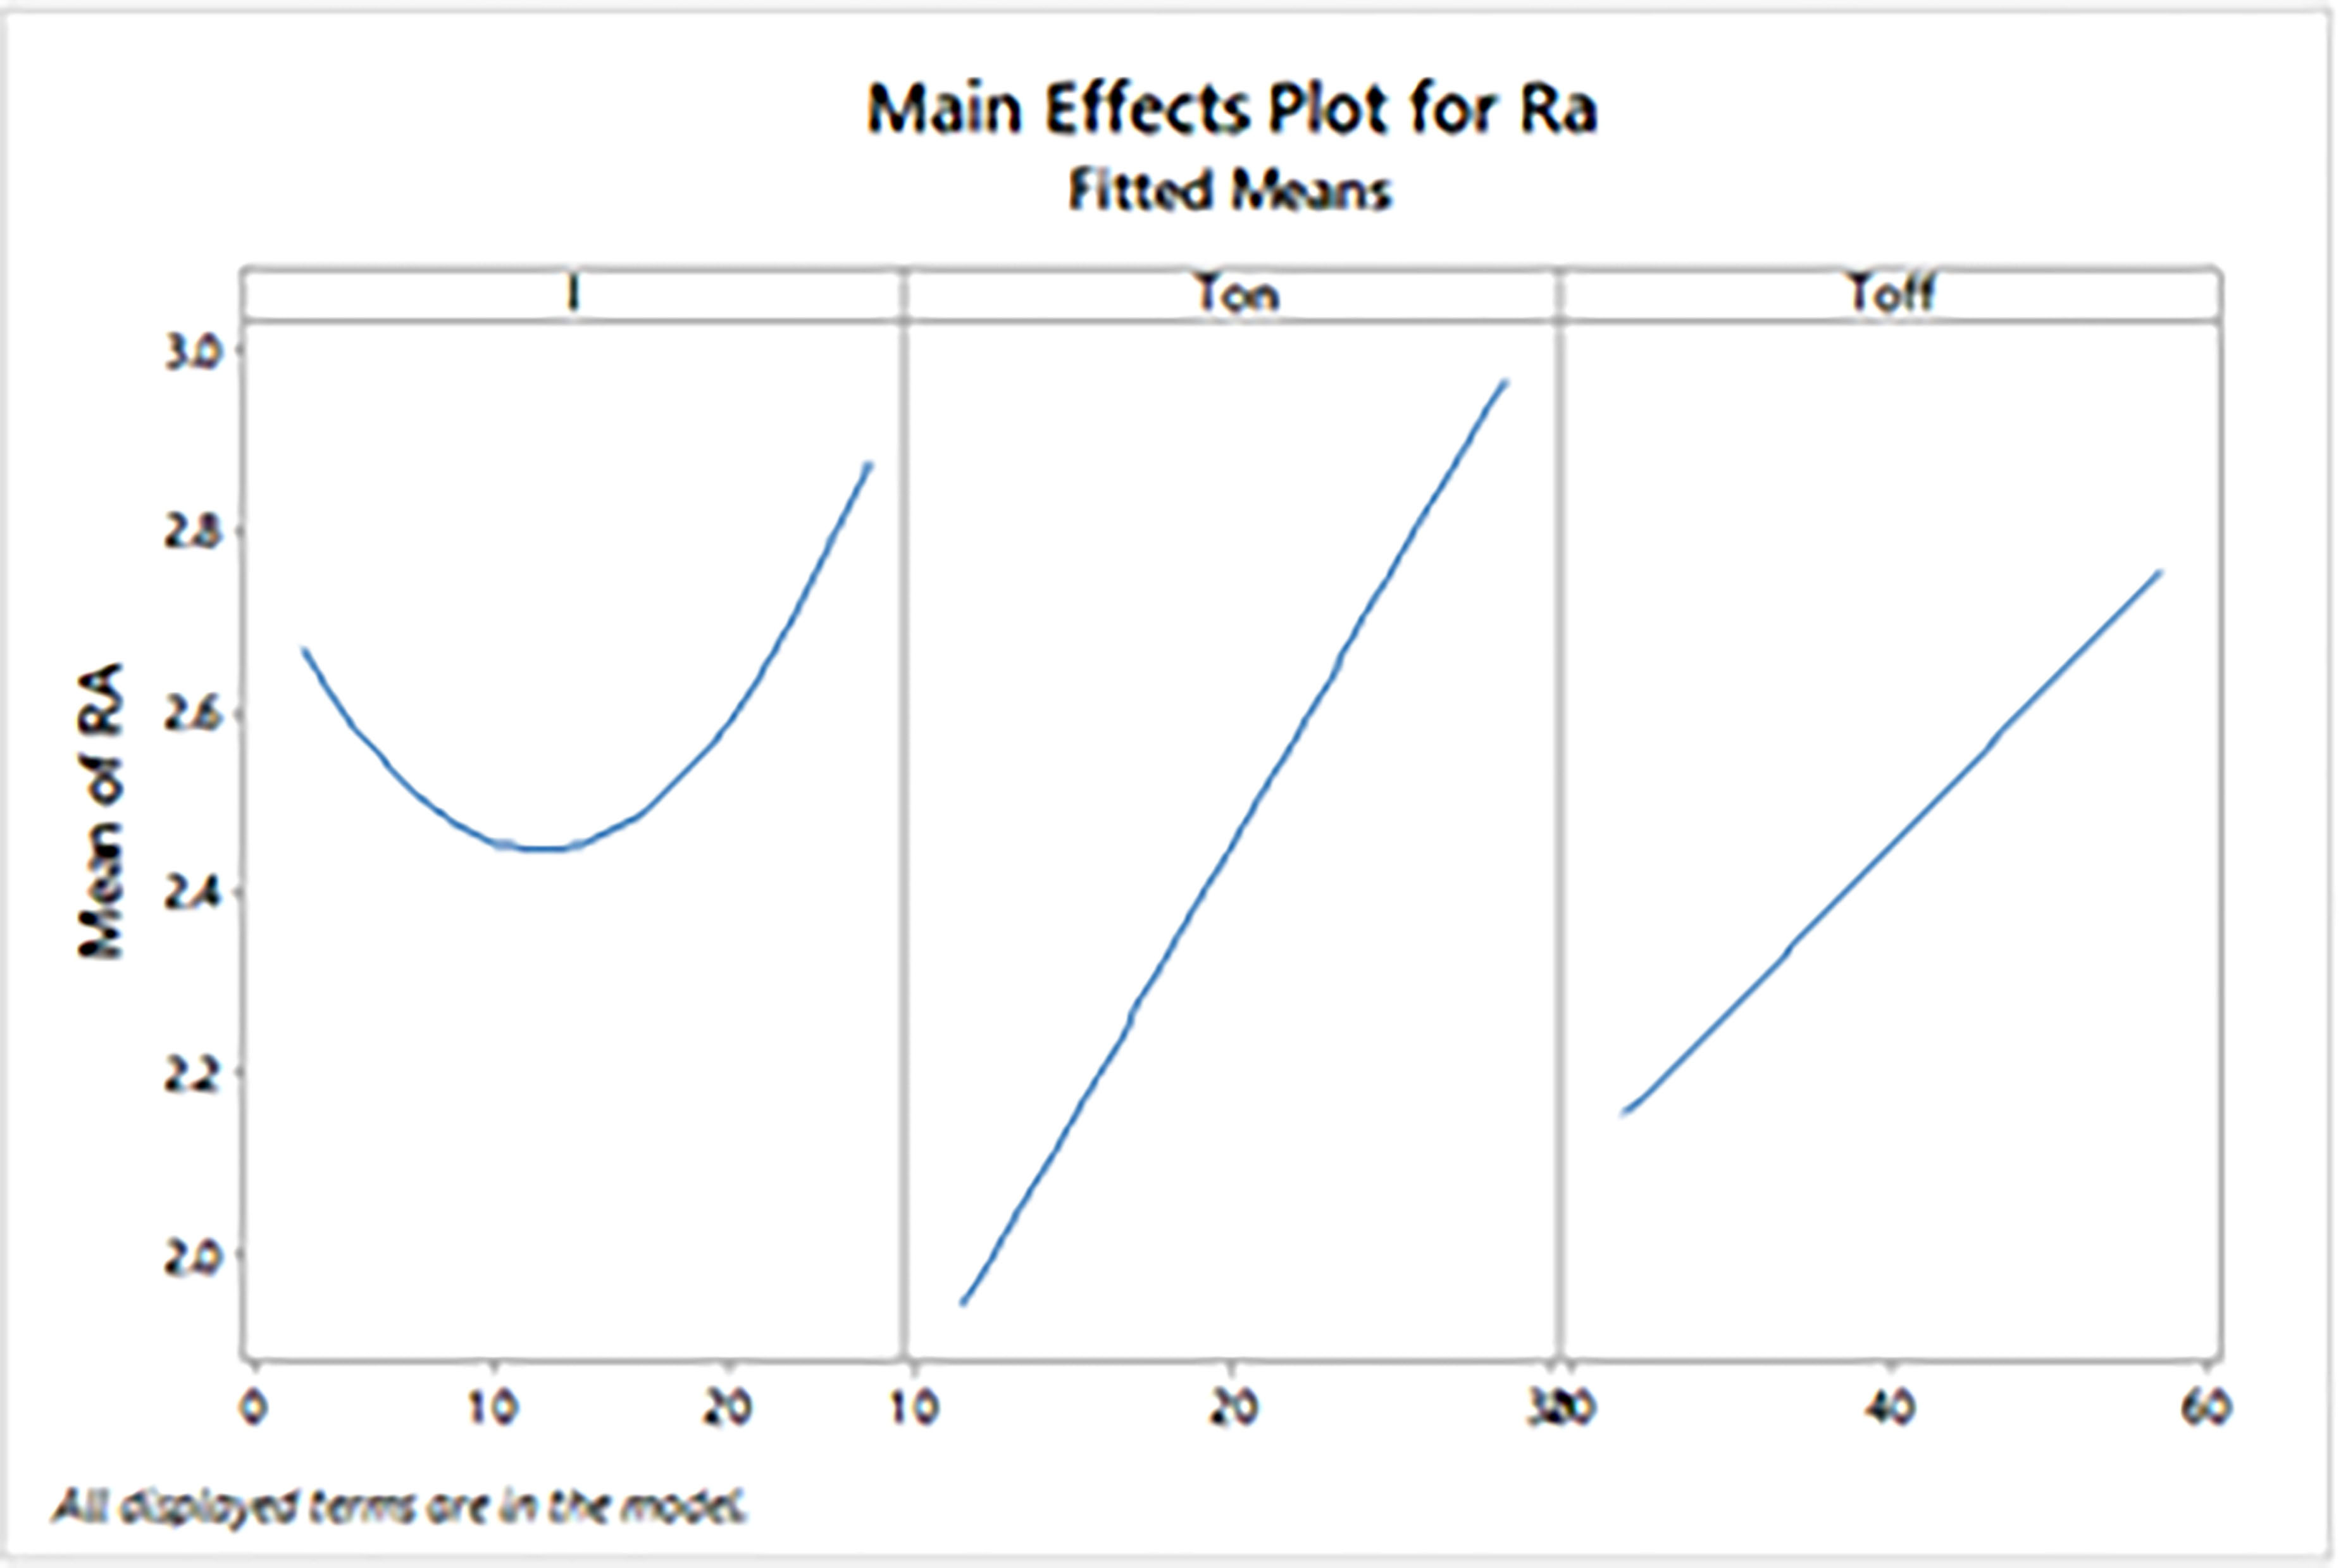
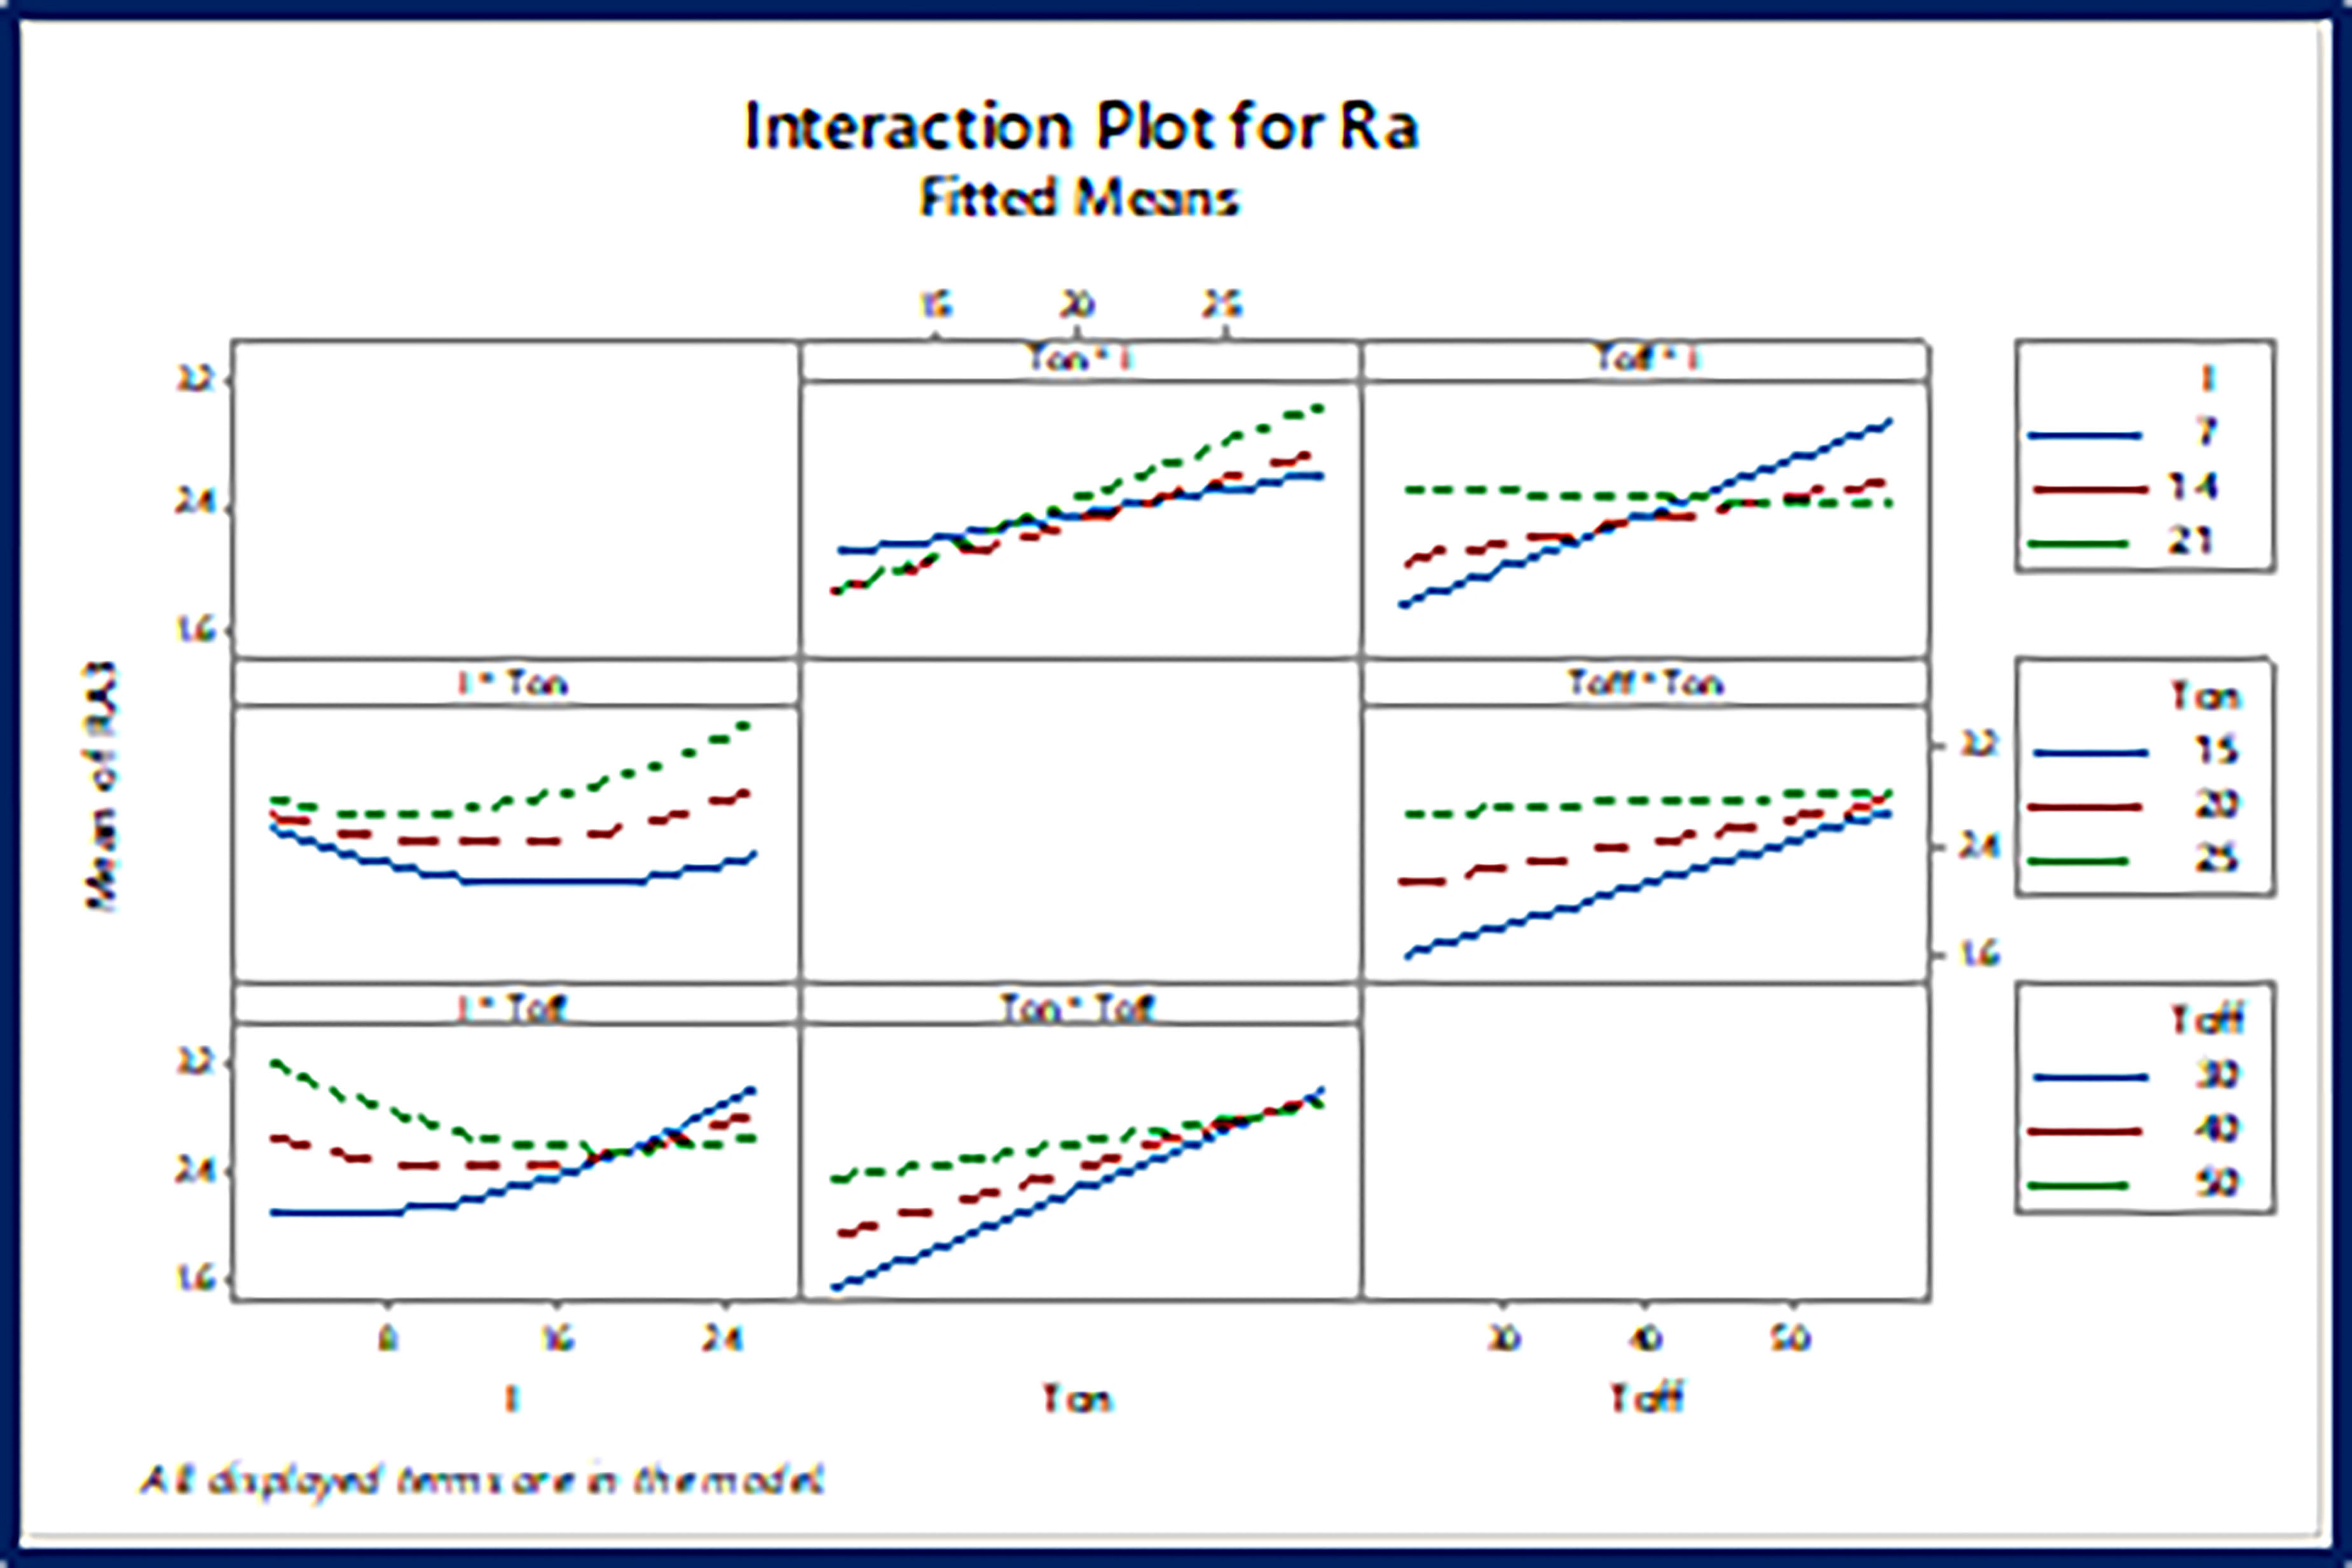
Main impacts and interactions Figures 4 and 5 provide an explanation for the Ra graph. Figures 4 and 5 demonstrate a decrease in Ra until it reaches the 14 kA peak current value, after which it begins to rise. The rise in welding current leads to the melting of more materials, potentially causing debris to adhere to the polished surface. Figure 4 reveals that pulse on/off time increases surface roughness.
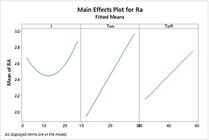
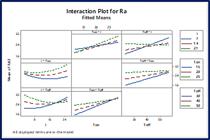
Increased pulse off time increased surface roughness, but constant pulse on time at 20 μs from Ton × Toff decreased Ra. Surface roughness positively correlates with pulse on/off time. Figure 5 explains that among all three parameters, pulse on and off time are effective constraints because a minute change in these parameters resulted in large variation in surface roughness.
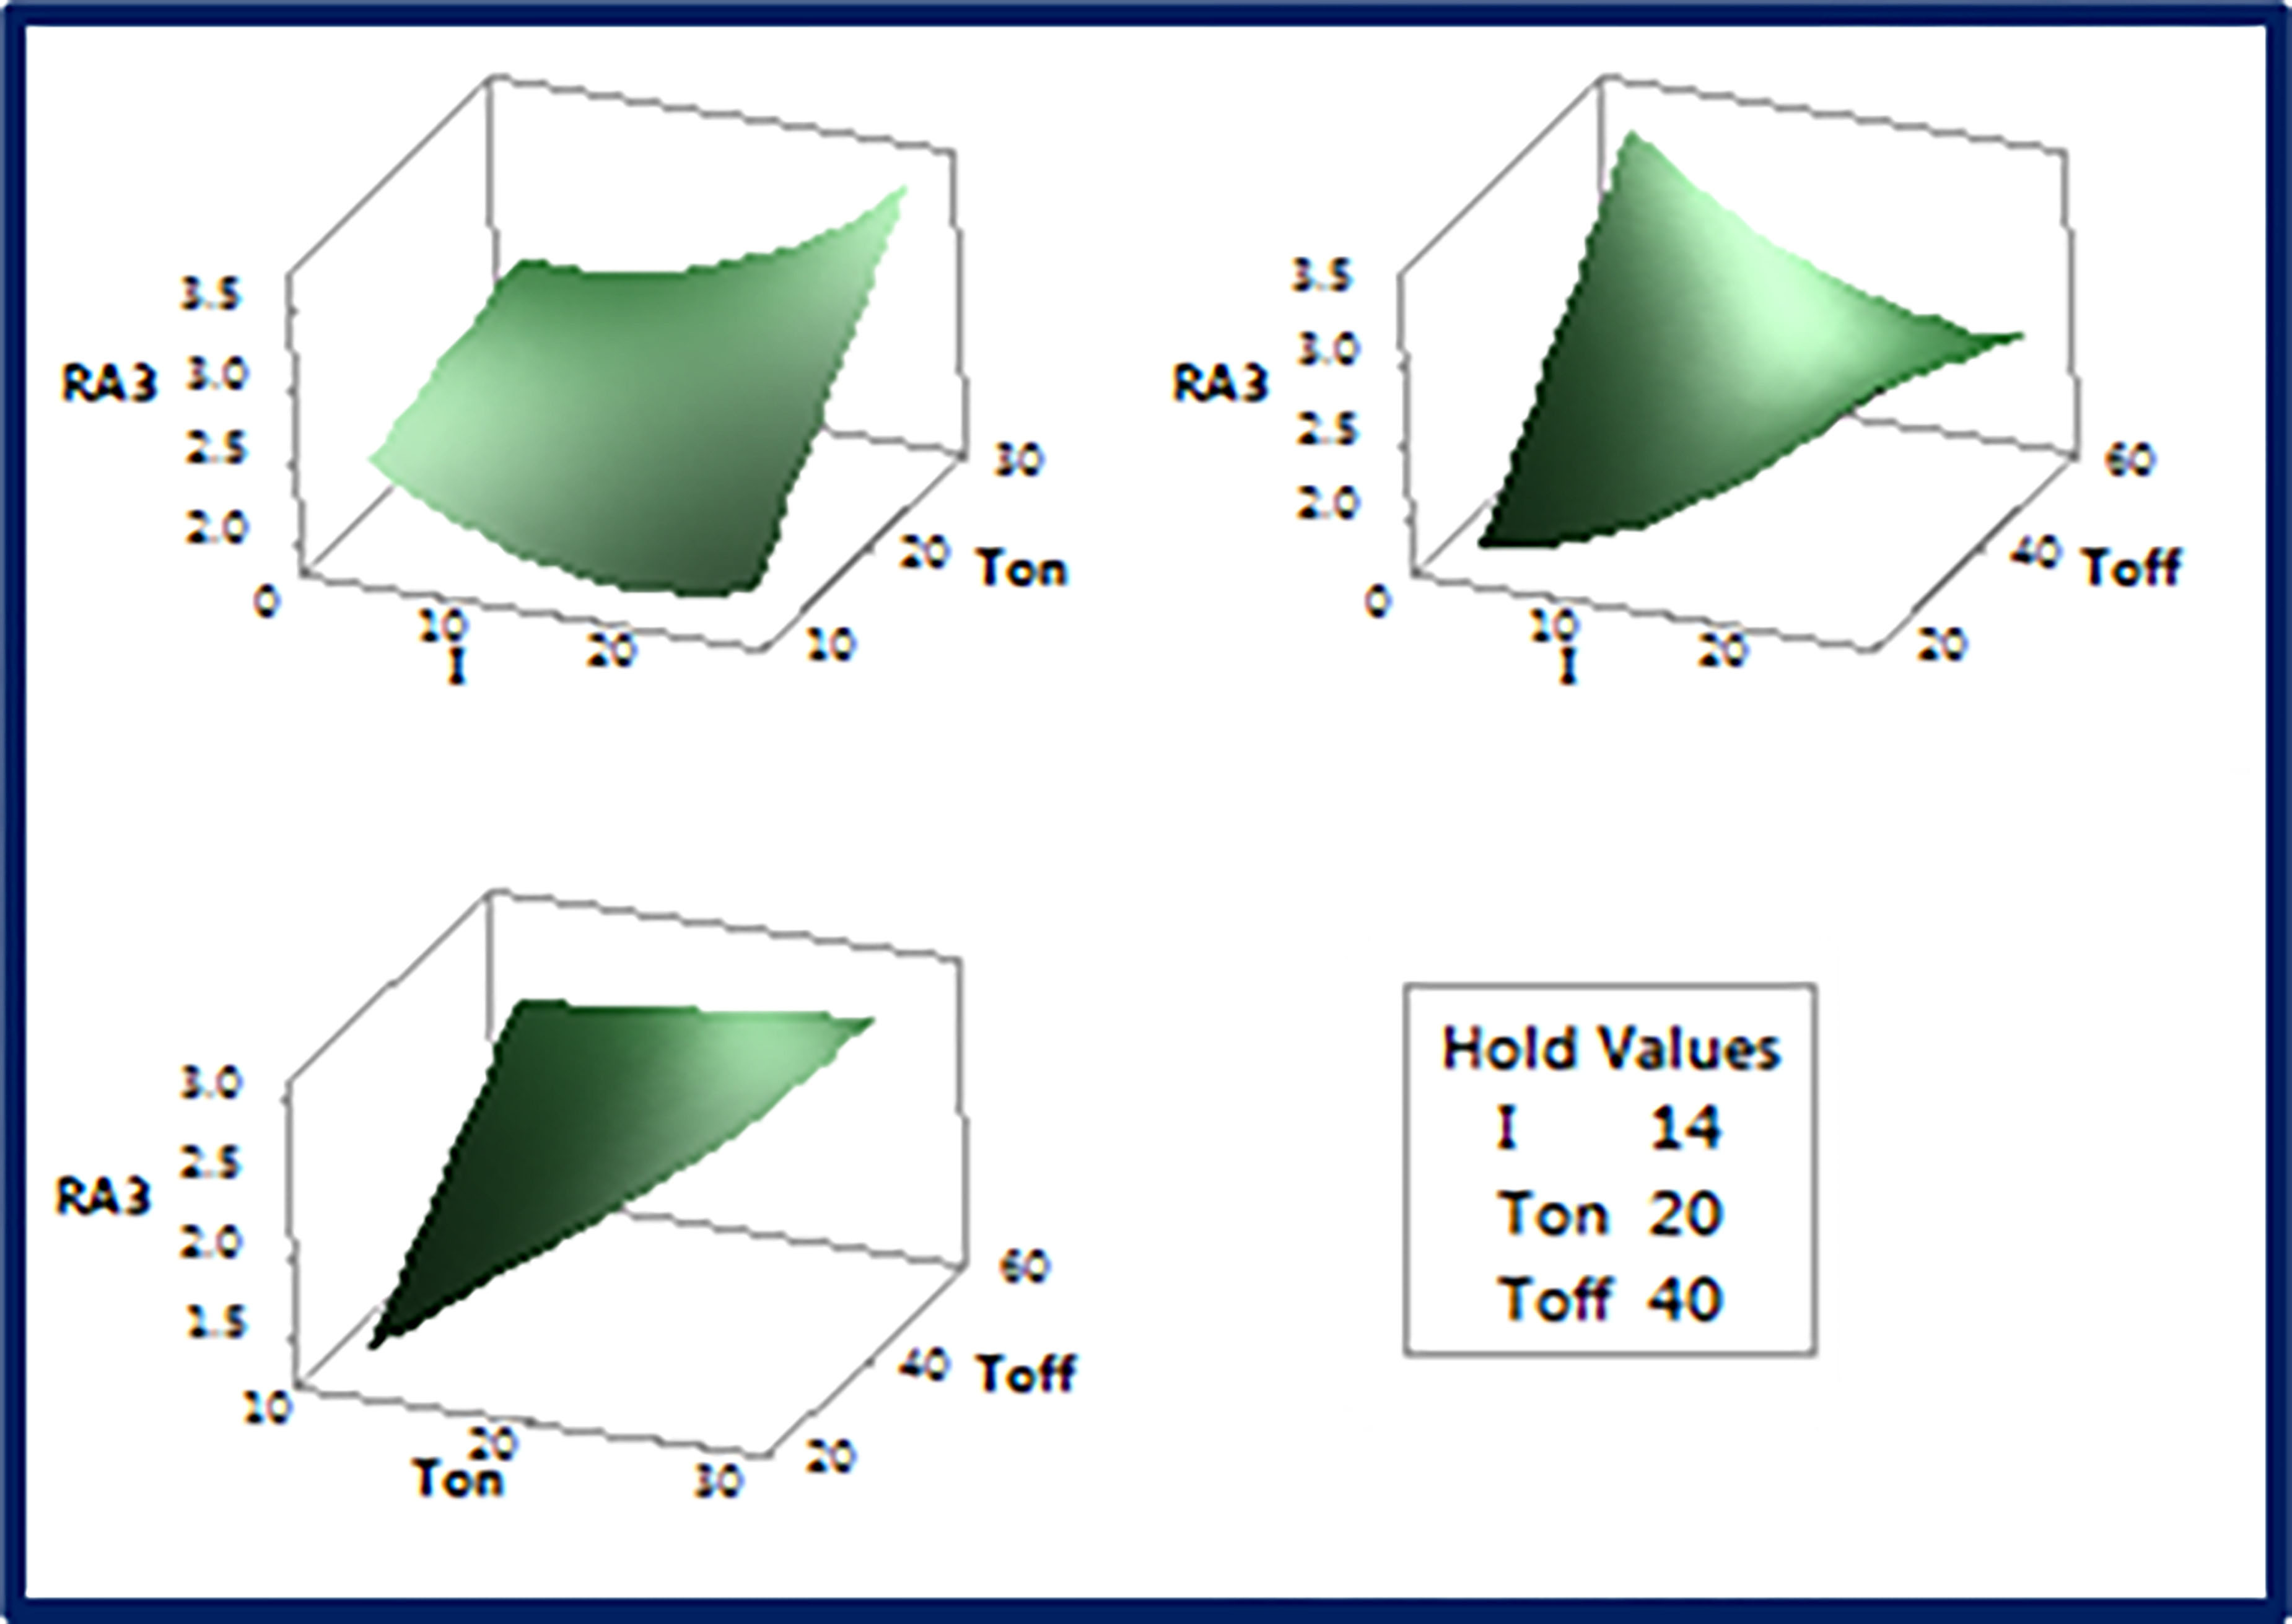
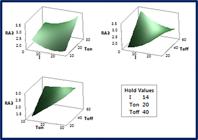
Figure 6 illustrates the non-linearity of surface roughness with the highest pulse in terms of time and current. The plot of the pulse inactive time versus the peak current is presented in Figure 6. As peak current increases and pulse off time stays below 20 μs, surface roughness increases steadily with little variance. The graph of pulse off against time demonstrates a linear relationship with surface roughness.
4.1.1. Mathematical quadratic model for surface roughness
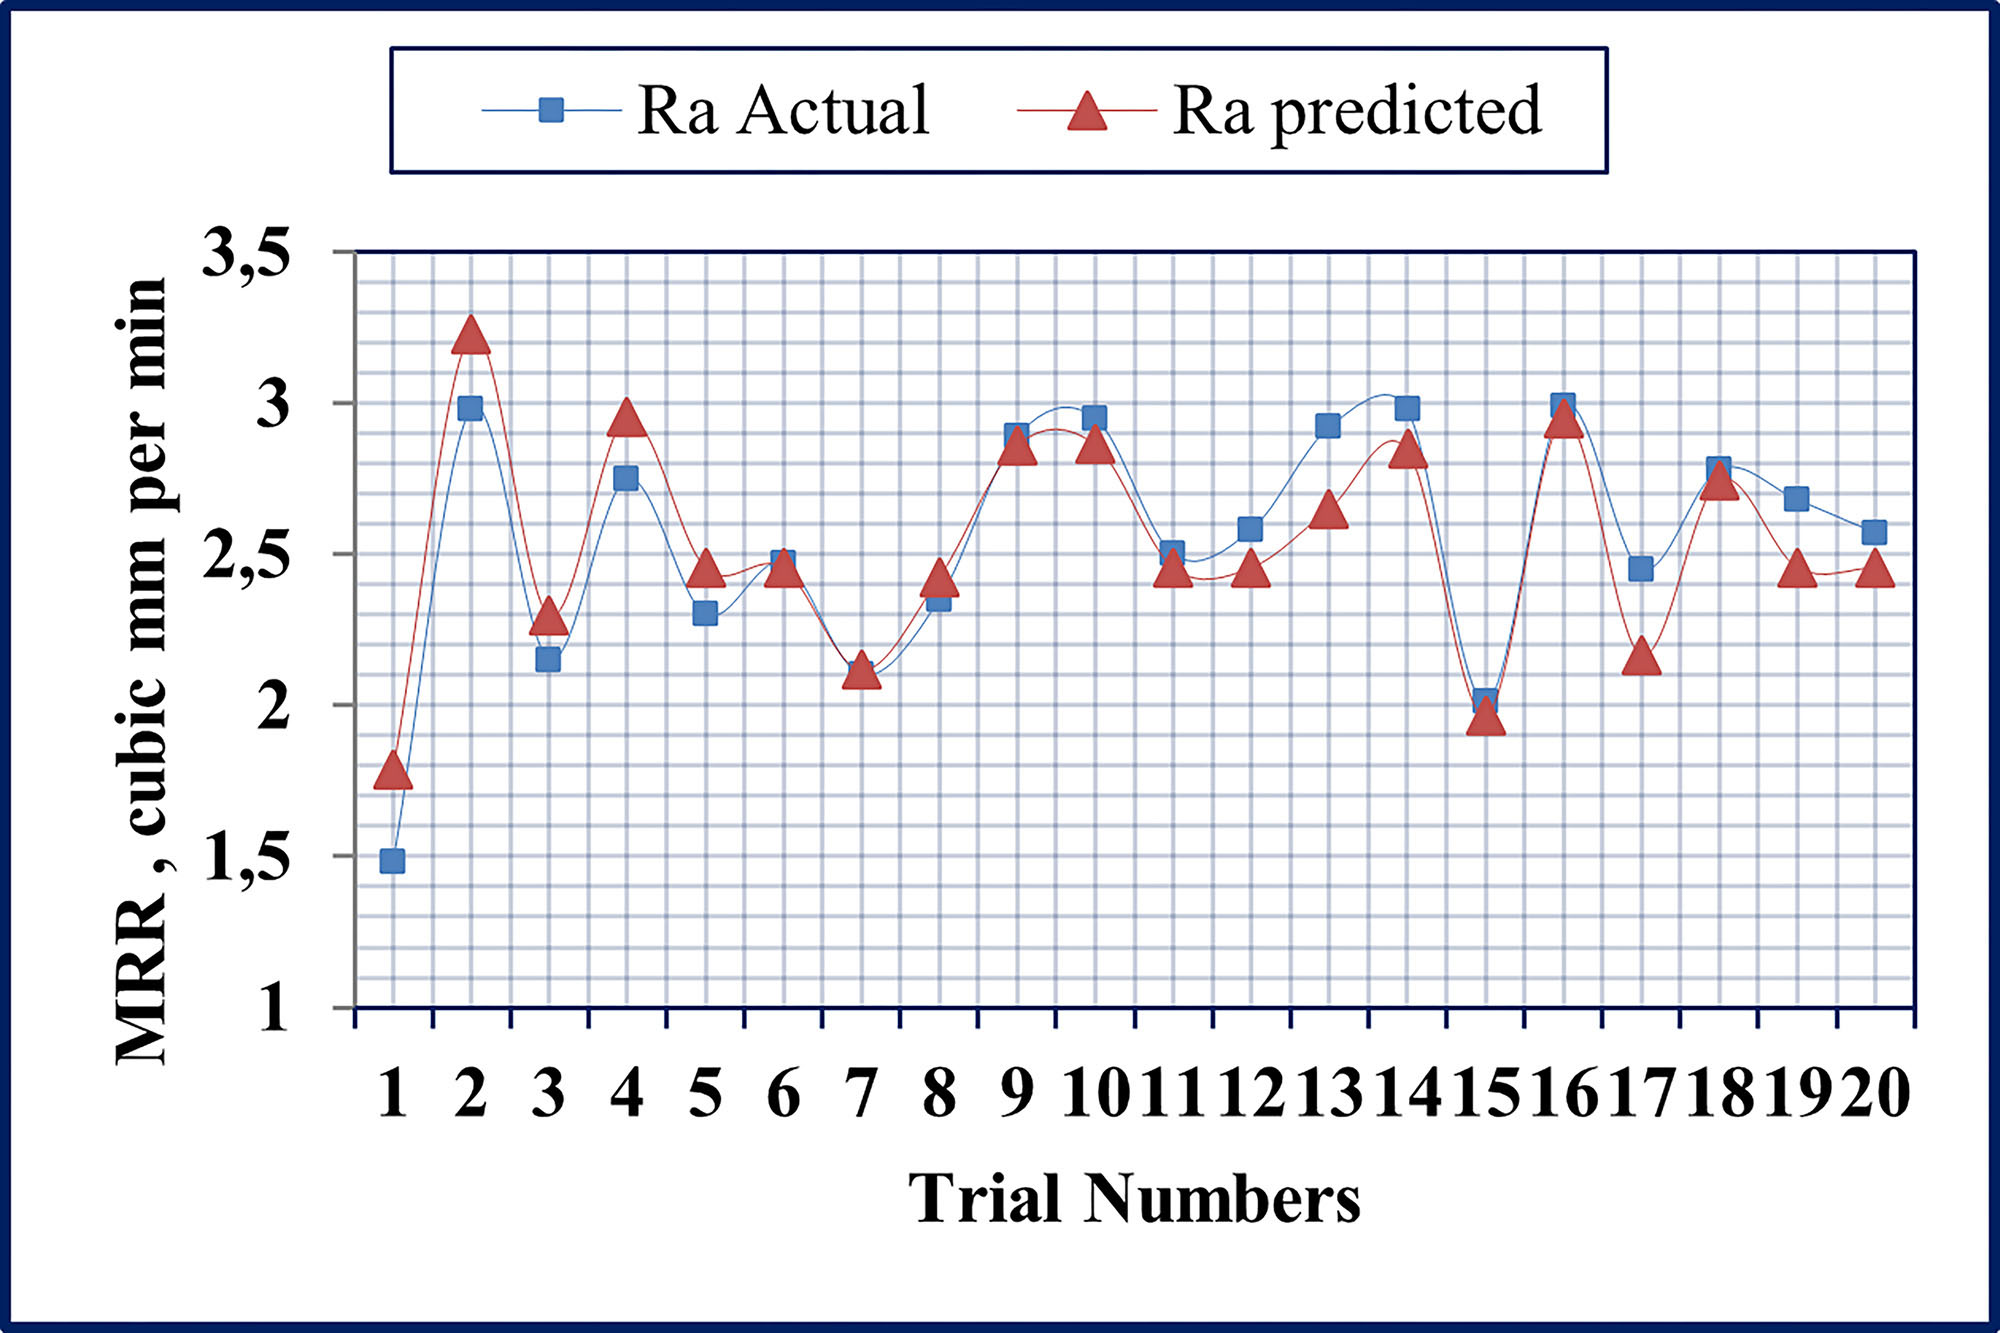
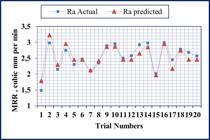
For surface roughness response, Equation 7 shows the quadratic model in encoded units. Figure 7 presents the predicted Ra and notes that the average error percentage between the predicted and actual values is 4. Thus, the average error percentage is less than 5 percent. The mathematical model developed and presented in Equation 7 is satisfactory.
4.2. MRR
Table 6 displays the actual measured MRR. The MRR ANOVA result in Table 7 shows that the pulse off time (Toff) is insignificant (p > 0.05) and the remaining model terms are significant. We also note that the insufficient fit has minimal impact. Therefore, the second order type is considered adequate. In this study, the MRR model summary reveals R-Sq (99.07%) is close to unity. This demonstrates the model matches experimental data correctly. The MRR summary reveals that R-sq (adj) is 98.53%, which is near unity, confirming that the model correlates observed and projected values well. The F value for lack of fit in Table 7 is 1.19, which is lower than the F tabulated value (8.845) with 95% confidence. This clearly indicates the model’s satisfaction and its recommendation for advanced processing.
The percentage contribution values show that the peak current, with a value of 56.9%, is the highest among all parameter combinations, including linear, square, and two-way interactions. Consequently, we identify the maximum current as the most crucial factor. In the linear model, the next significant parameter is Ton with 0.18%, and the very least significant parameter in the linear model is Toff with 0.13%. The square model is obtained by squaring the parameter Once again, when the parameters are squared, the peak current contributes 13.3%, which is higher than the previous squared values. rs. However, we observe a significant decrease in the peak current contribution percentage in both the linear (57%) and squared models (13.3%). The remaining two parameters of the squared model do not exhibit significant differences between the linear and squared models. The interactions of two levels are observed with pulse on time (Ton) and peak current (I) as 2.045.
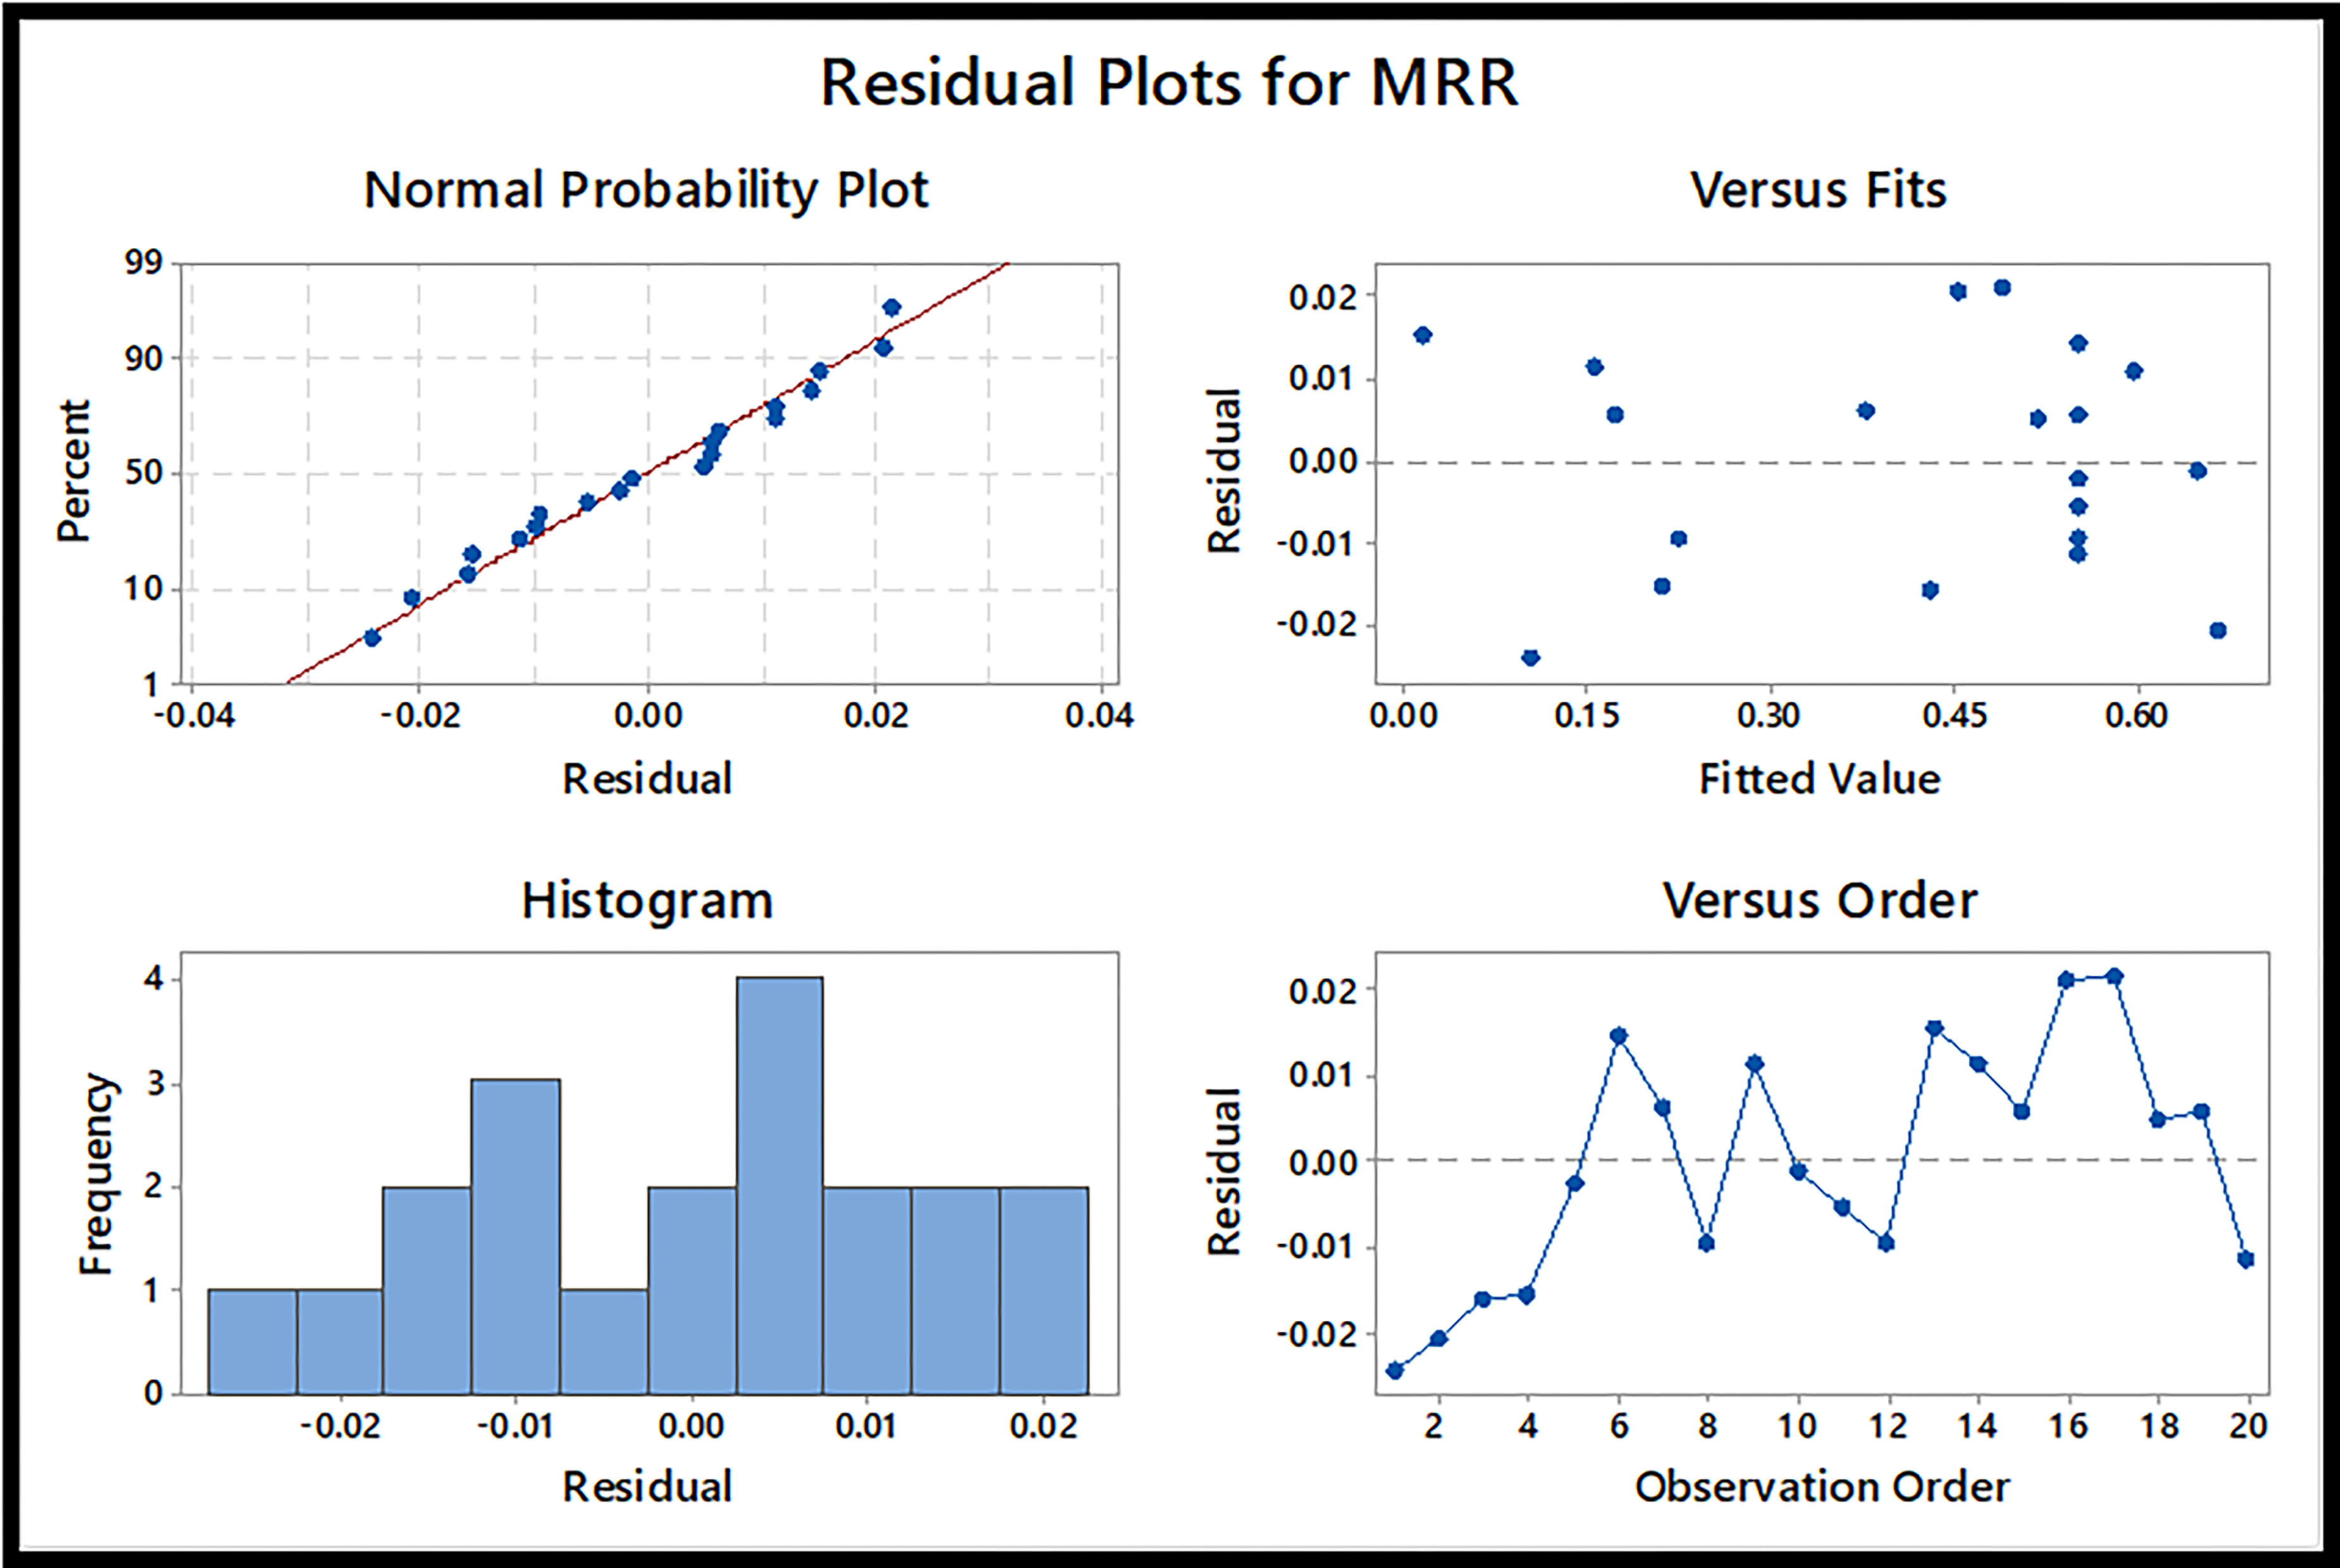
Figure 8’s normal probability plot showed dispersed residuals fitting on the normal line. The plot of residual versus fit (Figure 8) confirms that the residual values are distributed over the graph and no clear pattern has been found. This shows data has been collected with no error.
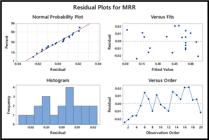
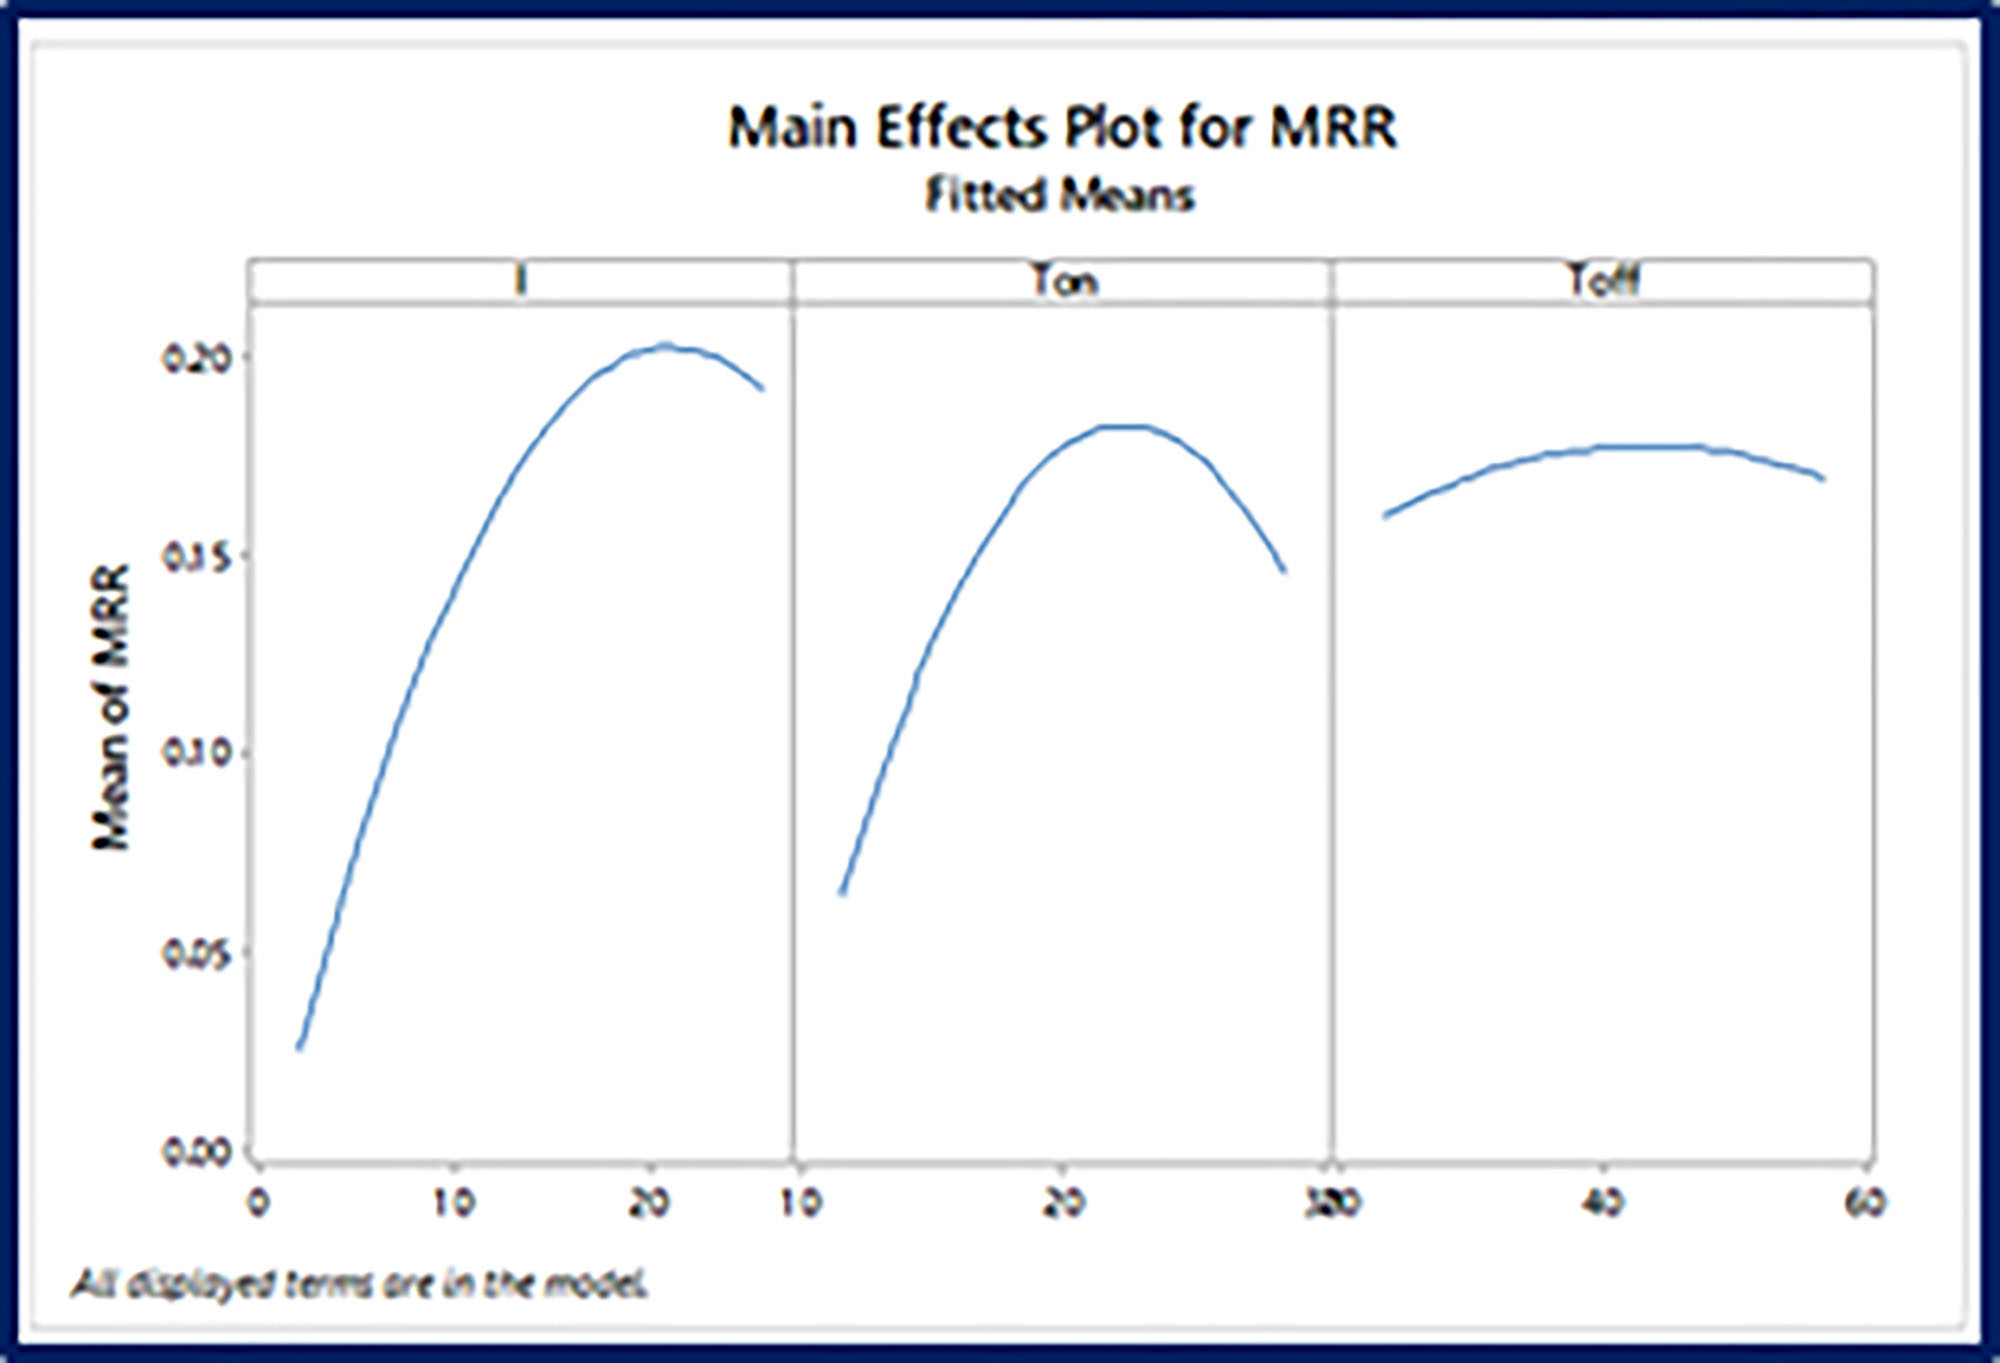
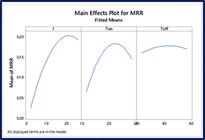
Figure 9 shows Inconel 800’s primary effect plot for MRR. Up to 14 kA, the peak current and MRR have a similar relationship; after that, MRR starts decreasing as welding current increases. We attribute the decrease in MRR at higher welding currents beyond the limit to the accumulation of excess melting materials between the study piece and tool. We also observed a similar result (Figure 9) when we plotted the pulse on time against the peak current versus MRR. As associated with maximum current and pulse on / off time, it shows a very small impact on the MRR of Inconel 800, as seen in the in the third plot in Figure 9. The failure to properly flush the machining zone and remove the debris could be the reason for this.
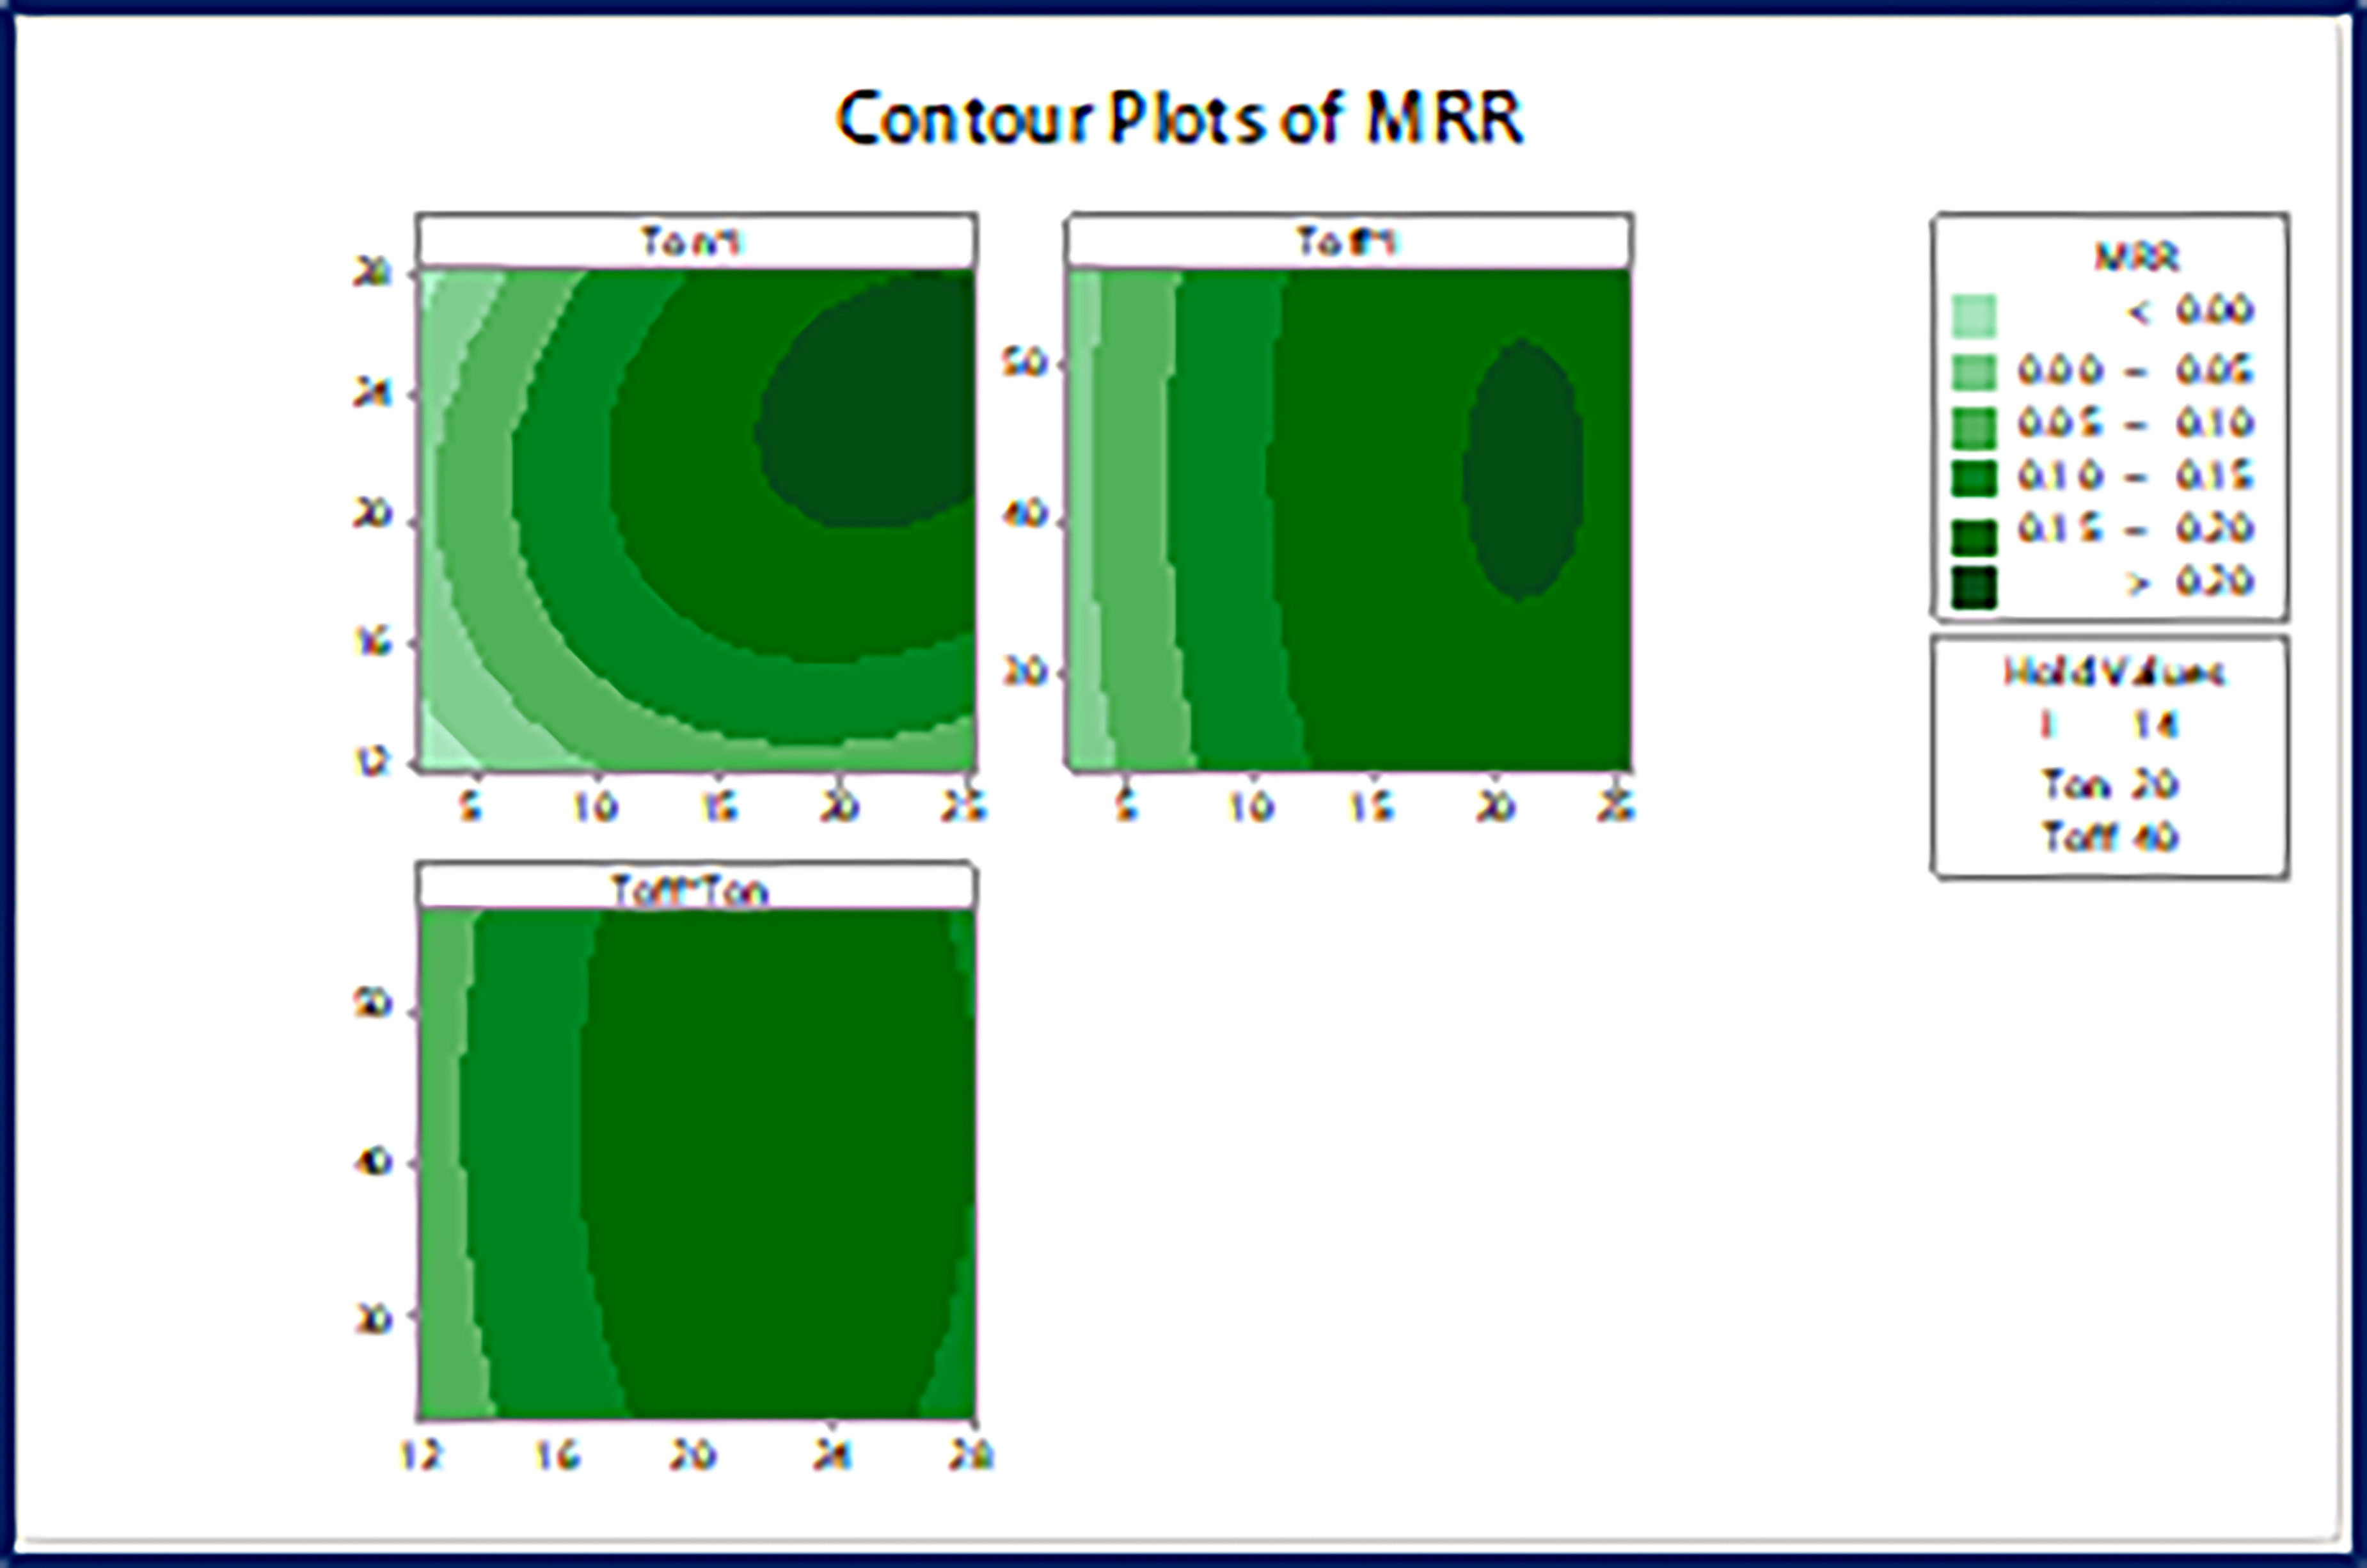
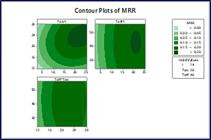
The contour plot displays the various machining parameters against MRR. Figure 10. From I versus Ton plot in Figure 10, increasing the maximum current and Ton results in higher MRR. As seen in Toff and I graph from Figure 10, holding the welding current and increasing the level of Toff value, MRR is also increasing with a negligible difference. This shows that pulse-off time has a very small influence on MRR compared to other parameters. Similarly, from Ton versus Toff graph shown in Figure 8, increasing the Ton value MRR is also increasing, but Toff contribution is very low, which is beyond the 20 μs pulse on time. This again confirmed that Toff is producing the very least impact on Inconel 800’s MRR. The observations have been recorded and displayed in surface plots of MRR for various combinations of input parameters (Figure 10) at holding values of I = 14 kA, Ton = 20 μs and Toff = 40μs.
4.2.1. Mathematical quadratic model of coded value for MRR of Inconel 800
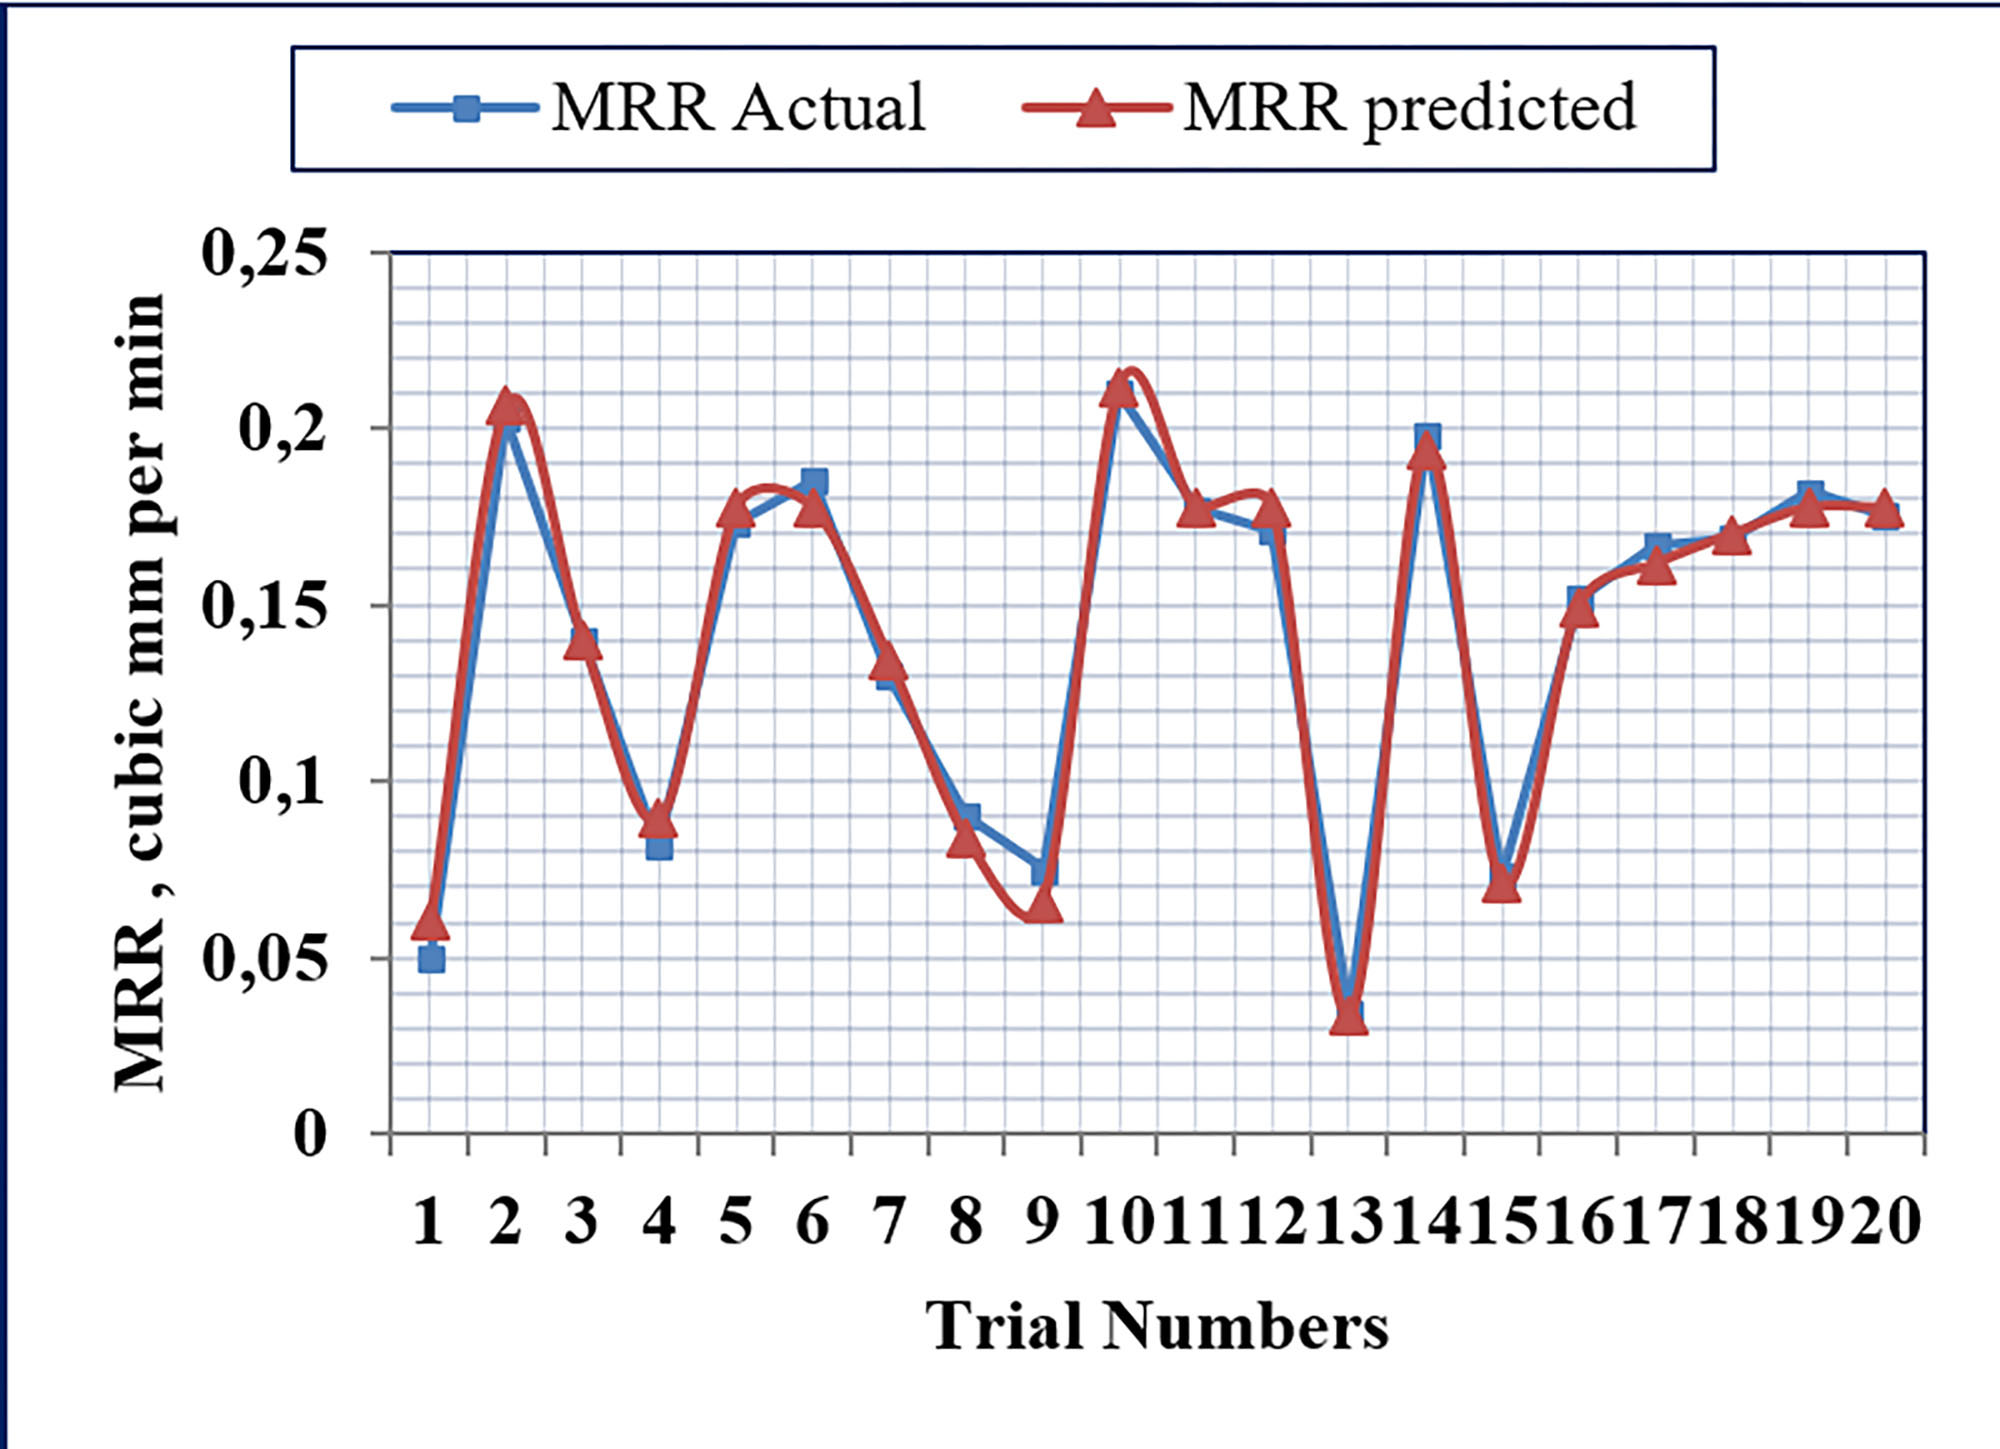
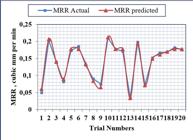
Equation 7 displays the quadratic Inconel 800 MRR model. The quadratic model from Eq. 7 demonstrates that pulse on/off time and peak current have a positive effect on MRR. That is, as the value of individual parameters increases, MRR also rises. The reason for this increase in current (I) is due to the increasing development of a localized temperature, which leads to the melting of more materials and instantaneous vaporization. The largest element in MRR is the peak current, which is closely followed by the pulse on/off time. Thus, the heat impact of the workpiece material raises the MRR with characteristic times, allowing the peak current to form an effective plasma zone, which in turn melts and vaporizes more materials. Figure 11 illustrates real MRR and regression equation predictions. We observe an average error percentage of 4.94 with the predicted values, indicating that the given regression equation for predicting MRR is satisfactory.
4.3. Multiple response surface optimizer
Parametric optimization seeks the optimal parameters for production, productivity, and quality [19]. This research implemented one of the conventional optimisation techniques, RSO (Response Surface Optimizer), to find the optimal parameter. Researchers widely use the desirability function method to achieve the optimal parameter [21]. The desirability function method calculates the individual variable input, Vi, from the corresponding response transformation (RT). Equation 8 provides the equation for the desirability function in the ideal case, assigning a value of zero for the worst case.
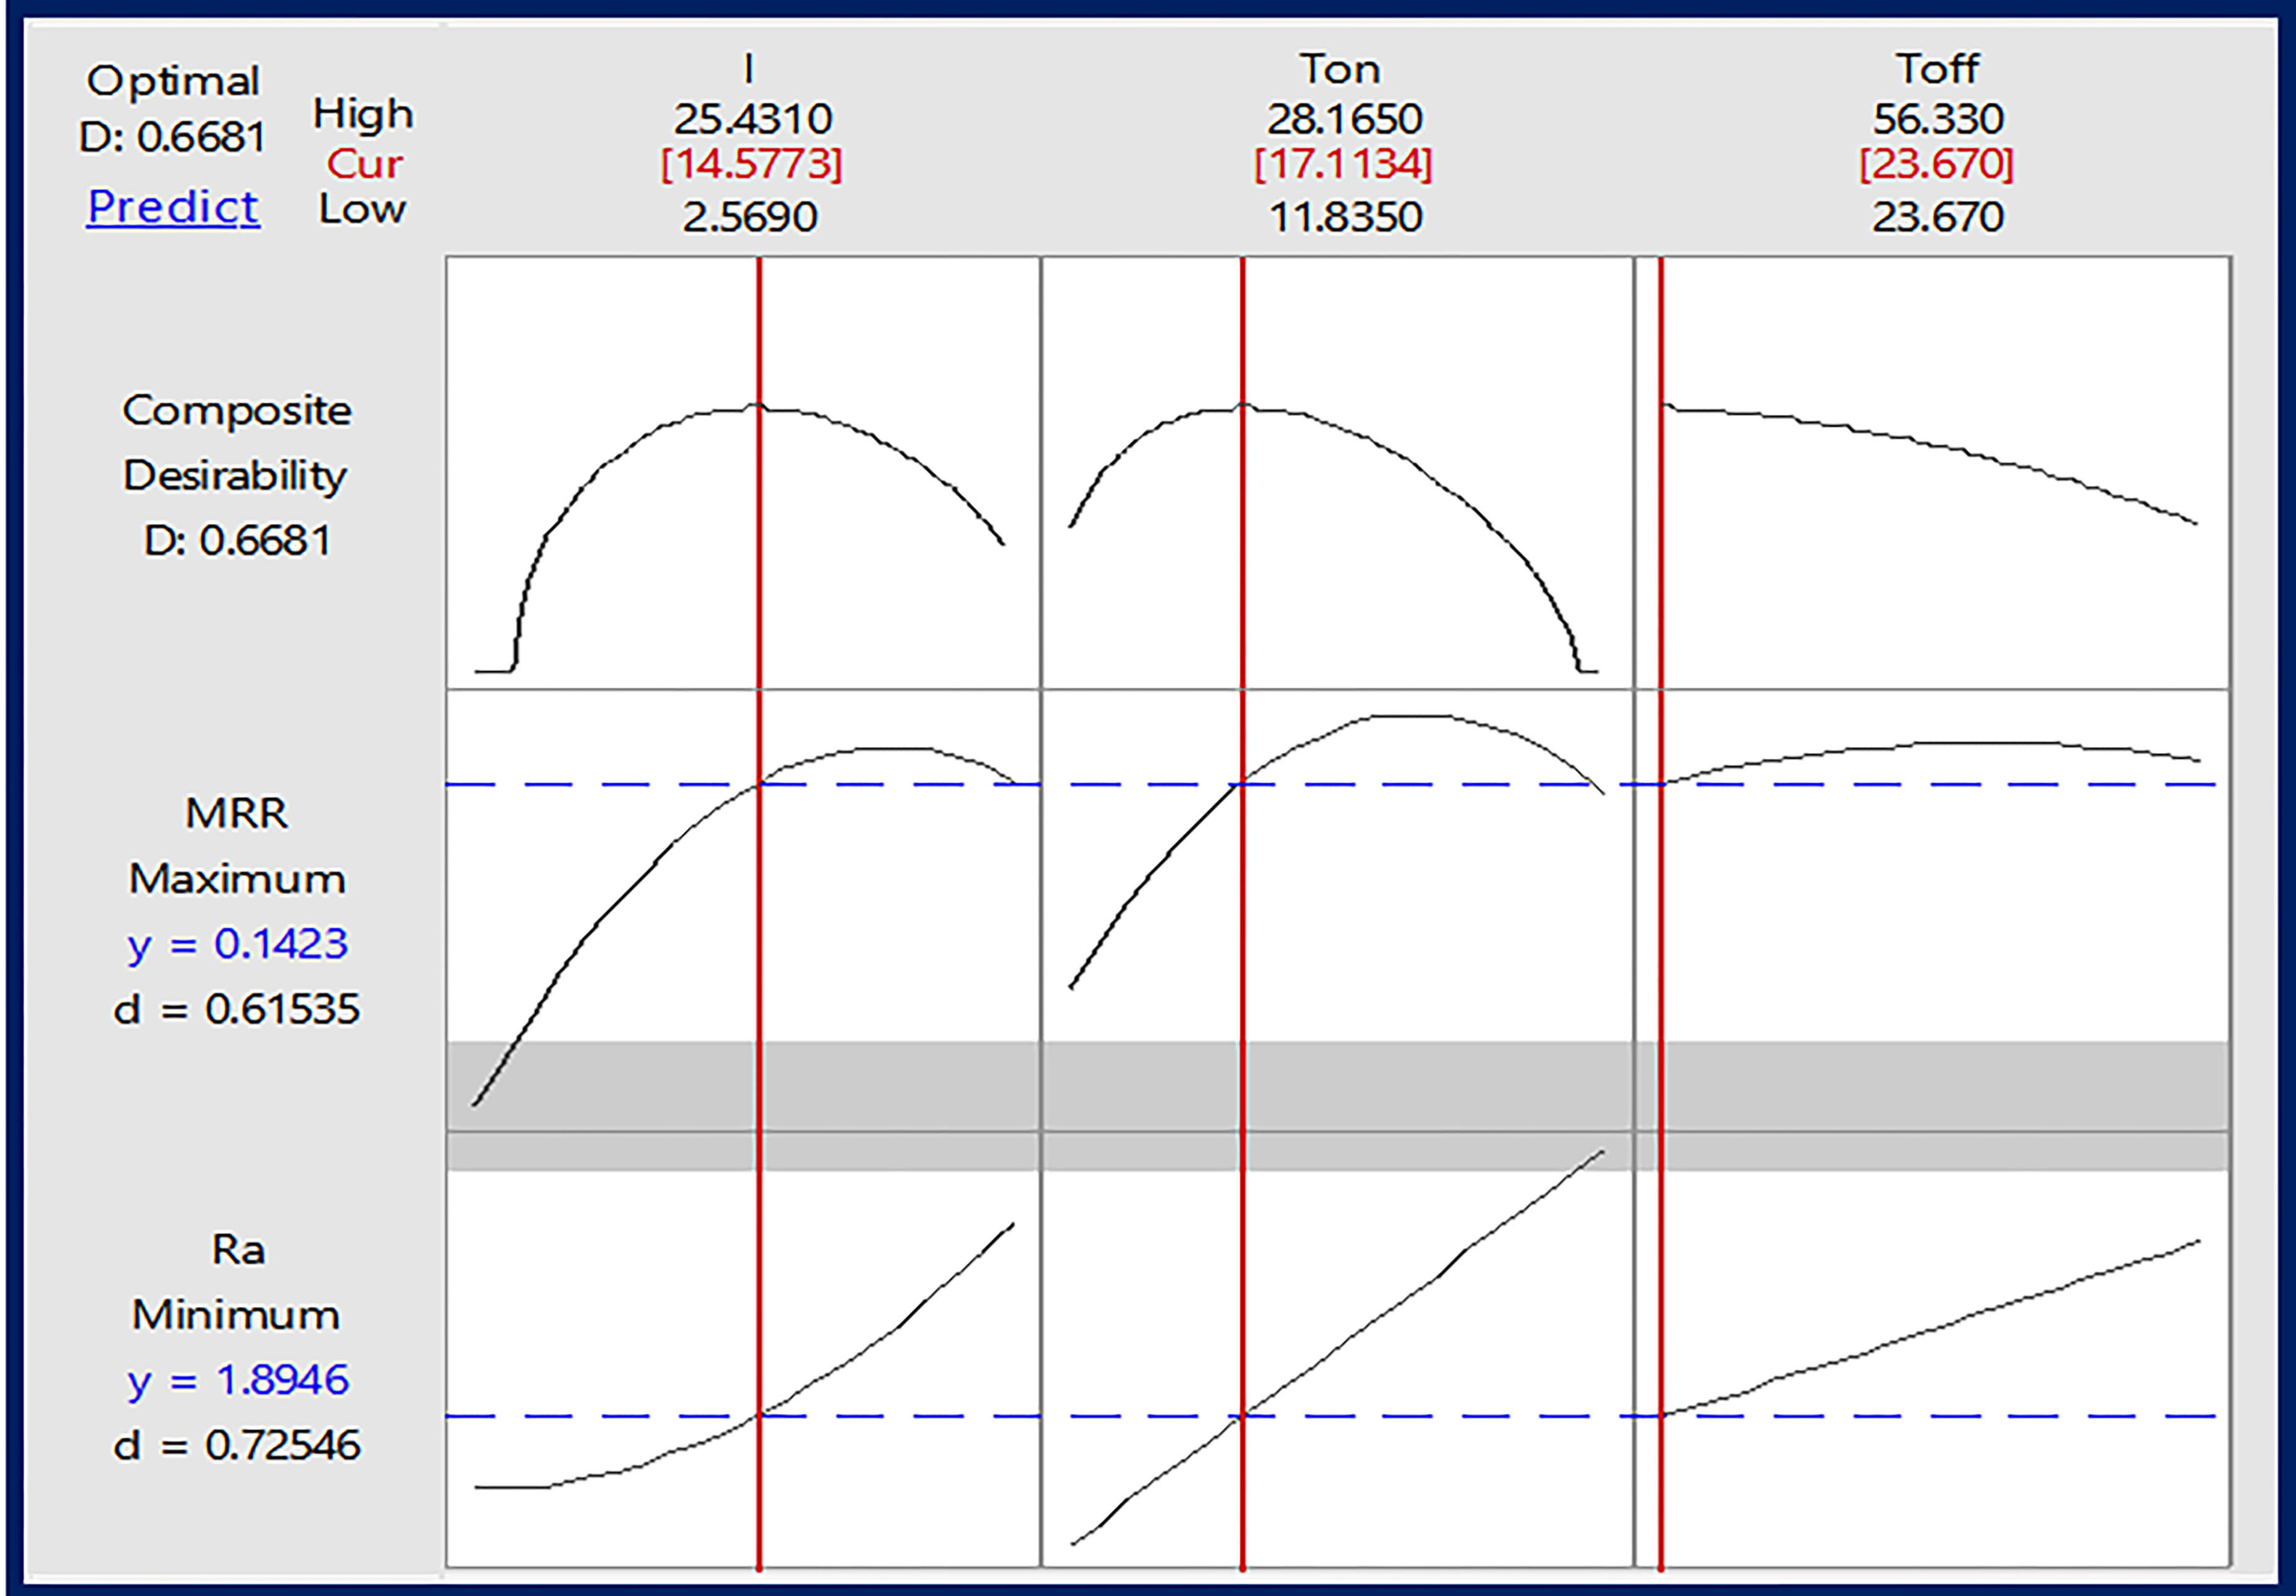
We refer to the input variables in the composite desirability function as Ti (Target Value). The upper value of the response is referred to as Rmax, and the lower value is referred to as Rmin. The problem allows us to set the desirability composite function of responses to one of three options: (i) maximise, (ii) minimise, and (iii) target. In this investigation, the two responses are surface roughness and selecting MRR optimises process limits. minimise Ra and maximise MRR. Minitab-18 software has been utilised to adopt the multi response optimisation of machining Inconel 800 using die sinking EDM. We set the target values of minimum and maximum surface roughness as 1.48 to 2.99 Ra. Similarly, we set the MRR at 0.034 and 0.21, respectively. As previously discussed, we aligned the surface roughness to minimise the target value, while we aligned the MRR to maximise the target value. Figure 12 displays the results of multiple response optimisation. The top of the row displays the EDM parameters, while the left column displays composite desirability, Ra, and MRR, starting from composite desirability.
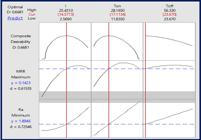
Each cell in Figure 12 shows the effect of individual parameters against composite desirability, Ra, and MRR. When other parameters remain constant, the disparity against individual parameters becomes clearly visible. The top row displays the current value of the selected variable input parameters, ranging from high tFactor settings will interactively modify the current configuration. tings. Each row at the extreme left of the column displays the individual desirability scores and the predicted response value based on the current parameter settings. The current settings for individual constraints for peak current and pulse on/off time are 14.57 kA, 17.11 μs and 23.67 μs respectively. Also, at the current parameter settings, the predicted results of Ra and MRR are 1.8946 and 0.1423, respectively. The corresponding desirability factors for individual responses are 0.72546 and 0.61545, respectively. Moreover, after optimisation, we identify the composite desirability for optimised values as 0.6681.
4.6. Confirmation experiments
Generally, the purpose was to confirm the reaction and correctness of mathematical models through experiments. We conducted three tests to confirm the correctness of the response surface model. Table 8 shows the experimental and expected optimized parameter values versus MRR and Ra responses. Thus, with less than 5% error, the projected values match the experimental values.
5. CONCLUSIONS
-
ANOVA analysis reveals that pulse on/off time has a significant impact on Ra (surface roughness), with pulse active time contributing more and peak current having the least impact. The peak current contribution to MRR response is highest by Ton and lowest by Toff.
-
You can construct an empirical model that demonstrates the link between changeable input parameters and desirable die sinking EDM process responses using a second-order equation. With an error rate of less than 5%, the projected values are near the experimental values.
-
The main effects figure shows that increasing pulse duration leads to increased surface roughness and MRR. The pulse on time raises MRR up to 20 μs, then decreases while surface roughness rises. Peak current, like pulse on time, affects MRR. Surface roughness decreases at the onset of increasing current and rises at greater peak current due to debris adherence at the machining surface. Additionally, pulse off time increases surface roughness, although it has no effect on MRR.
-
The best process parameters are 15 A, 17 μs, and 24 μs for peak current, pulse on/off time. The ideal settings indicate a maximum MRR of 0.1423 mm3/min and a minimum Ra of 1.8946 μm. Confirmation trials indicate that projected values are close to experimental values. Therefore, RSM is an effective method, and the model produced can predict MRR and surface roughness.
6. BIBLIOGRAPHY
-
[1] AIYAR, H.D.S., CHAUHAN, G., GUPTA, N., Soft modeling of WEDM process in prediction of surface roughness using artificial neural networks. In: Agrawal, R., Jain, J.K., Yadav, V.S., et al., (eds), Recent Advances in Smart Manufacturing and Materials. Lecture Notes in Mechanical Engineering, Singapore, Springer, pp 465–474, 2021. doi: http://doi.org/10.1007/978-981-16-3033-0_44.
» https://doi.org/10.1007/978-981-16-3033-0_44 - [2] BHARTI, P.S., MAHESHWARI, S., SHARMA, C., “Experimental investigation of Inconel 718 during die-sinking electric discharge machining.”, International Journal of Engineering Science and Technology, v. 2, n. 11, pp. 6464–6473, 2010.
-
[3] DEVARASIDDAPPA, D., CHANDRASEKARAN, M., ARUNACHALAM, R., “Experimental investigation and parametric optimization for minimizing surface roughness during WEDM of Ti6Al4V alloy using modified TLBO algorithm”, Journal of the Brazilian Society of Mechanical Sciences and Engineering, v. 42, n. 128, pp. 128, 2020. doi: http://doi.org/10.1007/s40430-020-2224-7.
» https://doi.org/10.1007/s40430-020-2224-7 -
[4] DHANABALAN, S., SIVAKUMAR, K., SATHIYA NARAYANAN, C., “Analysis of Form Tolerances in Electrical Discharge Machining Process for Inconel 718 and 625”, Materials and Manufacturing Processes, v. 29, n. 3, pp. 253–259, 2014. doi: http://doi.org/10.1080/10426914.2013.852213.
» https://doi.org/10.1080/10426914.2013.852213 -
[5] DIKSHIT, M.K., ANAND, J., NARAYAN, D., et al, “Machining characteristics and optimization of process parameters in die-sinking EDM of Inconel 625”, Journal of the Brazilian Society of Mechanical Sciences and Engineering, v. 41, n. 302, pp. 302, 2019. doi: http://doi.org/10.1007/s40430-019-1809-5.
» https://doi.org/10.1007/s40430-019-1809-5 -
[6] GARG, M.P., KUMAR, A., SAHU, C.K., “Mathematical modeling and analysis of WEDM machining parameters of nickel-based super alloy using response surface methodology”, Sadhana, v. 42, n. 6, pp. 981–1005, 2017. doi: http://doi.org/10.1007/s12046-017-0647-3.
» https://doi.org/10.1007/s12046-017-0647-3 -
[7] GUPTA, M.K., SOOD, P.K., “Machining comparison of aerospace materials considering minimum quantity cutting fluid: A clean and green approach”, Proceedings of the Institution of Mechanical Engineers. Part C, Journal of Mechanical Engineering Science, v. 231, n. 8, pp. 1445–1464, 2016. doi: http://doi.org/10.1177/0954406216684158.
» https://doi.org/10.1177/0954406216684158 -
[8] KANLAYASIRI, K., BOONMUNG, S., “Effects of wire-EDM machining variables on surface roughness of newly developed DC 53 die steel: design of experiments and regression model”, Journal of Materials Processing Technology, v. 192-193, pp. 459–464, 2007. doi: http://doi.org/10.1016/j.jmatprotec.2007.04.085.
» https://doi.org/10.1016/j.jmatprotec.2007.04.085 -
[9] KUMAR, S., DHINGRA, A.K., KUMAR, S., “Parametric optimization of powder mixed electrical discharge machining for nickel-based superalloy inconel-800 using response surface methodology”, Mechanics of Advanced Materials and Modern Processes, v. 3, n. 7, pp. 7, 2017. doi: http://doi.org/10.1186/s40759-017-0022-4.
» https://doi.org/10.1186/s40759-017-0022-4 -
[10] KUMAR, S., GHOSHAL, S.K., ARORA, P.K., et al, “Multi-variable optimization in die-sinking EDM process of AISI420 stainless steel”, Materials and Manufacturing Processes, v. 36, n. 5, pp. 572–582, 2021. doi: http://doi.org/10.1080/10426914.2020.1843678.
» https://doi.org/10.1080/10426914.2020.1843678 -
[11] MISHRA, D.K., RAHUL, DATTA, S., et al, “Through hole making by electro-discharge machining on Inconel 625 super alloy using hollow copper tool electrode”, Proceedings of the Institution of Mechanical Engineers. Part E, Journal of Process Mechanical Engineering, v. 233, n. 2, pp. 348–370, 2018. doi: http://doi.org/10.1177/0954408918784701.
» https://doi.org/10.1177/0954408918784701 -
[12] MUTHURAMALINGAM, T., MOHAN, B., “A review on influence of electrical process parameters in EDM process”, Archives of Civil and Mechanical Engineering, v. 15, n. 1, pp. 87–94, 2015. doi: http://doi.org/10.1016/j.acme.2014.02.009.
» https://doi.org/10.1016/j.acme.2014.02.009 -
[13] PACHAURY, Y., TANDON, P., “An overview of electric discharge machining of ceramics and ceramic based composites”, Journal of Manufacturing Processes, v. 25, pp. 369–390, 2017. doi: http://doi.org/10.1016/j.jmapro.2016.12.010.
» https://doi.org/10.1016/j.jmapro.2016.12.010 -
[14] RAHUL, ABHISHEK, K., DATTA, S., et al “Machining performance optimization for electro-discharge machining of Inconel 601, 625, 718 and 825: an integrated optimization route combining satisfaction function, fuzzy inference system and Taguchi approach”, Journal of the Brazilian Society of Mechanical Sciences and Engineering, v. 39, n. 9, pp. 3499–3527, 2017. doi: http://doi.org/10.1007/s40430-016-0659-7.
» https://doi.org/10.1007/s40430-016-0659-7 -
[15] RAHUL, DATTA, S., BISWAL, B.B., et al, “Machinability analysis of Inconel 601, 625, 718 and 825 during electro-discharge machining: on evaluation of optimal parameters setting”, Measurement, v. 137, pp. 382–400, 2019. doi: http://doi.org/10.1016/j.measurement.2019.01.065.
» https://doi.org/10.1016/j.measurement.2019.01.065 -
[16] RAJESHA, S., SHARMA, A.K., KUMAR, P., “On electro discharge machining of inconel 718 with hollow tool”, Journal of Materials Engineering and Performance, v. 21, n. 6, pp. 882–891, 2012. doi: http://doi.org/10.1007/s11665-011-9962-8.
» https://doi.org/10.1007/s11665-011-9962-8 -
[17] RAMASWAMY, A., PERUMAL, A.V., “Multi-objective optimization of drilling EDM process parameters of LM13 Al alloy-10ZrB2-5TiC hybrid composite using RSM”, Journal of the Brazilian Society of Mechanical Sciences and Engineering, v. 42, n. 432, pp. 432, 2020. doi: http://doi.org/10.1007/s40430-020-02518-9.
» https://doi.org/10.1007/s40430-020-02518-9 -
[18] SENTHIL, S.M., PARAMESHWARAN, R., RAGU NATHAN, S., et al, “A multi-objective optimization of the friction stir welding process using RSM-based-desirability function approach for joining aluminum alloy 6063-T6 pipes”, Structural and Multidisciplinary Optimization, v. 62, n. 3, pp. 1117–1133, 2020. doi: http://doi.org/10.1007/s00158-020-02542-2.
» https://doi.org/10.1007/s00158-020-02542-2 - [19] SHANKAR, T.S.K., DHANABALAN, S., BALASUBRAMANIAN, B., et al, “Mechanical and morphological behaviour of holoptelea integrifolia fibre reinforced with sic particulates hybrid polymer epoxy composites”, Journal of Environmental Protection and Ecology, v. 24, n. 2, pp. 553–558, 2023.
-
[20] SHARMA, P., CHAKRADHAR, D., “Analysis and optimization of wedm performance characteristics of inconel 706 for aerospace application”, Silicon, v. 10, n. 3, pp. 921–930, 2018. doi: http://doi.org/10.1007/s12633-017-9549-6.
» https://doi.org/10.1007/s12633-017-9549-6 -
[21] SINGH, G., GUPTA, M.K., MIA, M., et al, “Modeling and optimization of tool wear in MQL-assisted milling of Inconel 718 superalloy using evolutionary techniques”, International Journal of Advanced Manufacturing Technology, v. 97, n. 1–4, pp. 481–494, 2018. doi: http://doi.org/10.1007/s00170-018-1911-3.
» https://doi.org/10.1007/s00170-018-1911-3 -
[22] SINGH, N., ROUTARA, B.C., DAS, D., “Study of machining characteristics of Inconel 601in EDM using RSM”, Materials Today: Proceedings, v. 5, n. 2, pp. 3438–3449, 2018. doi: http://doi.org/10.1016/j.matpr.2017.11.590.
» https://doi.org/10.1016/j.matpr.2017.11.590 -
[23] VIGNESH, K., ELAYA PERUMAL, A., VELMURUGAN, P., “Optimization of resistance spot welding process parameters and microstructural examination for dissimilar welding of AISI 316L austenitic stainless steel and 2205 duplex stainless steel”, International Journal of Advanced Manufacturing Technology, v. 93, n. 1–4, pp. 455–465, 2017. doi: http://doi.org/10.1007/s00170-017-0089-4.
» https://doi.org/10.1007/s00170-017-0089-4