 Mechanical strength, tribological performance, and waste control in filler-modified glass fiber–reinforced epoxy composites
ABSTRACT
Glass fiber–reinforced epoxy composites are used in lightweight structural and sliding components, yet dry-contact damage can shorten service life and generate wear debris. Filler engineering offers a practical route to strengthen the matrix-rich surface while controlling friction and material loss. A coordinated comparison of lubricating, ceramic, and lamellar fillers within a single glass fiber–epoxy platform is still needed. This study aims to assess the mechanical, tribological, and waste-control response of graphite-, SiC-, and MoS₂-filled glass fiber–epoxy laminates. Laminates containing 0, 2, 3, and 5 wt.% filler were fabricated by hand lay-up and compression molding, then tested by tensile, flexural, Shore D hardness, notched Izod impact, ASTM G99 pin-on-disc wear, profilometry, SEM, and response surface modelling. S5 recorded 328 MPa tensile strength, 438 MPa flexural strength, 90 Shore D hardness, and 1.70 × 10⁻⁴ mm³ N-1 m-1 specific wear rate, representing 13.1%, 15.3%, 9.8%, and 39.5% gains over C1. M3 recorded 65 kJ m⁻² impact strength, 0.374 coefficient of friction, and 1.510 µm roughness, giving 12.1%, 40.4%, and 19.8% gains. The results support application-specific filler selection: SiC is suitable for load-bearing wear components, while MoS₂ is suitable for low-friction sliding interfaces. Future innovation should extend validation to high loads, ageing, filler mapping, and multi-criteria ranking.
Keywords:
Glass fiber–reinforced epoxy composites; Pin-on-disc tribology; Response surface methodology; Solid lubricant fillers; Waste recycling
1. INTRODUCTION
Glass fiber–reinforced epoxy composites occupy a strong position in structural and sliding-contact components because the glass fabric carries load while the epoxy matrix binds fibers, transfers and protects the reinforcement from moisture and chemical exposure. Still the same matrix-rich surface suffers during dry sliding: adhesive junctions form, heat accumulates at asperities, matrix fragments detach, and exposed fibers start to abrade the counter face [1]. Filler modification has become a practical route to altering this surface response without replacing the underlying laminate architecture. Recent reviews connect filler type, filler scale, interfacial bonding, and processing route with mechanical, thermal, and wear response in polymer composites [2]. Modified MoS2/SiC/epoxy systems also support the idea that a hard ceramic phase and a lamellar solid lubricant can act via distinct contact mechanisms within the same polymer matrix [3]. Low-loading MoS2/epoxy work provides additional evidence: tribofilm formation can control friction even when filler content stays below 1 wt.% [4].
Graphite, SiC, MoS2, Al2O3, and waste-derived mineral fillers have been studied using various experimental approaches, but their comparison remains difficult because specimen architecture, filler size, sliding load, speed, counter face, and statistical design vary from one research to another. Graphite-filled epoxy studies focus on self-lubrication and abrasive-wear control, with particle size and resin [5] viscosity shaping processing quality [6]. MoS2/helical carbon nanotube epoxy systems demonstrate that solid lubricants can be paired with reinforcing nanostructures to adjust friction, hardness, and elastic modulus within a single material system [7]. Hybrid Al2O3/graphite epoxy composites extend this design logic by pairing a ceramic particle with a lubricating carbon phase [8]. In fiber-reinforced epoxy, alumina-filled E-glass laminates were studied under erosion conditions using Taguchi analysis, linking process variables and filler content to erosion rate rather than sliding wear alone [9]. Ceramic-particulate AA6061 composites also show the usefulness of Taguchi and ANOVA for identifying dominant tribological control factors, even though the matrix is metallic rather than polymeric. Industrial-waste-filled epoxy systems add another dimension by replacing conventional fillers with blast furnace slag, ferrochromium slag, or converter slag under ball-on-disk wear testing [10]. Nano clay-filled glass fiber–epoxy laminates show that nanoparticle addition can alter mechanical and thermal response, yet tribology, roughness, and waste loss need a separate sliding-contact framework [11].
Experimental studies use hand lay-up, compression molding, solution casting, powder processing, coating deposition, and electrodeposition, so the processing conditions differ substantially across the field (Table 1). Taguchi design, ANOVA, RSM, ANN, SEM, EDS, and roughness mapping are frequently reported , but not always in the same study. Common patterns can be inferred from the comparative data: hard ceramic particles strengthen contact surfaces, while graphite- or MoS2-rich phases lower shear at the interface. The main technical differences lie in matrix type, reinforcement form, filler size, load range, wear mode, and whether the work measures mechanical strength and tribology under one design.
Literature on filler types, experimental methods, and tribological findings relevant to glass fiber–epoxy composites.
The research is increasingly shifting from single-property composite reporting toward multi-response design, where strength, hardness, impact resistance, coefficient of friction, wear rate, roughness, and morphology are evaluated collectively. This direction is useful for glass fiber–epoxy laminates because sliding damage is not controlled only by bulk strength. Surface roughness, transfer-film stability, debris adhesion, and exposed fiber abrasion all affect material loss. The most related studies, therefore, combine mechanical testing with controlled tribology and post-wear microscopy, but this complete pattern is still uneven across filler families.
Existing studies do not yet provide a direct comparison of graphite, SiC, and MoS2 within a single glass fiber–epoxy platform, using the same fabrication route, filler loading window, and mechanical–tribological response set. Many studies examine only one filler family, use waste-derived particles without direct comparison with solid lubricants, or use ceramic fillers across different matrix systems [22]. Parameter ranges also differ widely, so load, speed, sliding distance, counter face, and surface analysis cannot be directly extrapolatedfrom one work to another. In several cases, mechanical tests and tribological tests are separated, while roughness and SEM evidence are treated only as supporting observations. This creates a interpretation limitation: strength gains, friction control, wear loss, surface topography, and morphology cannot be correlatedwhen test standards, filler types, and response models are not aligned.
The present work addresses this gap using a common glass fiber–epoxy laminate framework, in which three functionally distinct fillers are compared at 2, 3, and 5 wt.% using the fabrication and testing . Graphite is treated as a carbonaceous solid lubricant, SiC as a hard ceramic load-bearing filler, and MoS2 as a lamellar solid lubricant. Mechanical response, pin-on-disc wear, coefficient of friction, surface roughness, SEM morphology, and RSM-based tribological modelling are integrated into a single design. This structure directly addresses the inconsistent filler ranges, separated property measurements, and incomplete validation patterns identified in the reviewed literature.
The objective of the present study is to determine the effects of graphite, SiC, and MoS2 fillers at 2, 3, and 5 wt.% on the mechanical response, dry sliding tribological behavior, surface preservation, and wear-related material loss of glass fiber–reinforced epoxy composites.
2. MATERIALS AND METHODS
Bidirectional woven E-glass fabric with an areal density of 220 g m−2 was used as the reinforcement. Araldite LY556 epoxy resin was used as the polymer matrix, and HY951 amine hardener was used as the curing agent. Nano-graphite powder with a stated purity of 99.5% and an average particle size of 1–2 µm, silicon carbide powder with a stated purity greater than 99.9% and an average particle size of approximately 60 µm, and molybdenum disulfide powder with a stated purity of 99.9% and an average particle size of 80–100 nm were used as functional fillers. The composite designations and filler contents used throughout the experimental work is given in Table 2, and the raw-material specifications are summarized in Table 3. The particle-size values listed in Table 3 were based on supplier specifications. Independent particle-size verification by scanning electron microscopy or laser particle-size analysis was not performed in the present experimental plan; therefore, the particle-size information was treated as supplier-reported material input data. All filler powders were dried at 60 °C for 2 h before mixing to reduce moisture uptake. The glass fabric was cut to mould dimensions and stored in sealed polyethylene covers before laying up. The resin and hardener were conditioned to laboratory temperature before use.
2.1. Sample preparation and fabrication
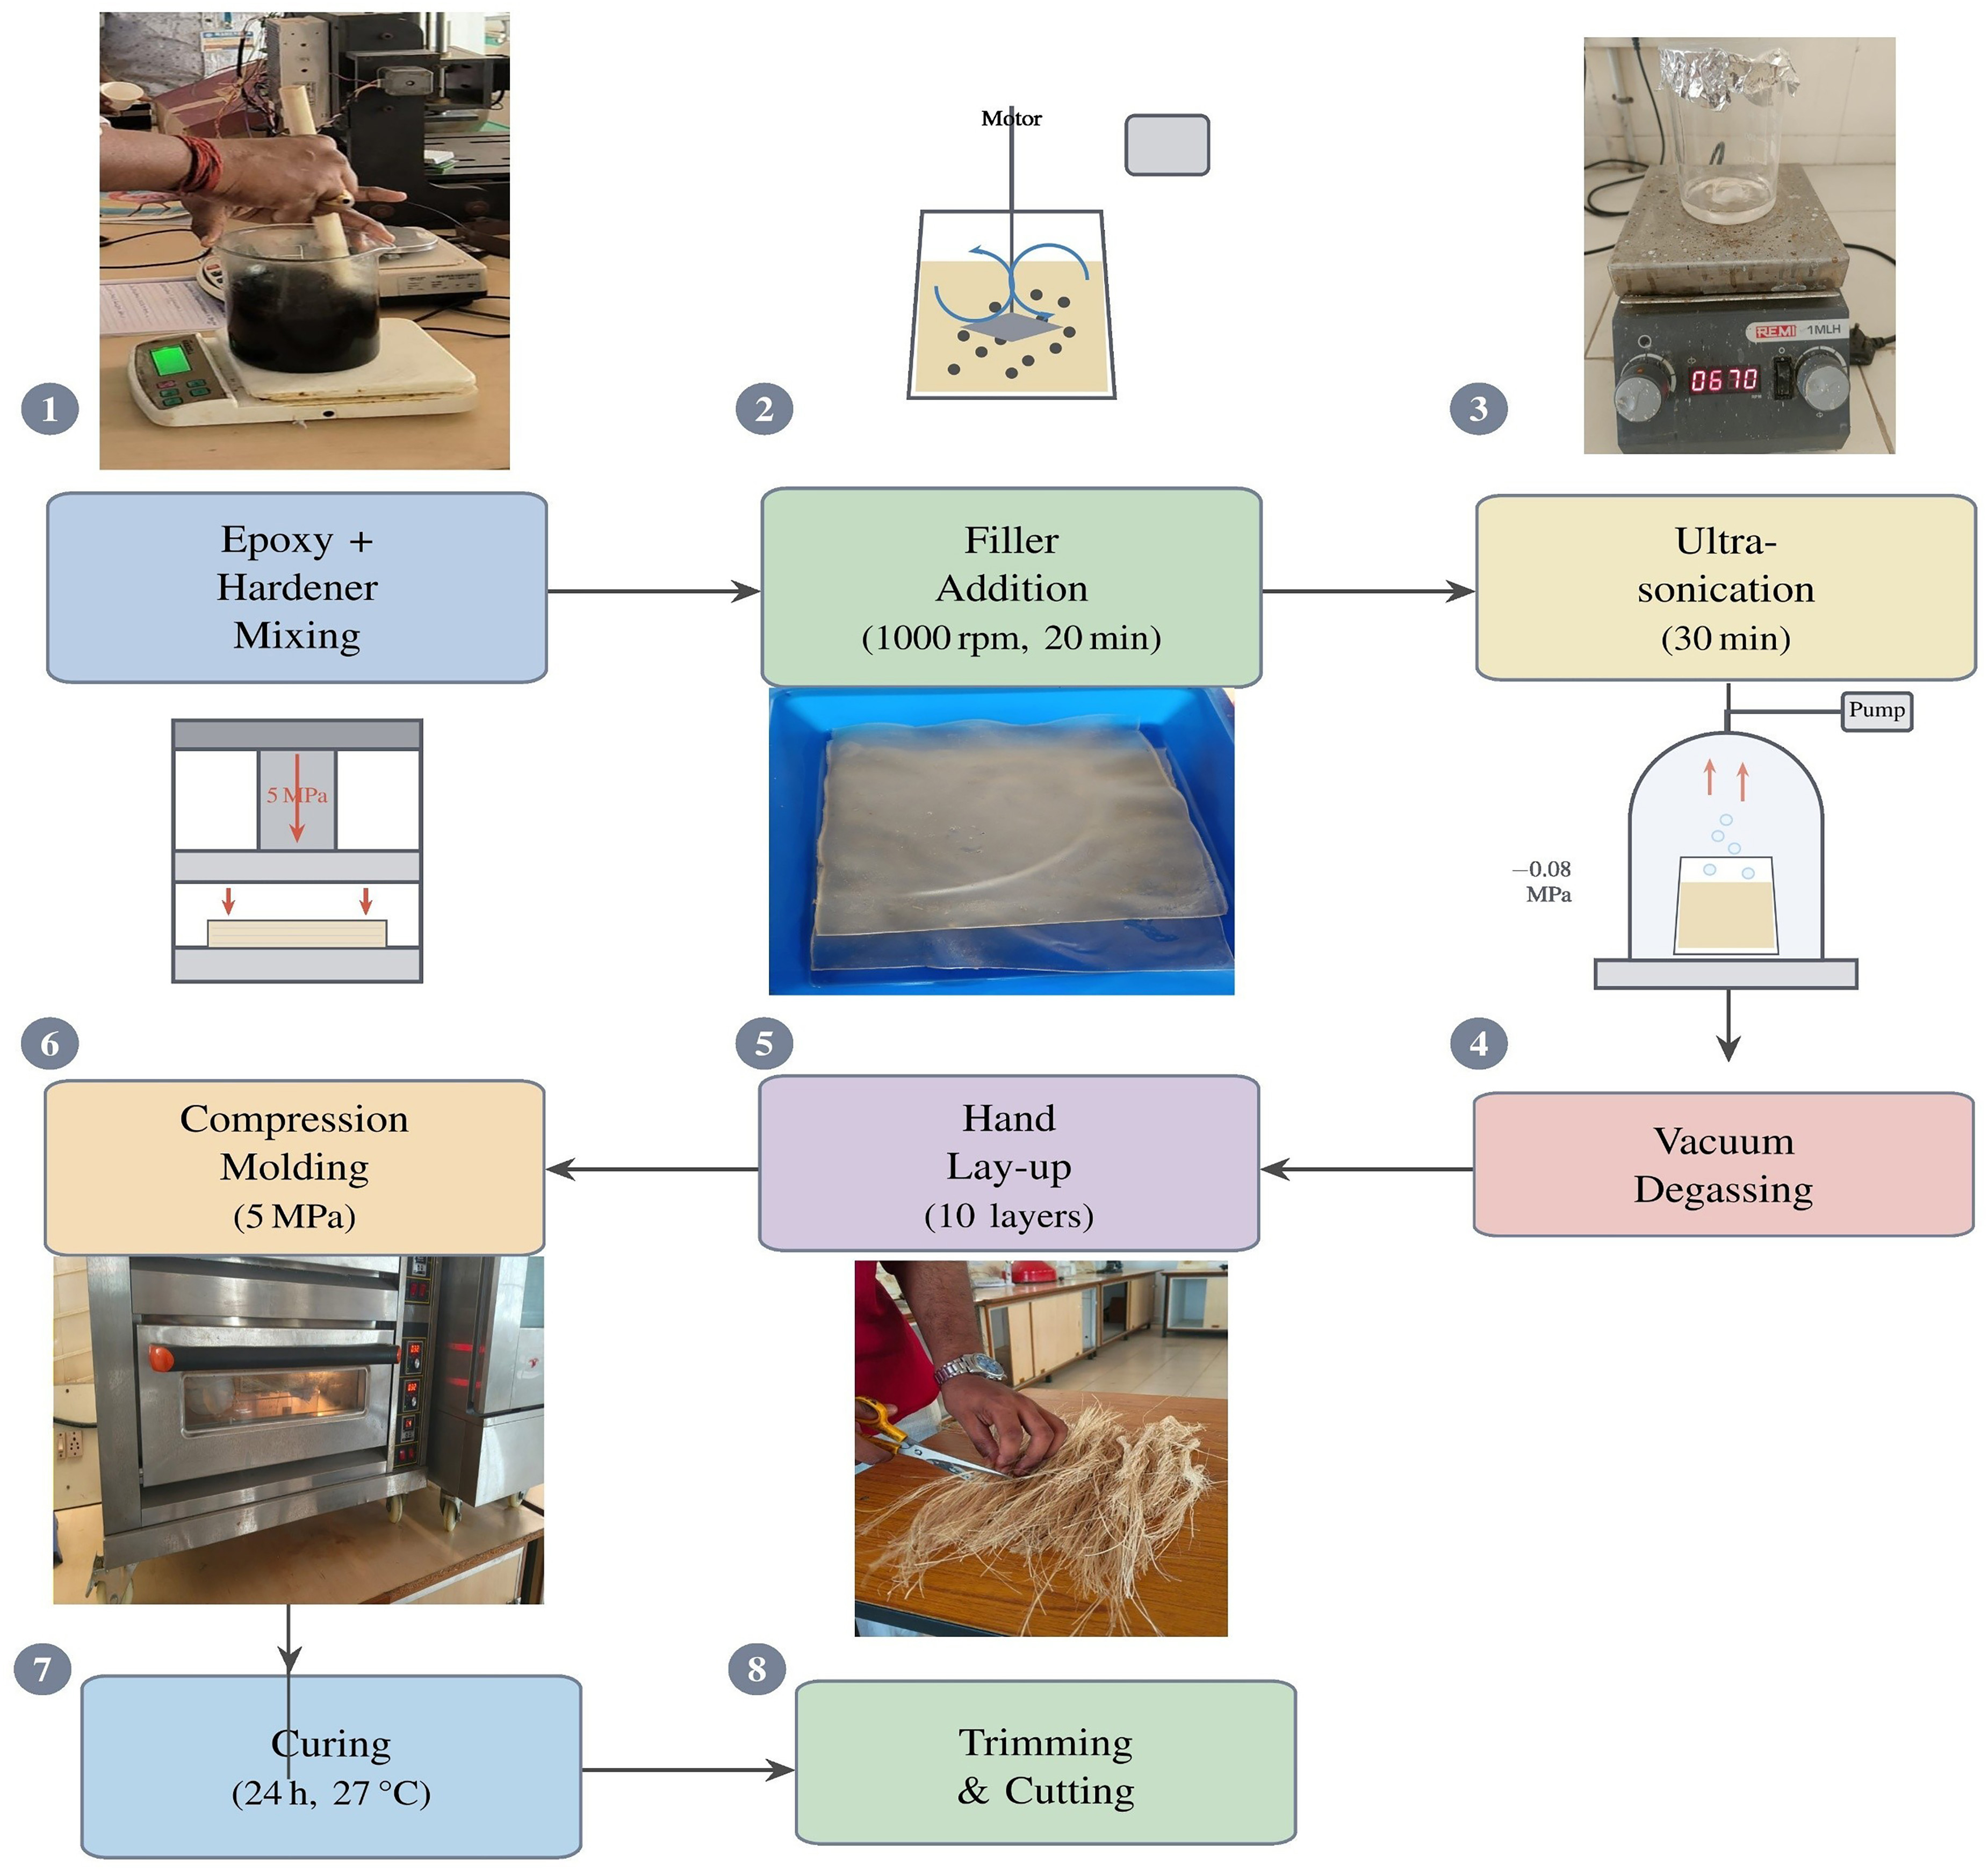
Hybrid glass fiber–reinforced epoxy laminates were fabricated by hand lay-up followed by compression molding. The complete fabrication route is illustrated in Figure 1, and the corresponding processing parameters are listed in Table 4. A flat steel mold with internal dimensions of 300 mm × 300 mm × 3 mm was used for all laminates. Ten layers of bidirectional woven E-glass fabric were used in each laminate. The epoxy-to-hardener ratio was maintained at 10:1 by mass. Filler loading was calculated relative to the epoxy matrix mass.

For each filled composition, the required quantity of graphite, SiC, or MoS2 was added to the epoxy resin and mechanically stirred at 1000 min−1 for 20 min. The filler–resin mixture was then ultrasonicated for 30 min to promote uniform distribution of the filler in the resin phase. Vacuum degassing was performed at −0.08 MPa for 10 min to remove entrapped air. After degassing, the hardener was added, and the resin system was mixed until a macroscopically homogeneous mixture was obtained.
Each glass-fabric layer was manually impregnated with the prepared resin system and stacked sequentially in the mold cavity. The stacked laminate was covered with a release film and consolidated under a compression pressure of 5 MPa. Curing was performed for 24 h at 27 ± 2 °C. No post-curing treatment was applied. After curing, the laminates were demolded, trimmed using a diamond cutter, and finished to a final thickness of 3.0 ± 0.2 mm. Mechanical stirring, ultrasonication, and vacuum degassing were used to promote filler distribution and reduce void formation. However, independent validation of bulk filler distribution by SEM–EDS mapping or XRD was not included; therefore, filler dispersion was treated as a processing-controlled condition rather than a directly quantified microstructural variable.
2.2. Specimen preparation
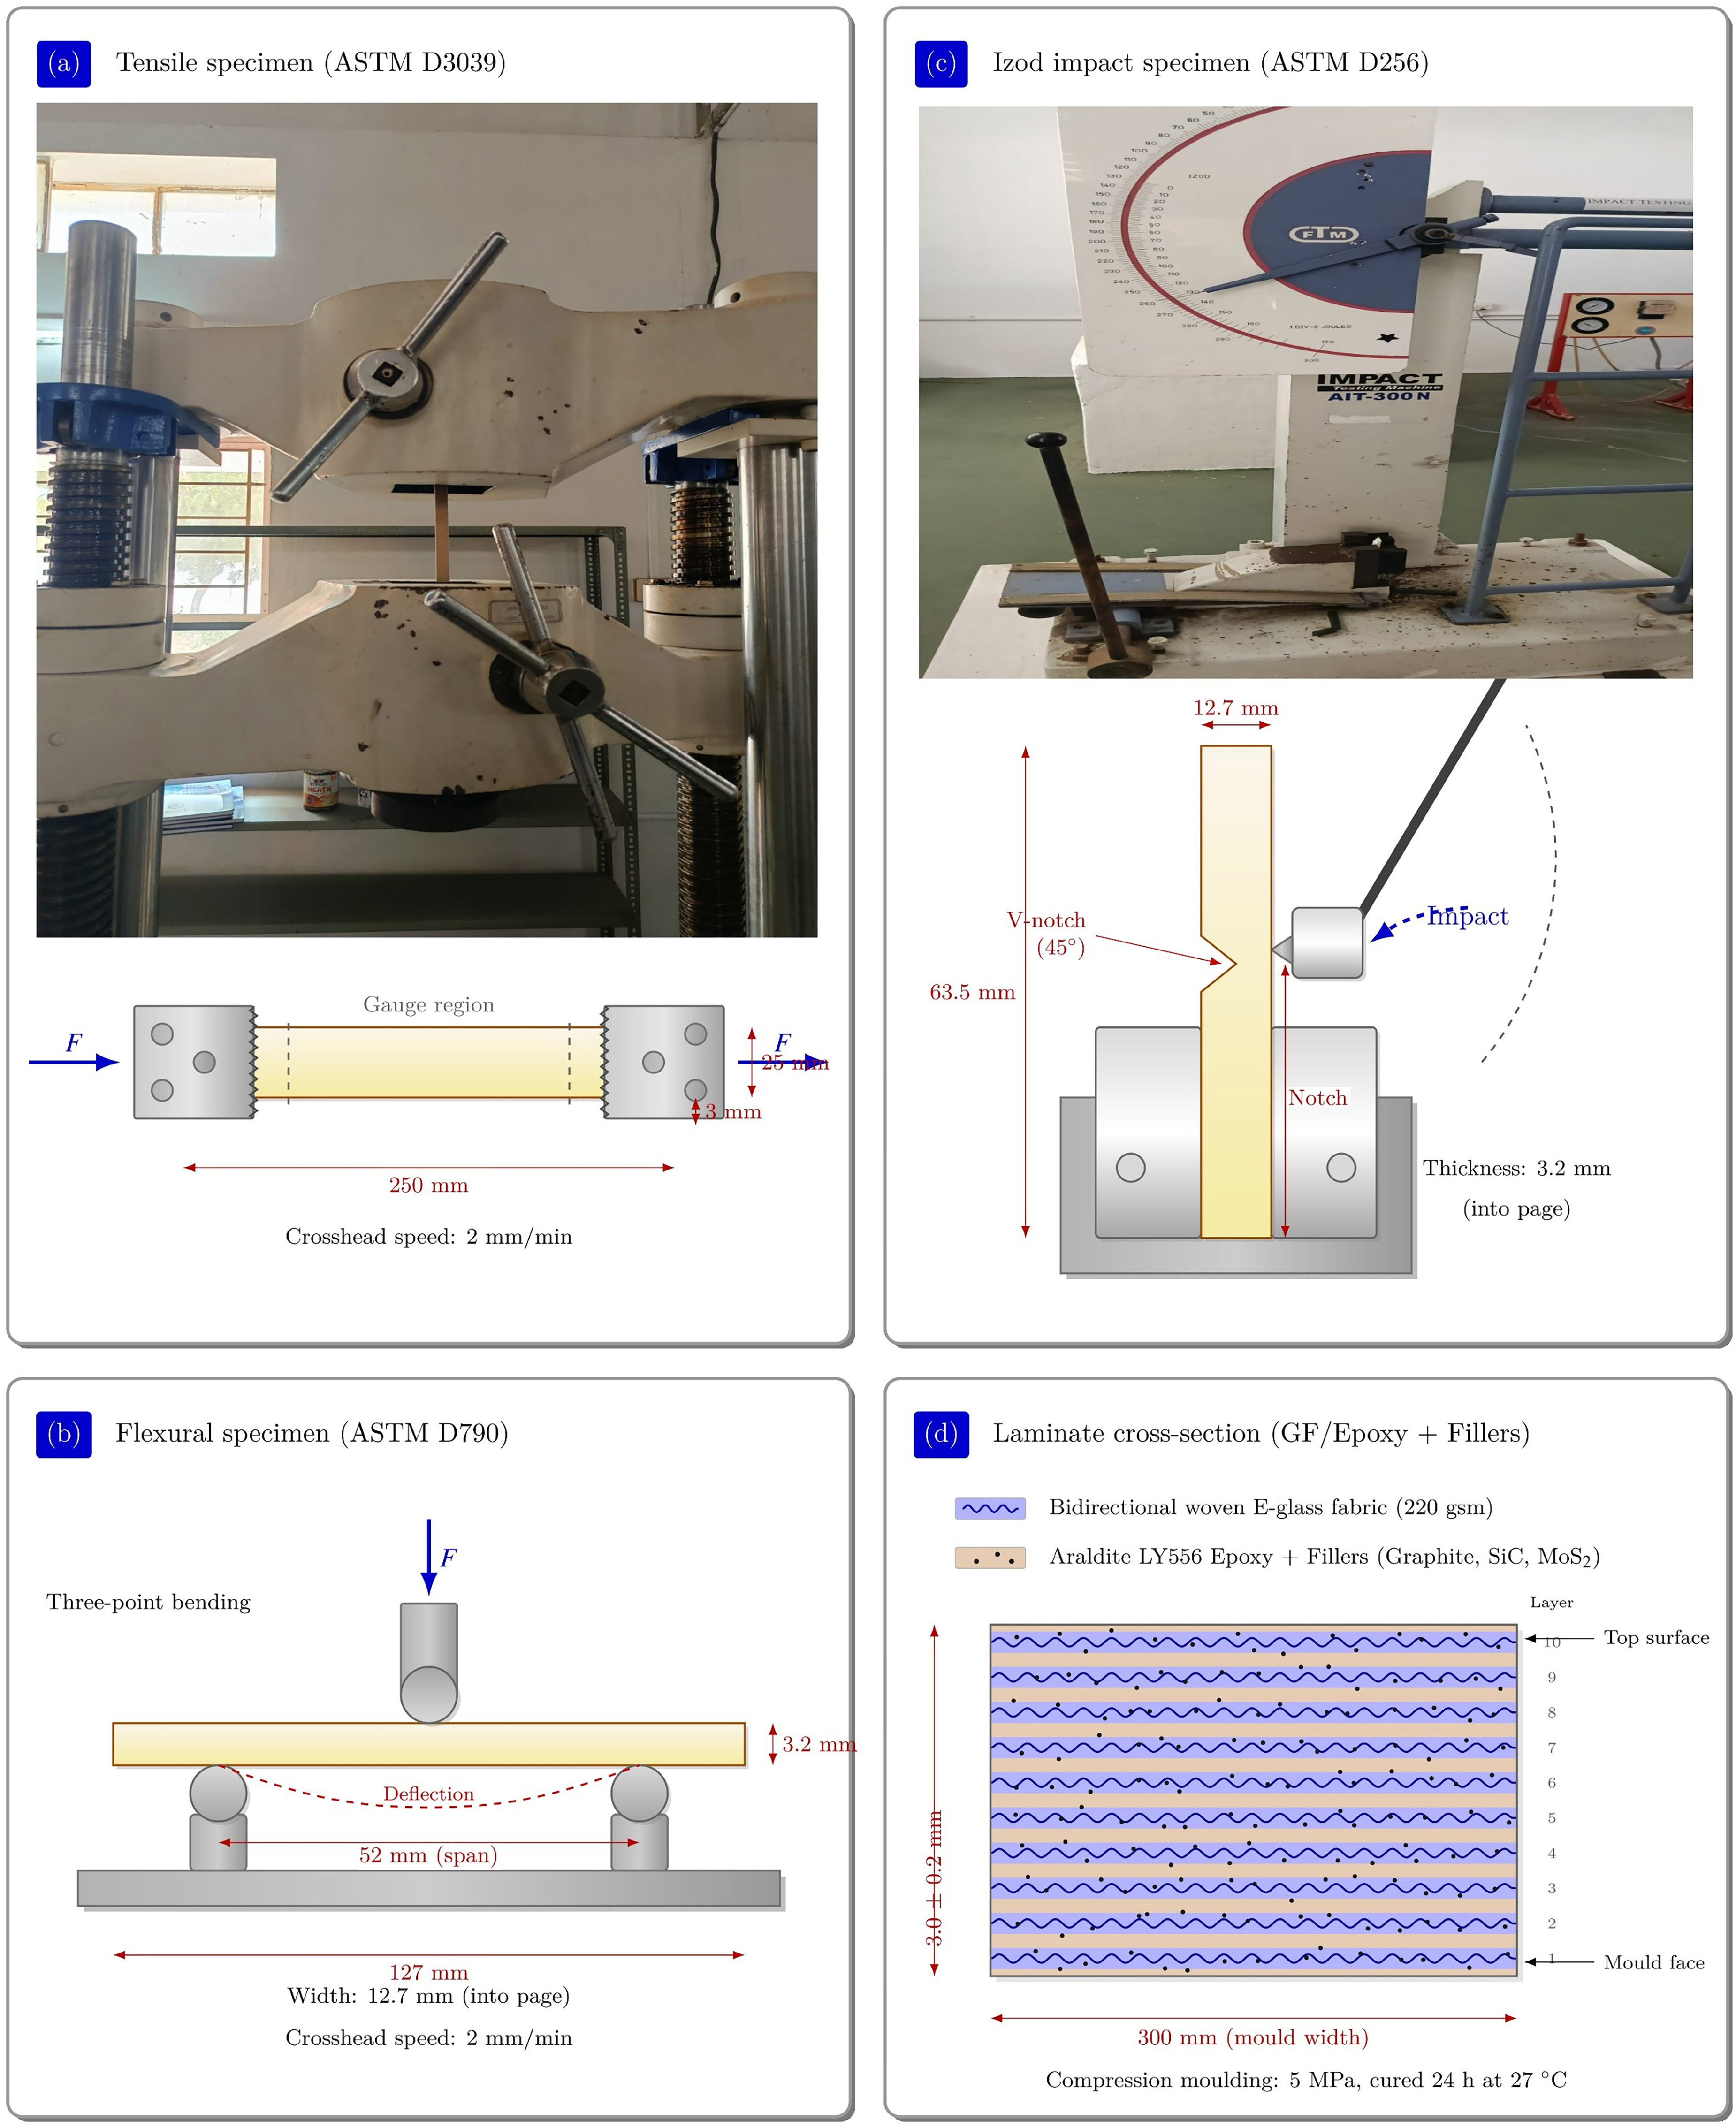
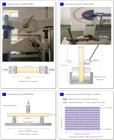
Specimens for mechanical, tribological, profilometric, and SEM characterization were cut from fully cured laminates only after consolidation, trimming, and dimensional finishing. Figure 2 shows the specimen geometries and laminate configuration used for the testing analysis, while Table 5 provides the corresponding specimen sizes and allocation. A diamond cutter was used to minimize edge damage caused by machining. Specimens with visible edge cracks, macroscopic voids, delamination, thickness non-uniformity greater than ±0.2 mm, or surface damage produced during cutting were excluded from testing. All specimens were conditioned and tested under laboratory conditions of 27 ± 2 °C and 65 ± 5% relative humidity unless otherwise stated.
2.3. Tensile, flexural, hardness, and impact testing
Tensile testing was performed according to ASTM D3039 using the specimen dimensions listed in Table 6. A Tinius Olsen HK50L universal testing machine was used, and the specimens were loaded under displacement control at a crosshead speed of 2 mm min−1. The longitudinal specimen axis was aligned parallel to the principal fabric direction [23]. Five specimens were tested for each composite group, as summarized in Table 6. The tensile strength was calculated from the maximum load and original cross-sectional area using Equation 1.
where σt is the tensile strength in MPa, Pmax is the maximum tensile load in N, b is the specimen width in mm, and t is the specimen thickness in mm.
Flexural testing was performed according to ASTM D790 using a three-point bending configuration. ASTM D790 applies to the flexural-property determination of reinforced and unreinforced plastics using a simply supported rectangular specimen loaded at the midpoint. Rectangular specimens of 127 mm × 12.7 mm × 3.2 mm were tested using the Tinius Olsen HK50L universal testing machine [24]. The support span was fixed at 52 mm and was treated as the effective gauge length for the bending test. The resulting span-to-thickness ratio was 16.25:1. The loading rate was maintained at 2 mm min−1. The loading nose was cylindrical with a radius of 5.0 mm and a diameter of 10.0 mm. The two support noses were also cylindrical, each with a radius of 5.0 mm and a diameter of 10.0 mm. The loading nose was positioned at mid-span, and the supports were symmetrically positioned about the loading axis. The flexural strength, outer-surface flexural strain, and flexural modulus were calculated using Equations 2, 3, and 4, respectively.
where σf is the flexural strength in MPa, Pmax is the maximum load in N, L is the support span in mm, b is the specimen width in mm, and d is the specimen thickness in mm.
where εf is the flexural strain, D is the mid-span deflection in mm, d is the specimen thickness in mm, and L is the support span in mm.
where Ef is the flexural modulus in MPa, m is the slope of the initial linear load–deflection curve in N mm−1, L is the support span in mm, b is the specimen width in mm, and d is the specimen thickness in mm.
Hardness measurements were performed according to ASTM D2240 using a Shore D durometer. Flat laminate coupons were used for hardness measurement [25]. The indenter was placed perpendicular to the laminate surface, and a dwell time of 15 s was maintained before recording each value. Five measurements were taken for each composite group at spatially separated locations. Edge regions and visibly damaged areas were avoided during measurement, as noted in Table 6.
Impact testing was performed according to ASTM D256 using notched Izod specimens of 63.5 mm × 12.7 mm × 3.2 mm. ASTM D256 covers Izod pendulum impact resistance of plastics using notched specimens under specified mounting and impact conditions. The reported values correspond to notched Izod impact strength. A V-notch was machined across one longitudinal edge of each specimen. The notch angle was 45°, and the notch-tip radius was 0.25 mm. The notch root was oriented perpendicular to the specimen length and perpendicular to the impact direction [26]. The specimen longitudinal axis was aligned parallel to the principal 0° glass-fabric direction. During testing, the notched face was oriented toward the pendulum striker. A 5.5 J pendulum was used for impact loading. Five notched specimens were tested for each composite group. The notched Izod impact strength was calculated using Equation 5.
where Is is the notched Izod impact strength in kJ m−2, is the absorbed impact energy in J, b is the remaining ligament width at the notch section in mm, and t is the specimen thickness in mm. Unit conversion was applied to express the final value in kJ m−2.
2.4. Dry sliding wear testing
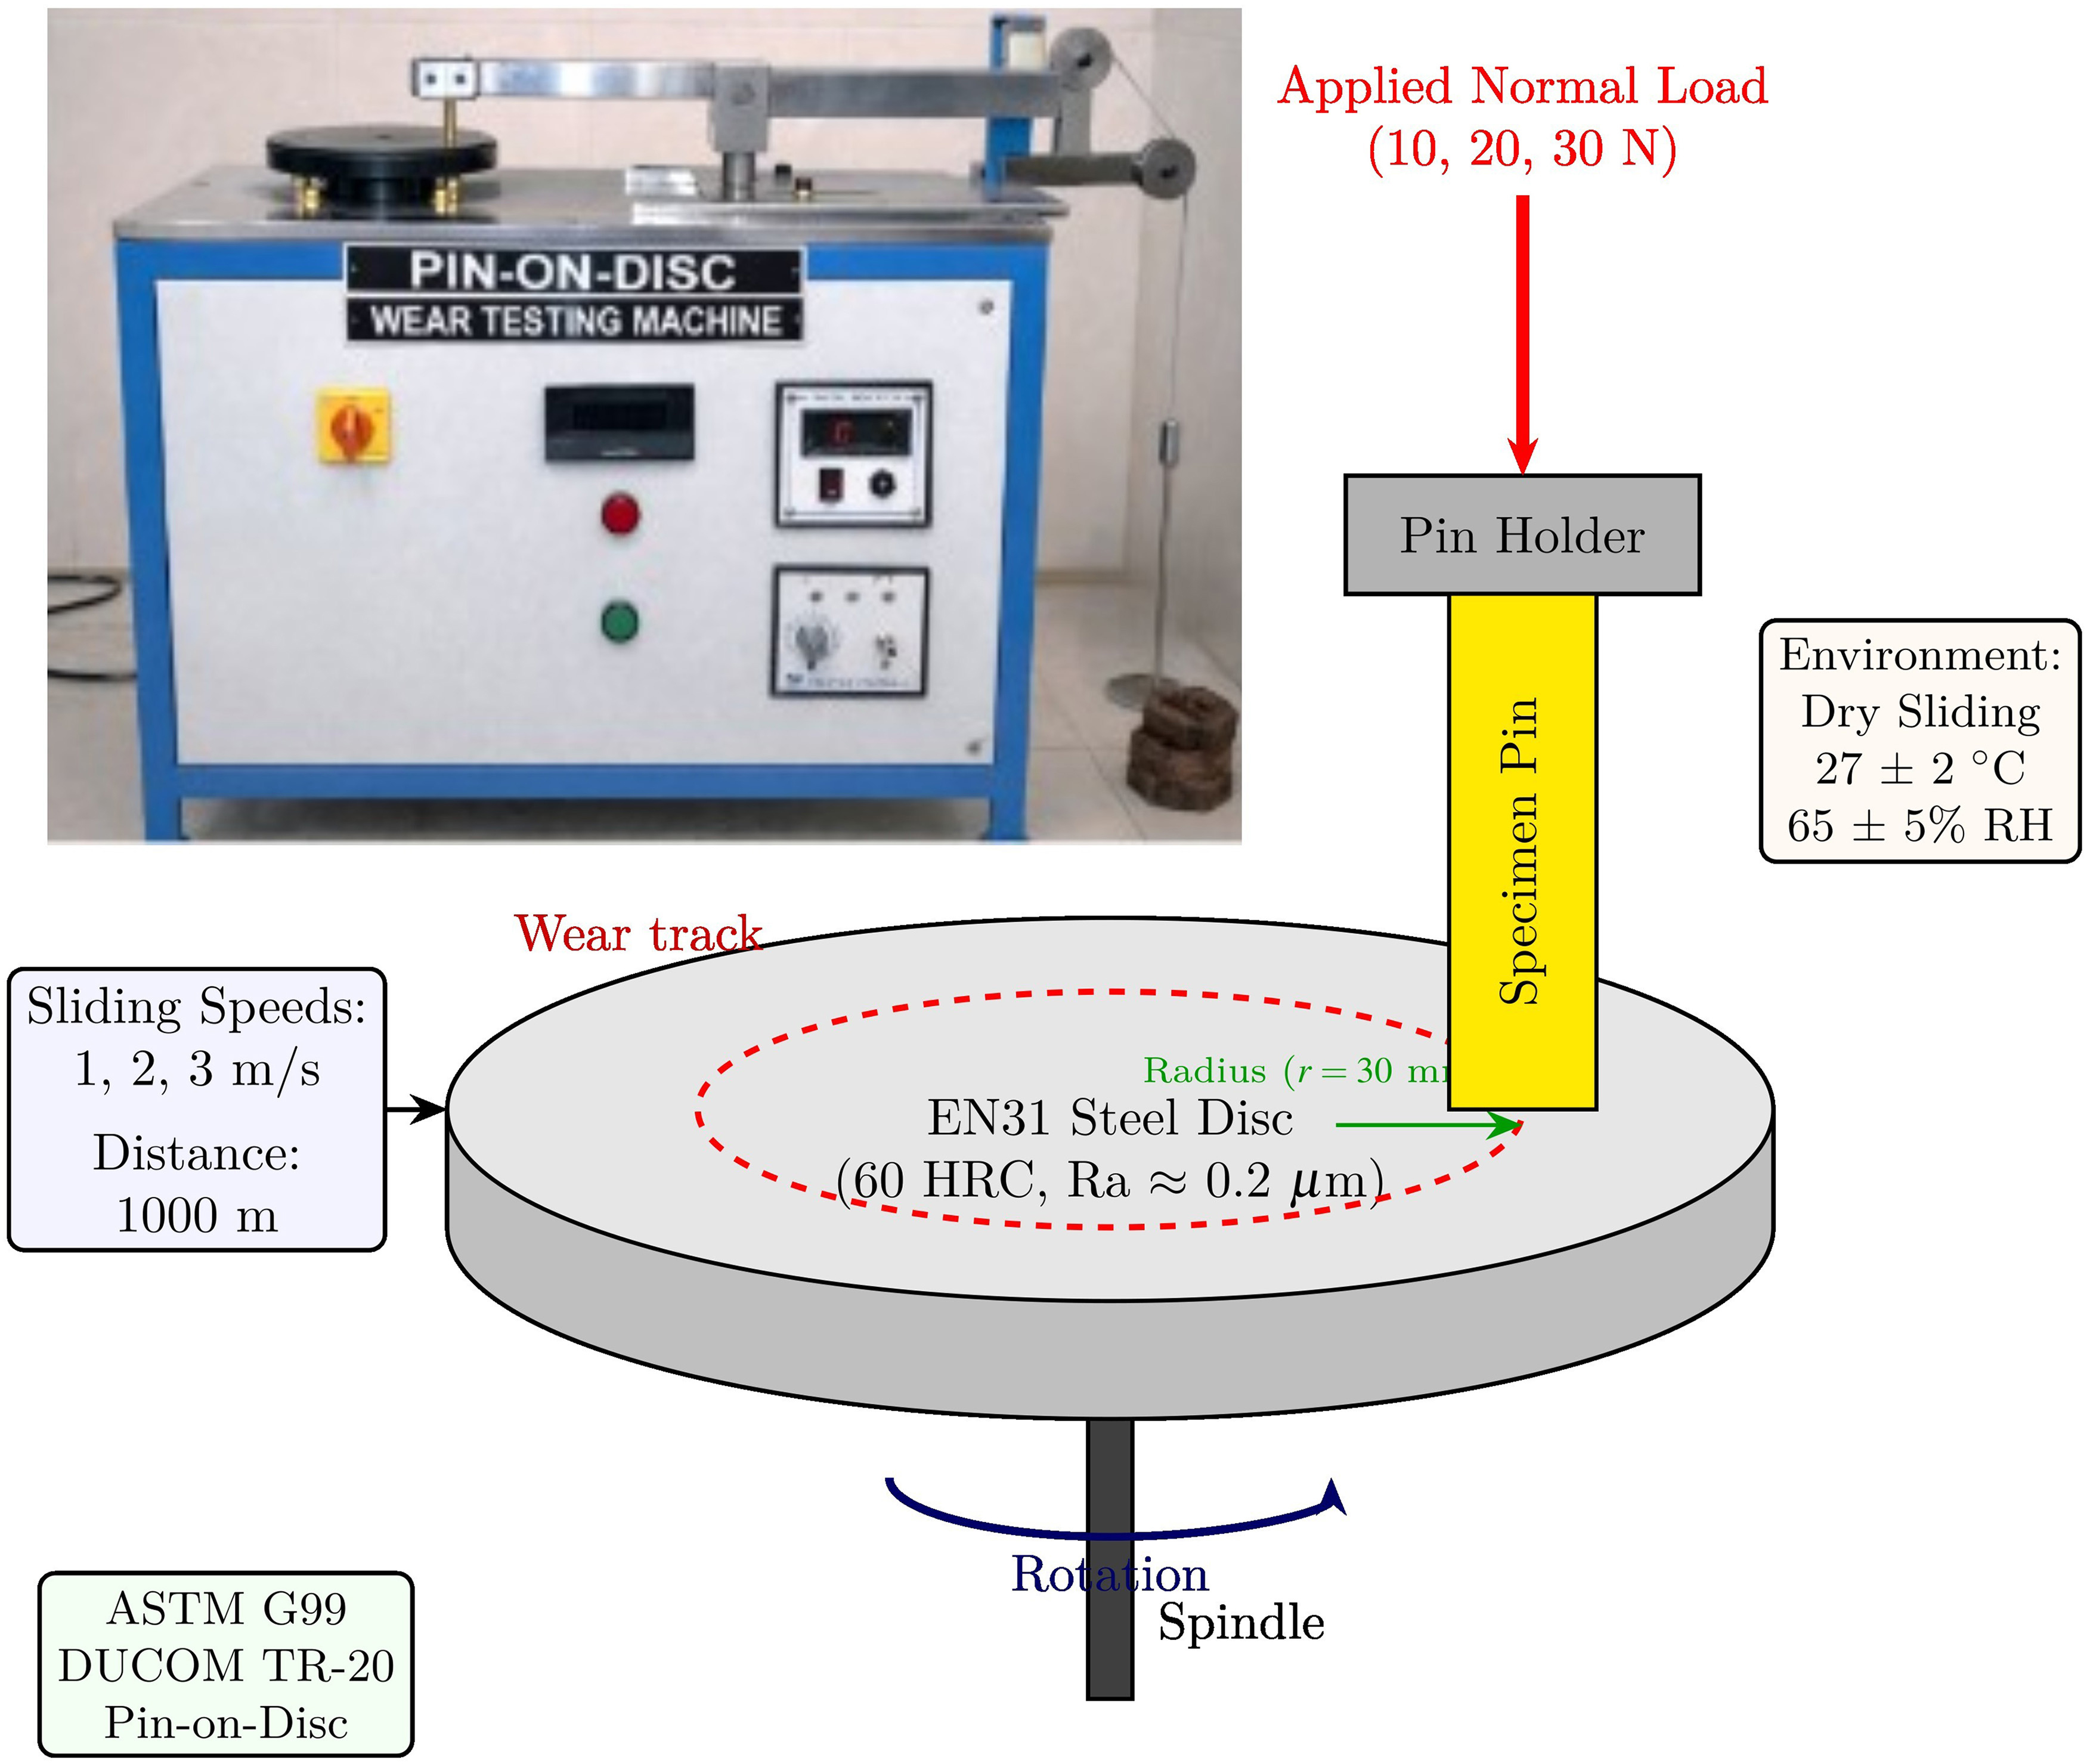
Dry sliding tribological behavior was evaluated in accordance with ASTM G99 using a DUCOM TR-20 pin-on-disc tribometer. ASTM G99 is intended for wear and friction testing using pin-on-disc or ball-on-disc apparatus, with wear response depending on load, speed, distance, environment, machine characteristics, and material properties. Figure 3 shows the tribometer configuration, including the specimen holder, EN31 steel counter face, normal-load direction, sliding track, and environmental condition. The experimental boundary conditions used for the pin-on-disc tests are listed in Table 7.
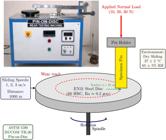
Rectangular laminate pins of 10 mm × 10 mm × 3 mm were used as wear specimens. The nominal apparent contact area was 100 mm2. The counter face was an EN31 steel disc with a hardness of 60 HRC and an initial surface roughness of Ra 0.2 µm. Applied normal loads of 10, 20, and 30 N were used. Sliding speeds of 1, 2, and 3 m s−1 were applied. The sliding distance was fixed at 1000 m for each run, and the wear-track diameter was maintained at 60 mm. The corresponding track radius was 30 mm. Three repeated runs were conducted for each composite group at each load–speed condition. A fresh contact location was used for each repeated run to prevent overlap between previous and subsequent wear tracks [27].
The full tribological matrix comprised 10 composite groups, 3 load levels, 3 sliding speeds, and 3 repeated runs per condition, yielding a total of 270 wear runs . All tribological tests were performed under dry sliding conditions at 27 ± 2 °C and 65 ± 5% relative humidity. The selected load range of 10–30 N was used to maintain controlled low-to-moderate contact severity during comparative filler evaluation. Although higher loads such as 200–400 N are relevant for heavy-duty tribological applications, severe-load wear testing was outside the scope of the present comparative study. Future work should extend the load range to 200–400 N to evaluate the durability of the optimized filler systems under high-load service conditions.
Before and after each wear run, the composite specimen and steel disc were cleaned with acetone and allowed to dry. Specimen mass was measured before and after testing using an analytical balance with a readability of 0.1 mg. The tribometer alignment, normal-load application, and spindle rotation stability was verified before each test series. The nominal contact pressure, rotational speed, and total number of disc revolutions were calculated using Equations 6, 7, and 8, respectively.
where p is the nominal contact pressure in MPa, FN is the applied normal load in N, and Ac is the apparent contact area in mm2. For the 10 mm × 10 mm rectangular wear specimens, Ac was 100 mm2.
where N is the disc rotational speed in min−1, V is the sliding speed in m s−1, and dt is the wear-track diameter in m.
where n is the number of disc revolutions, D is the sliding distance in m, and dt is the wear-track diameter in m.
2.5. Density measurement, wear rate, and friction calculation
The Archimedes principle was used to measure composite density before wear-volume and specific-wear-rate calculations. The density-measurement variables and wear data-reduction terms are defined in Table 8. For each material group, the dry specimen mass in air and the apparent immersed mass were measured. Density was calculated using Equation 9.
where ρ is the composite density in g cm−3, mα is the dry specimen mass in air in g, mi is the apparent specimen mass in the immersion medium in g, and ρi is the density of the immersion medium in g cm−3.
Mass loss after sliding was calculated using Equation 10, and wear volume loss was then obtained from Equation 11.
where Δm is the mass loss, m0 is the initial specimen mass before sliding, and m1 is the final specimen mass after sliding.
where ΔV is the wear volume loss in mm3, Δm is the mass loss expressed in units consistent with density, and ρ is the composite density.
The specific wear rate was calculated using Equation 12 with the applied normal load and sliding distance, respectively.
where Ks is the specific wear rate in mm3 N−1 m−1, ΔV is the wear volume loss in mm3, FN is the applied normal load in N, and D is the sliding distance in m.
The tribometer recorded the friction force during sliding. The coefficient of friction was calculated from the measured tangential friction force using Equation 13. The reported coefficient of friction for each condition was obtained from the steady-state portion of the friction–time response, after excluding the initial running-in interval.
where μ is the coefficient of friction, Ff is the tangential friction force in N, and FN is the applied normal load in N.
2.6. Surface roughness and SEM examination
Surface roughness of the worn specimens was measured using a Mahr Surf GD120 contact profilometer. The profilometry settings and SEM conditions are summarized in Table 9. The arithmetic average roughness, Rα, was used as the roughness parameter. A cut-off length of 0.8 mm and an evaluation length of 4 mm were used. Three traces were recorded at separate locations across the wear track for each worn surface, and the average value was used for analysis. The profilometer was checked for zero setting and stylus response before each measurement batch. The arithmetic average roughness was defined using Equation 14.
where Rα is the arithmetic average roughness in µm, L is the evaluation length in mm, and z(x) is the surface-height deviation from the mean line at position x.
Worn surfaces were examined using a Carl Zeiss EVO 18 Research scanning electron microscope operated at 20 kV, as listed in Table 9. Secondary electron imaging was used, with magnifications ranging from 100× to 5000×. Before SEM examination, the worn specimens were ultrasonically cleaned in ethanol for 10 min, dried, and gold sputter-coated to improve surface conductivity. SEM examination was directed toward identifying surface features produced during dry sliding, including fibre pull-out, matrix cracking, interfacial debonding, abrasion grooves, transfer-layer formation, and wear-debris adhesion.
2.7. Calibration, data acquisition, and quality assurance
Instrument readiness was verified before testing, and the quality-control procedures are summarized in Table 10. The universal testing machine was checked for load-cell zero, crosshead displacement, and grip alignment before tensile and flexural testing. The Shore D durometer was checked against a reference block before hardness measurement. The Izod impact tester was checked for pendulum zero position and free-swing condition before impact testing. The pin-on-disc tribometer was checked for spindle rotation, normal-load application, fixture alignment, and track-radius positioning before each test series. The analytical balance was verified using standard calibration weights before mass-loss measurement. The profilometer was checked using its reference setting before each roughness-measurement batch. SEM sample preparation was standardized by maintaining fixed cleaning, drying, and coating procedures for all worn specimens.
Load and displacement data for tensile and flexural tests were acquired through the universal testing machine . Maximum load was used for strength calculation in Equations 1 and 2. Friction-force data were acquired using the tribometer data-acquisition system during pin-on-disc testing and were converted to coefficient of friction using Equation 13. Initial transient running-in data were excluded from the steady-state average. Mass-loss data was obtained from pre-test and post-test balance readings and were used for Equations 10-12. Surface roughness was calculated from profilometer traces using the instrument software and Equation 14. For each measured response, replicate values were screened for evident experimental errors caused by specimen slippage, fixture misalignment, visible specimen damage before testing, or data-acquisition failure. No smoothing was applied to mechanical load–displacement data before the extraction of maximum load. For friction data, only the stable sliding region was averaged for coefficient-of-friction reporting.
2.8. Statistical analysis and response surface methodology
The statistical treatment and repeatability criteria are given in Table 11. Five replicate specimens were used for each mechanical property in each composite group. Three repeated runs were used for each tribological condition, and three roughness traces were recorded for each worn surface. Results were expressed as mean ± standard deviation. One-way analysis of variance was performed to evaluate differences among composite groups, and Tukey’s post hoc test was applied for multiple comparisons. Statistical significance was defined using Equation 15.
Response surface methodology was used to model the effects of applied normal load and sliding speed on tribological responses for selected representative composites. The factor levels and coded variable definitions are listed in Table 12, and the analyzed responses are listed in Table 13. The applied normal load was varied at 10, 20, and 30 N, while the sliding speed was varied at 1, 2, and 3 m s−1. The coded load factor and coded speed factor were defined using Equations 16 and 17, respectively.
where A is the coded load factor and FN is the applied normal load in N.
where B is the coded sliding-speed factor and V is the sliding speed in m s−1.
A second-order polynomial model was fitted for each tribological response using Equation 18. Model adequacy was evaluated using the coefficient of determination, model p-value, residual behavior, and agreement between predicted and actual values.
where Y is the predicted response, β0 is the intercept, β1 and β2 are the linear coefficients, β12 is the interaction coefficient, and β11 and β22 are the quadratic coefficients.
2.9. Uncertainty analysis
Measurement uncertainty was estimated from instrument resolution and replicate variability. The measurement-resolution inputs used for uncertainty evaluation are summarized in Table 14. For each response, the sample standard deviation of repeated measurements was calculated using Equation 19.
where S is the sample standard deviation, xi is an individual measured value, is the mean value, and n is the number of replicate measurements.
The standard error of the mean was calculated using Equation 20.
where SE is the standard error, s is the sample standard deviation, and n is the number of replicates.
For the calculated wear volume, uncertainty propagation was considered based on mass loss and density using Equation 21.
where uΔV is the standard uncertainty in wear volume loss, uΔm is the standard uncertainty in mass loss, uρ is the standard uncertainty in density, Δm is mass loss, and ρ is density.
For the specific wear rate, uncertainty propagation was considered using Equation 22.
where uKs is the standard uncertainty in specific wear rate, uΔV is the uncertainty in wear volume loss, uFN is the uncertainty in applied normal load, uD is the uncertainty in sliding distance, ΔV is wear volume loss, FN is applied normal load, and is D sliding distance.
Specimen preparation, conditioning, cleaning, and testing procedures were maintained consistently across all composite groups. A fresh or unworn contact region was used for each wear repeat. The steel disc and composite specimens were cleaned with acetone before and after wear testing. The same counter face material, track diameter, sliding distance, and environmental condition were used for all wear experiments. Mechanical specimens were visually inspected before testing, and those with edge damage, gross voids, delamination, or improper dimensions were rejected in accordance with the criteria described in Section 2.3. Profilometry traces were collected from separate regions of each wear track. SEM specimens were cleaned, dried, and coated using the same procedure listed in Table 8.
3. RESULTS AND DISCUSSION
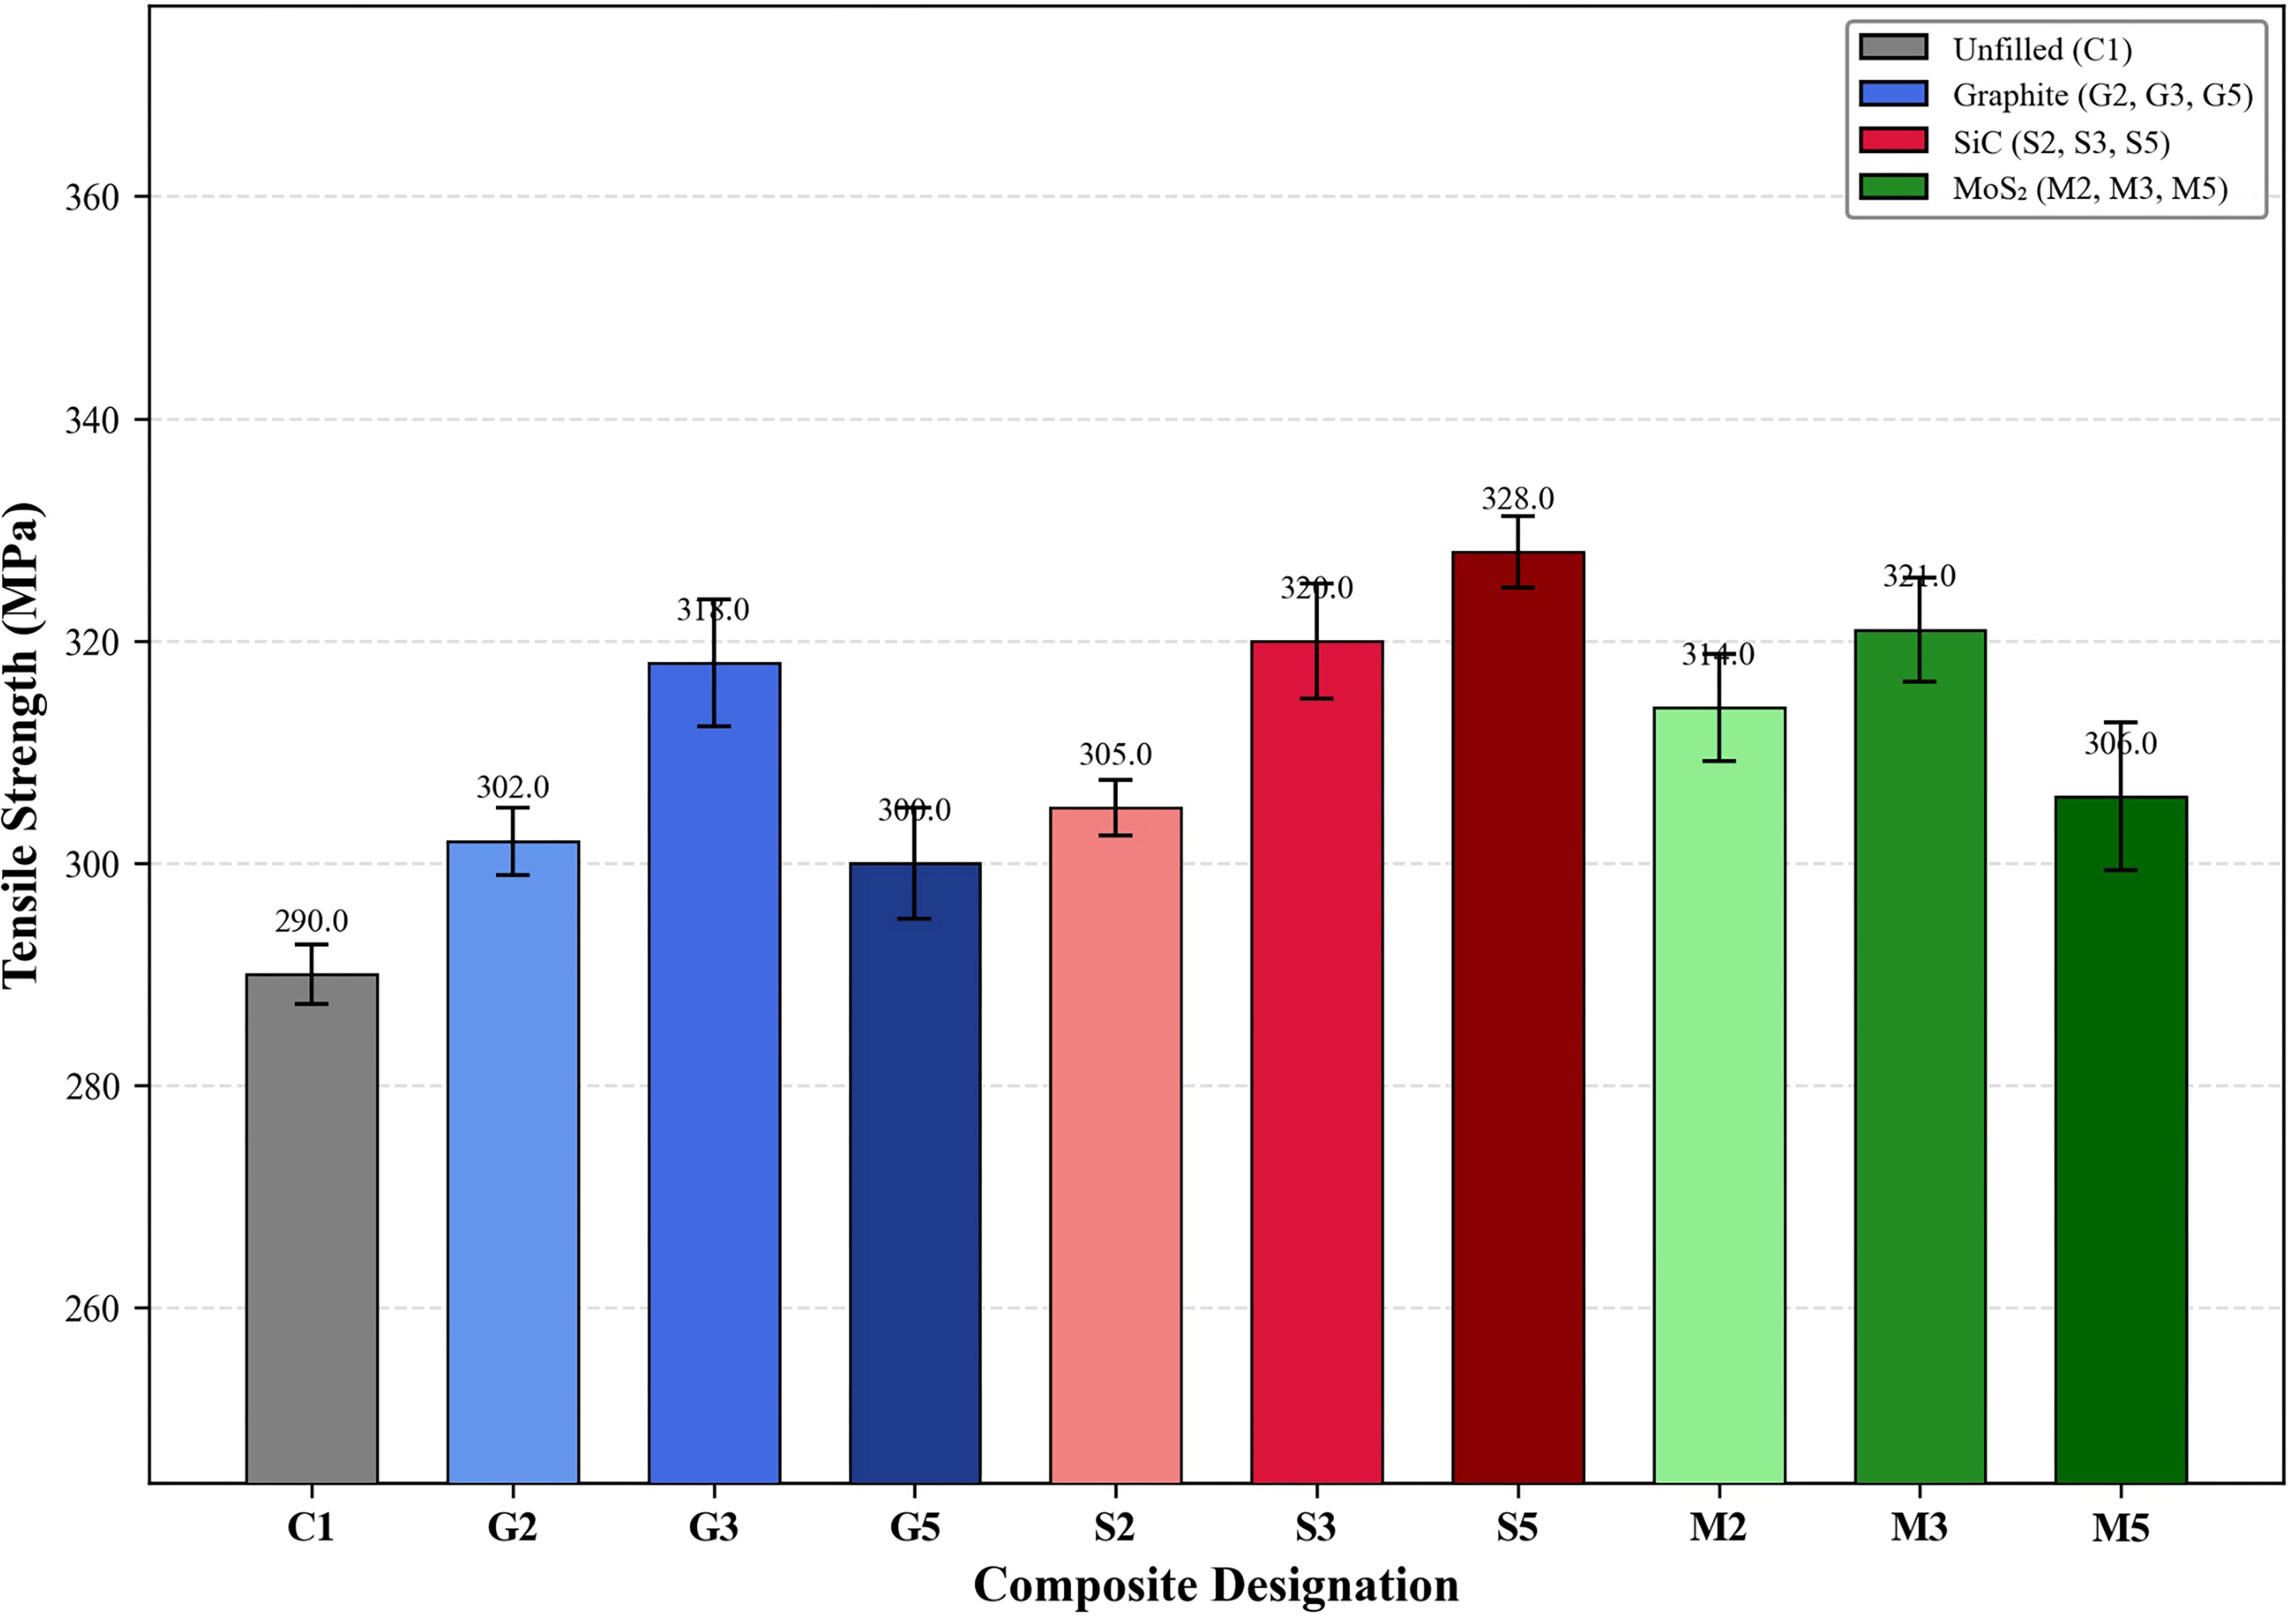
Figure 4 shows the tensile-strength response of 10 composite formulations tested according to ASTM D3039 at a crosshead speed of 2 mm/min. The unfilled baseline C1 had a mean tensile strength of 290 MPa, serving as the reference for evaluating filler-induced modifications. Within the graphite series, G3 (3 wt.%) achieved the highest tensile strength of 318 MPa, representing a 9.7% improvement over C1, while G5 (5 wt.%) declined to 300 MPa, indicating that excessive graphite loading introduced agglomeration-related stress concentrators that compromised load transfer efficiency. The SiC series exhibited a monotonic increase in tensile strength with filler content, with S5 (5 wt.%) recording the maximum value of 328 MPa—a 13.1% enhancement over C1—attributable to the superior intrinsic stiffness and hardness of SiC particles that strengthened the matrix phase and improved fibre–matrix interfacial stress distribution. The MoS2 series followed a non-monotonic trend, with M3 (3 wt.%) reaching 321 MPa before declining to 306 MPa at M5 (5 wt.%), suggesting that the soft, lamellar nature of MoS2 provides effective reinforcement at moderate concentrations but induces interfacial shear weakness when agglomerated at higher loadings. The statistically significant difference among groups (ANOVA F = 33.11, p < 0.001), with S5 identified as the highest-performing formulationby Tukey post hoc analysis, confirms that hard-particle reinforcement with SiC delivers the most consistent improvement in tensile strength. These findings indicate that the reinforcement mechanism is governed by filler rigidity, dispersion quality, and interfacial adhesion rather than filler content alone [28].
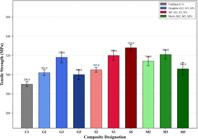
Tensile strength of glass fiber/epoxy composites reinforced with graphite, SiC, and MoS₂ fillers at 2, 3, and 5 wt.% loadings compared against the unfilled baseline.
Figure 5 shows the flexural strength of all composite variants evaluated under three-point bending, according to ASTM D790, with a support span of 52 mm and a crosshead speed of 2 mm/min. The unfilled composite C1 exhibited a baseline flexural strength of 380 MPa. Among graphite-filled composites, G3 (3 wt.%) attained the peak value of 415 MPa, a 9.2% increase over C1, whereas G5 (5 wt.%) decreased to 400 MPa, consistent with filler agglomeration degrading the matrix continuity required for efficient bending load resistance. The SiC-filled series demonstrated the strongest flexural response, with S5 (5 wt.%) reaching 438 MPa,a 15.3% improvement representing the highest flexural strength across all formulations. The progressive increase from S2 (405 MPa) through S3 (425 MPa) to S5 (438 MPa) indicates that the high elastic modulus of SiC particles effectively constrains matrix deformation under compressive and tensile stress fields that develop during bending. In the MoS2 series, M3 (3 wt.%) recorded 420 MPa, declining to 405 MPa at M5 (5 wt.%), which mirrors the non-monotonic behavior observed in the tensile response and reinforces the hypothesis that lamellar MoS2 agglomerates at higher concentrations introduce weak shear planes that compromise flexural load transfer. The statistically significant inter-group variation (ANOVA F = 16.42, p < 0.001) and identification of S5 as the best-performing formulation confirm that rigid particulate fillers enhance flexural resistance more effectively than soft solid lubricants. The consistent superiority of the SiC series across both tensile and flexural modes underscores its role in improving matrix stiffness and interfacial bonding within the composite laminate [29].
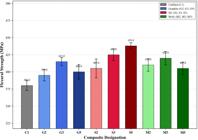
Flexural strength of glass fiber/epoxy composites with graphite, SiC, and MoS₂ fillers at varying weight fractions under three-point bending conditions.
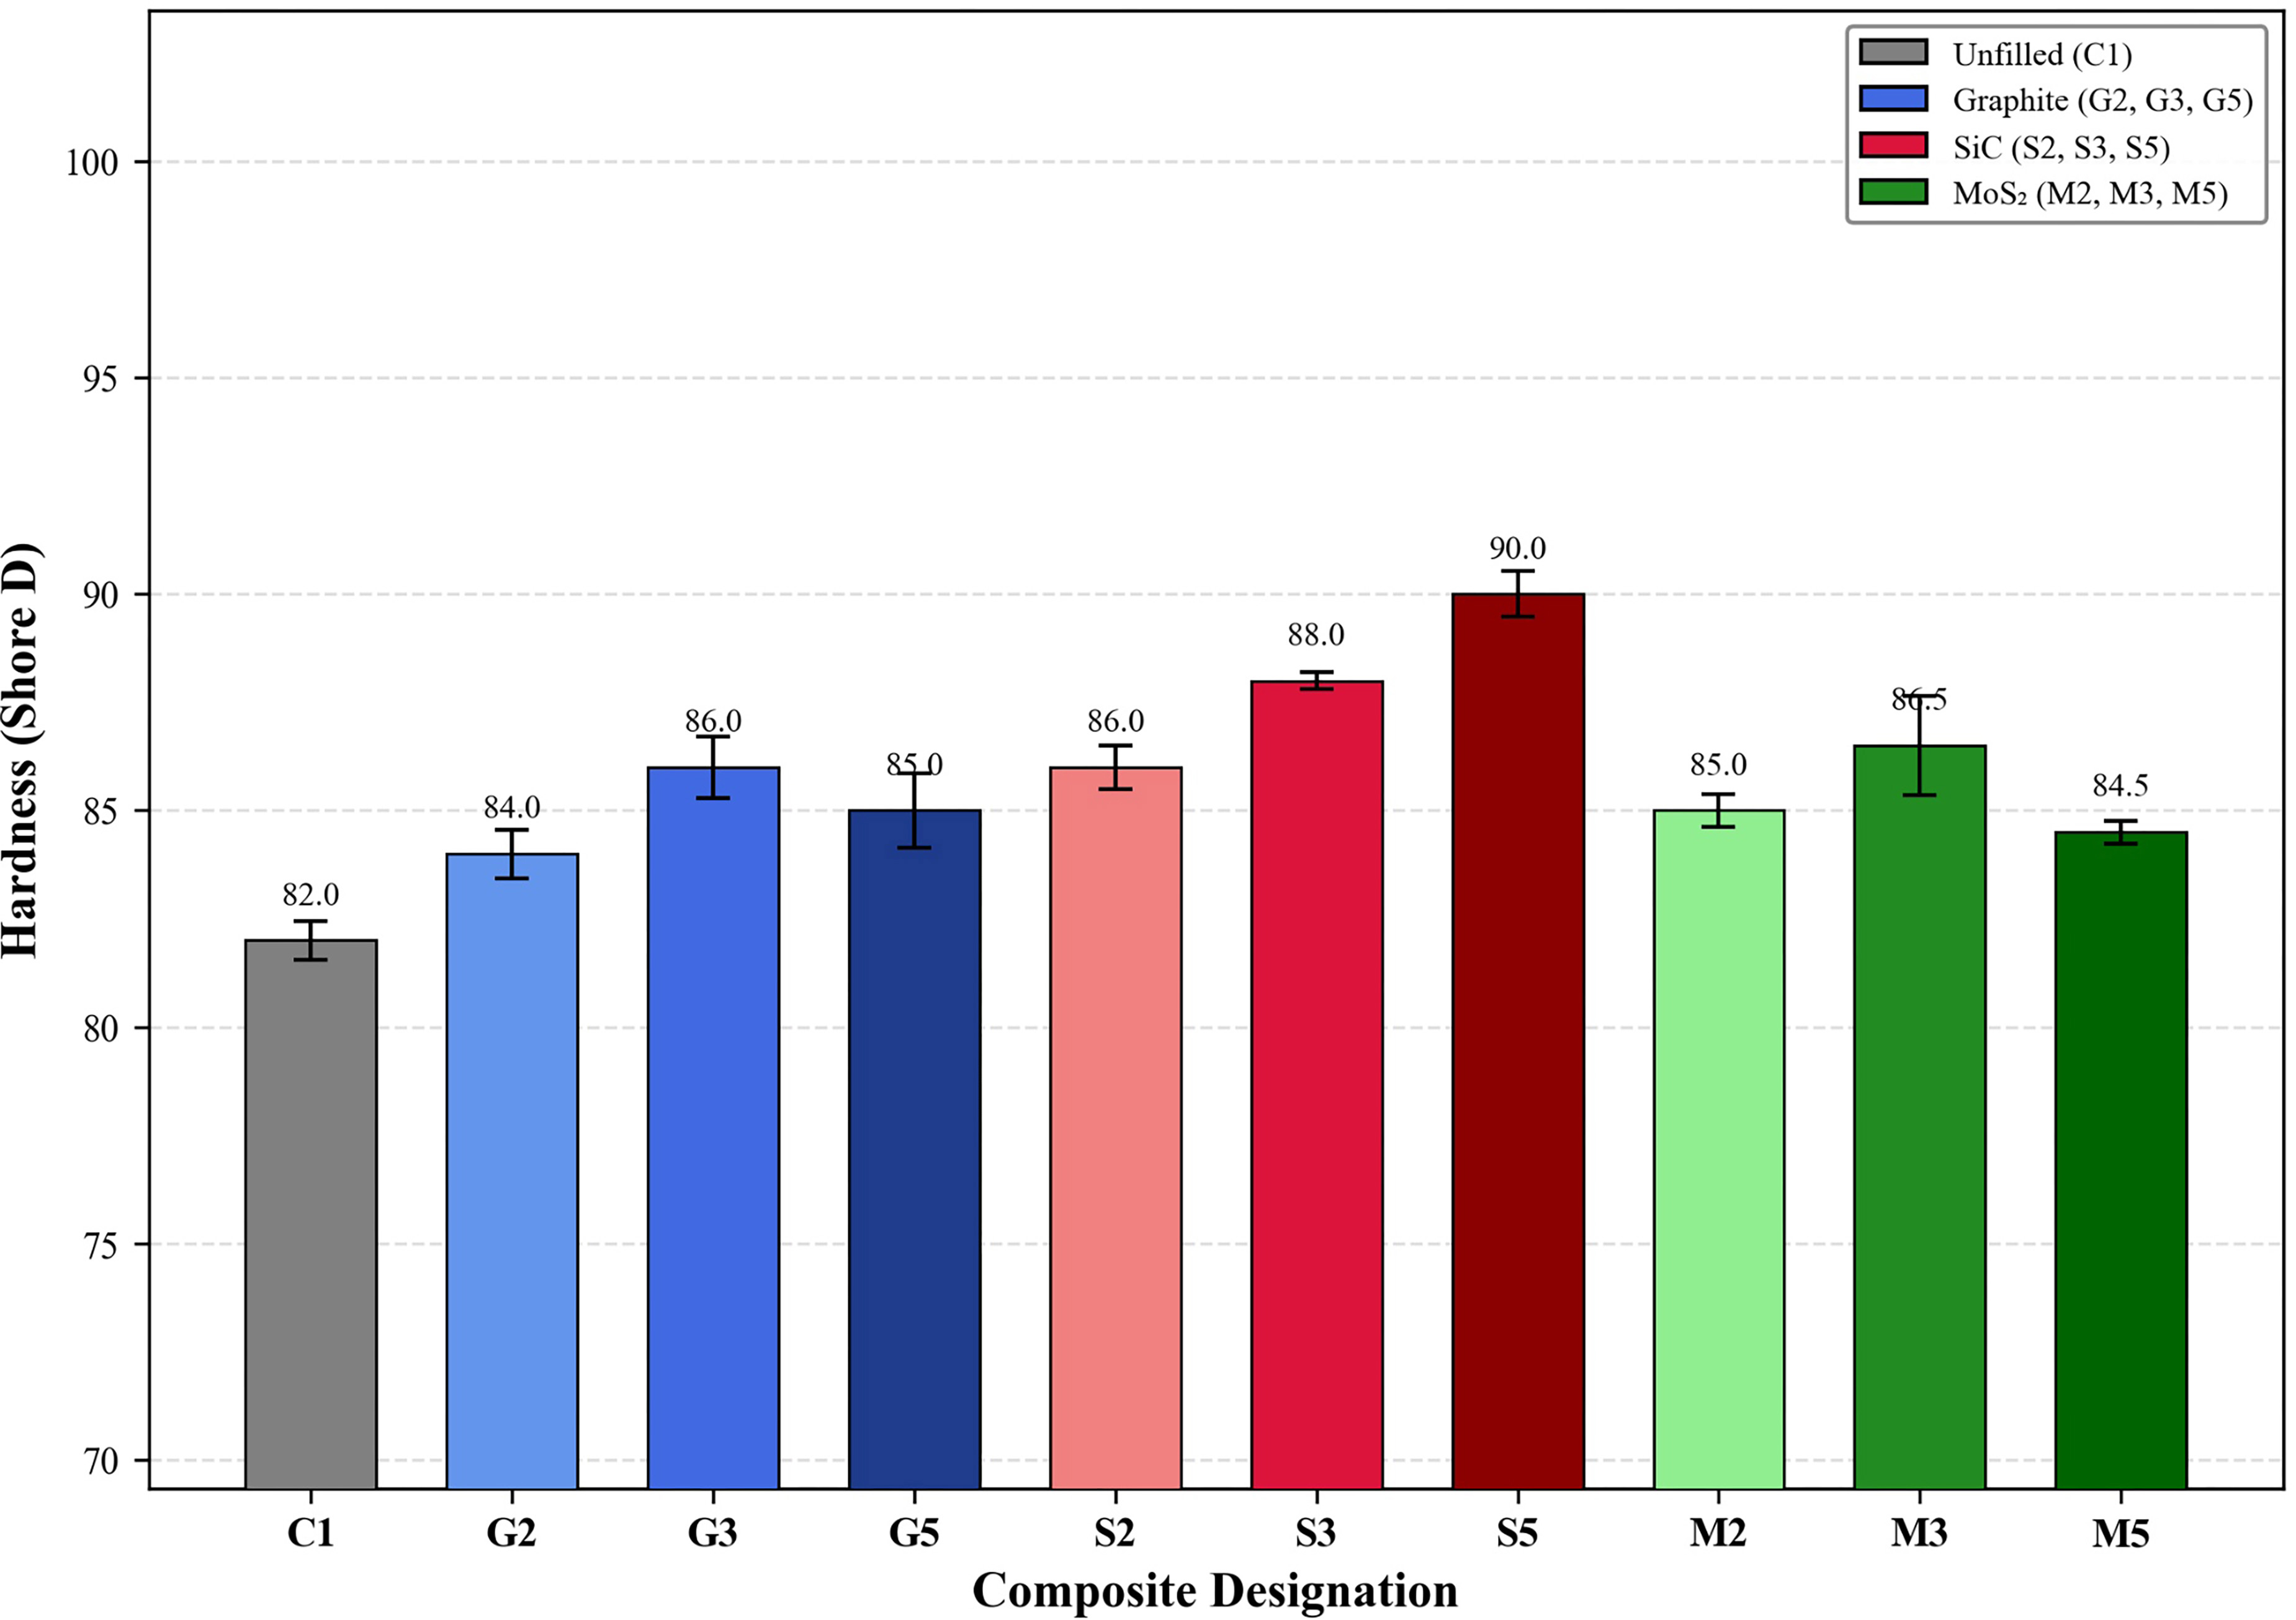
Figure 6 shows the Shore D hardness measurements for all composite groups, obtained using a standard durometer with a 15 s dwell time, in accordance with ASTM D2240. The unfilled baseline C1 recorded a hardness of 82.0 Shore D. All filled composites exhibited higher hardness than C1, confirming that particulate fillers restrict the indentation-driven deformation of the epoxy matrix. The SiC series produced the most pronounced hardness enhancement, with values increasing progressively from 86.0 (S2, 2 wt.%) to 88.0 (S3, 3 wt.%) and then to a maximum of 90.0 Shore D (S5, 5 wt.%), representing a 9.8% improvement over C1. This monotonic increase is attributed to the exceptional intrinsic hardness of SiC (Mohs 9–9.5), which resists localized surface deformation by distributing the applied indentation load across a network of rigid particle–matrix interfaces. The graphite series reached a peak of 86.0 Shore D at G3 (3 wt.%) before declining slightly to 85.0 at G5, consistent with the onset of agglomeration-induced interfacial voids that reduce local constraint on the matrix. The MoS2 series showed moderate hardness gains, peaking at 86.5 Shore D for M3 (3 wt.%) but falling to 84.5 for M5, reflecting the inherently soft, layered crystal structure of MoS2, which limits its resistance to penetration at higher loadings. One-way ANOVA yielded F = 63.06 (p < 0.001), with Tukey post hoc analysis identifying S5 as statistically superior to all other groups. These results establish that filler intrinsic hardness is the dominant parameter governing indentation resistance, and that SiC at 5 wt.% loading achieves the optimal balance between particle dispersion and surface constraint [30].
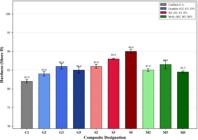
Shore D hardness of glass fiber/epoxy composites with graphite, SiC, and MoS₂ fillers measured according to ASTM D2240.
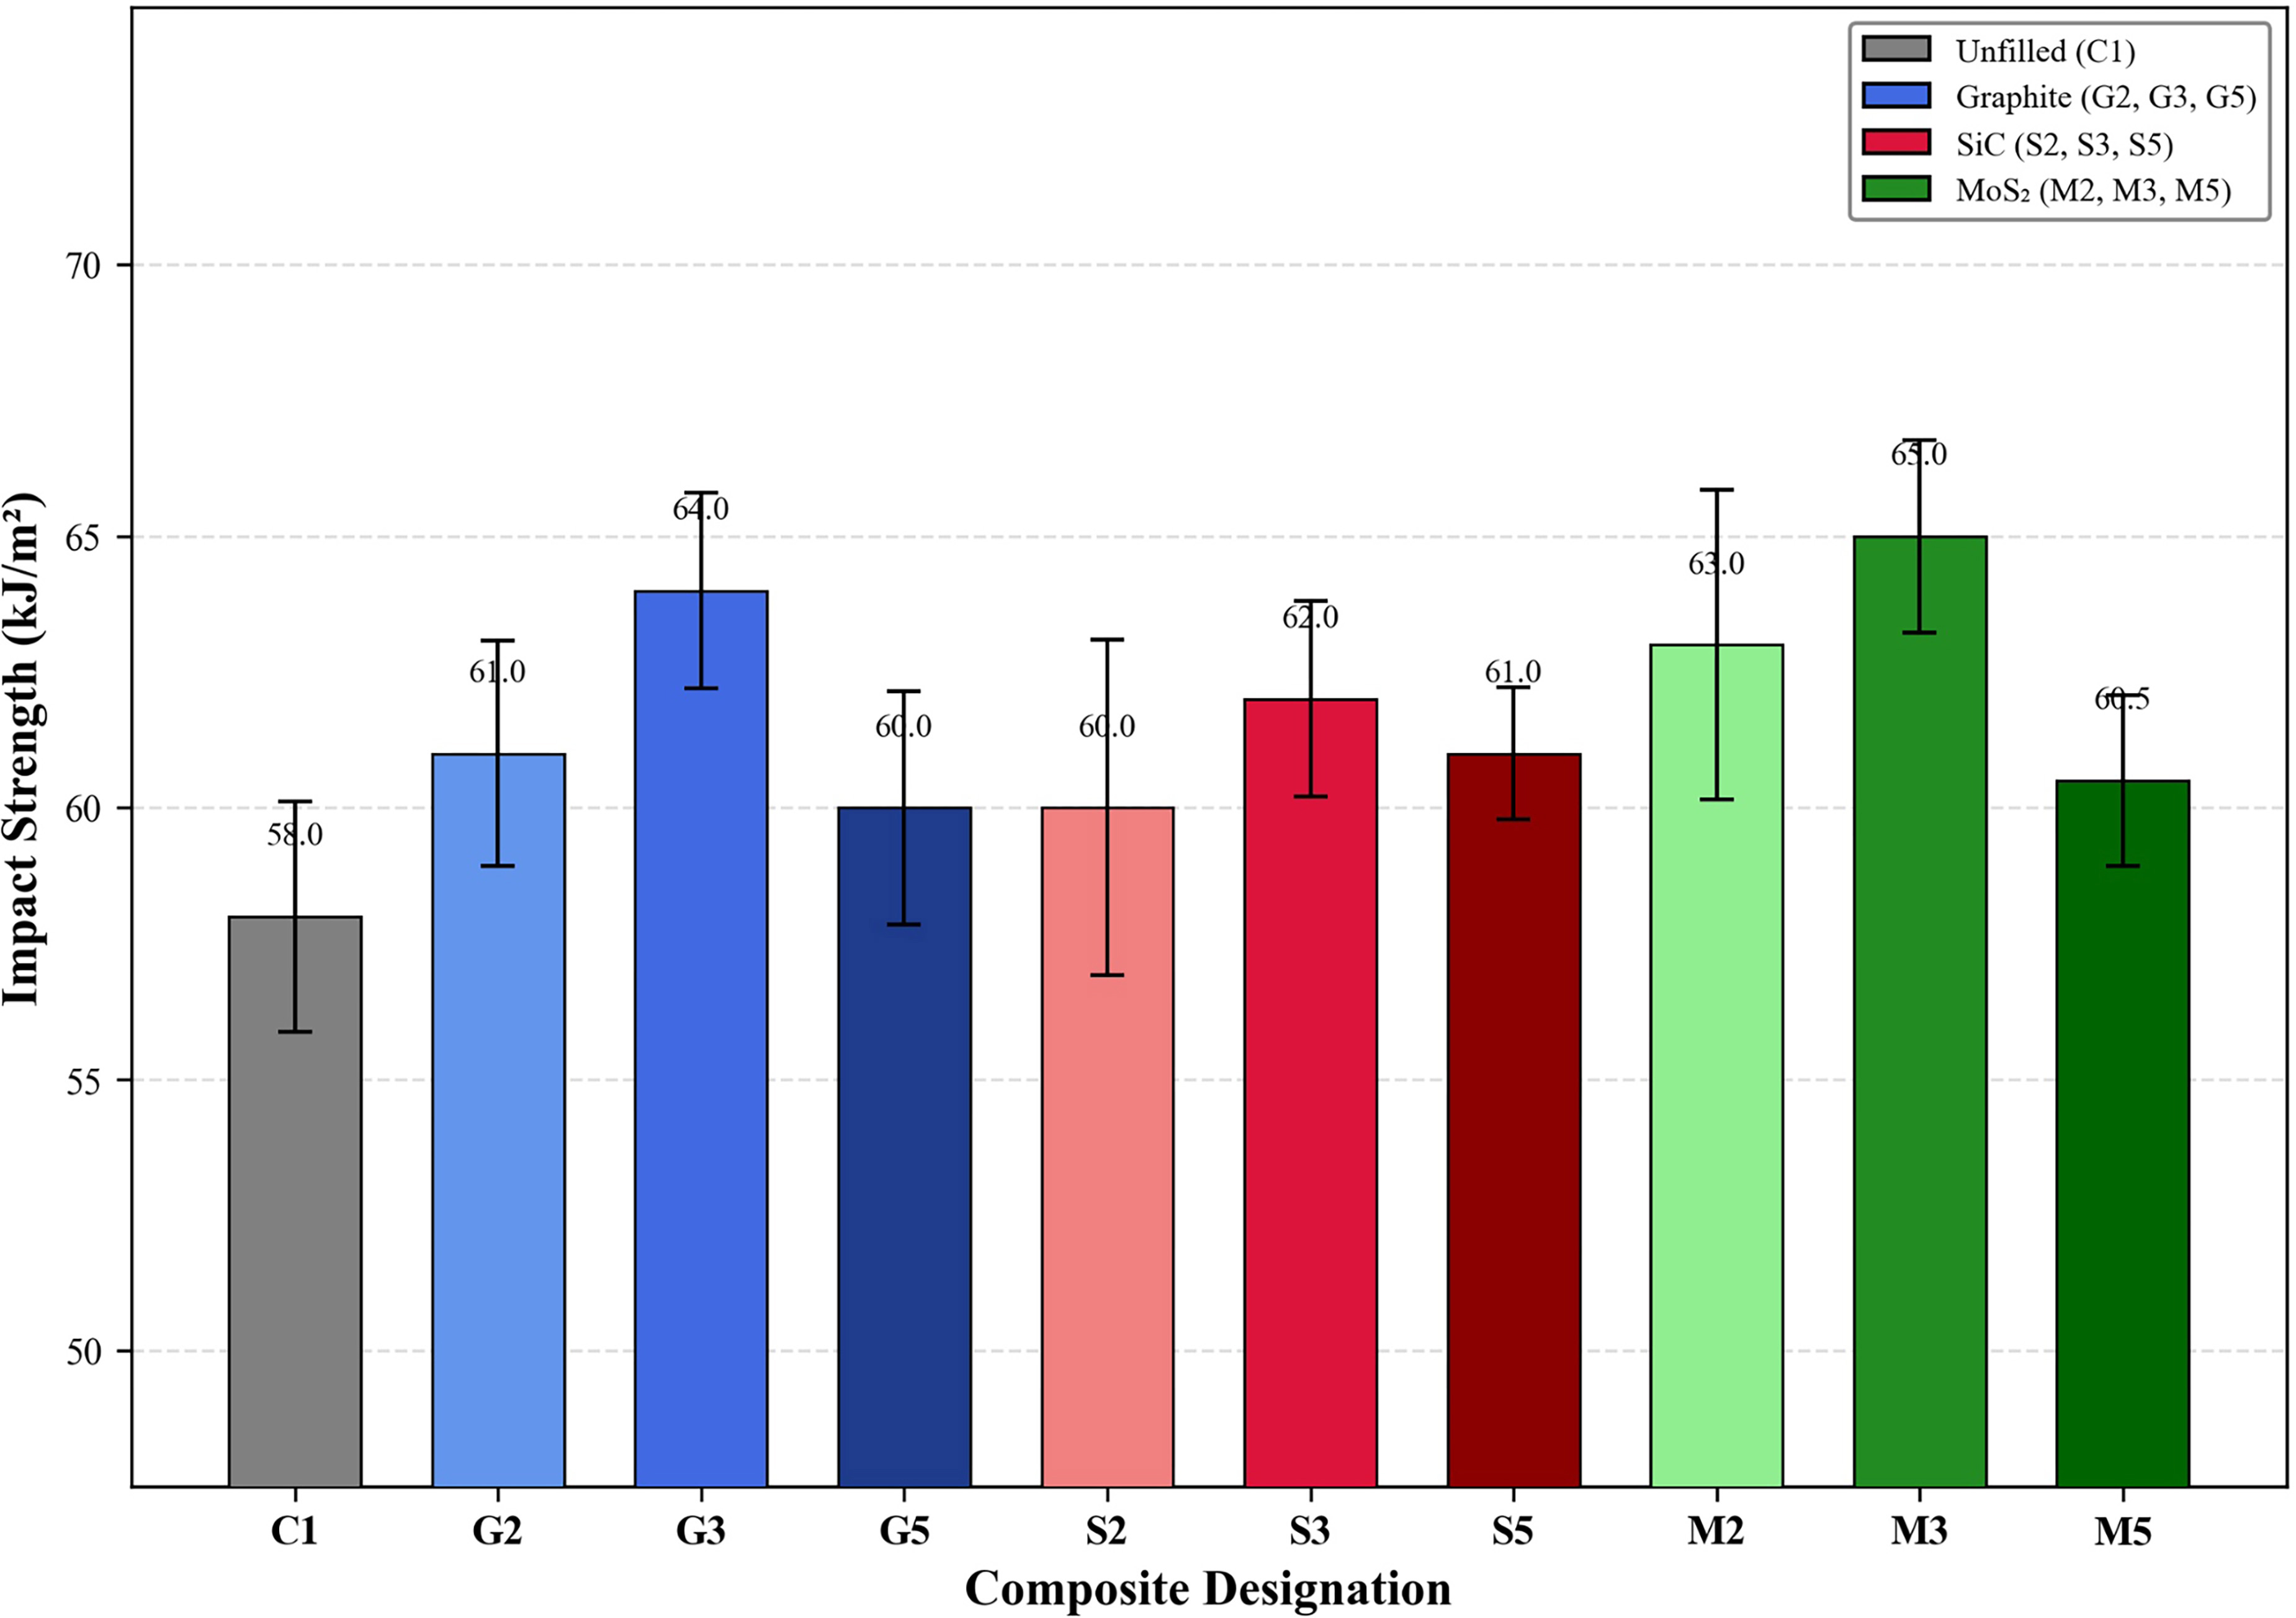
Figure 7 shows the impact strength of the composite series, evaluated using the notched Izod method per ASTM D256. The unfilled baseline C1 recorded a mean impact strength of 58.0 kJ/m2, the lowest among all groups, reflecting its reliance on fibre pull-out as its sole energy-absorption mechanism. Graphite-filled composites showed a maximum at G3 (64.0 kJ/m2), representing a 10.3% increase over C1, attributed to graphite platelets deflecting crack propagation paths and increasing the total fracture surface area. G5 (5 wt.%) declined to 60.0 kJ/m2, suggesting that agglomerated graphite clusters acted as stress concentrators facilitating brittle crack initiation. The SiC series exhibited a moderate, relatively flat impact response, ranging from 60.0 kJ/m2 (S2) to 62.0 kJ/m2 (S3), with S5 at 61.0 kJ/m2. The rigid nature of SiC particles constrains local plastic deformation of the matrix around the crack tip, which, while beneficial for quasi-static strength and hardness, limits the energy dissipation capacity under dynamic loading. The MoS2 series achieved the highest impact strength among all groups, with M3 (3 wt.%) recording 65.0 kJ/m2—a 12.1% improvement over C1—and M2 reaching 63.0 kJ/m2. The lamellar shearing mechanism of MoS2 enables interlayer sliding that dissipates impact energy through frictional work along the basal planes, effectively increasing the composite toughness. Statistical analysis (ANOVA, F = 4.88, p < 0.001) identified M3 as the best-performing group, demonstrating that soft solid-lubricant fillers enhance dynamic energy absorption more effectively than hard ceramic particles under impact loading conditions.
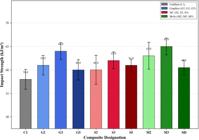
Izod impact strength of glass fiber/epoxy composites reinforced with graphite, Si, and MoS₂ at 2, 3, and 5 wt.% loadings.
Figure 8 shows the overall mean specific wear rate of all composite groups averaged across the full factorial matrix of load (10, 20, 30 N) and speed (1, 2, 3 m/s) conditions. The unfilled baseline C1 exhibited the highest specific wear rate of 2.81 × 10⁻⁴ mm3/N·m, reflecting severe material removal through unprotected fibre pull-out, matrix cracking, and deep abrasion grooving. All filled composites demonstrated reduced wear rates relative to C1, confirming that particulate fillers introduce wear-mitigating mechanisms. The graphite series reduced wear progressively from G2 (2.31 × 10⁻⁴) to G3 (1.96 × 10⁻⁴), a 30.2% reduction relative to C1, before increasing at G5 (2.13 × 10⁻⁴) due to agglomerate-induced discontinuities in the transfer film. The SiC series exhibited the most consistent wear reduction, with S5 (5 wt.%) recording the lowest overall specific wear rate of 1.70 × 10⁻⁴ mm3/N·m—a 39.5% improvement over C1. The hard SiC particles resist micro-cutting by the steel counter face, bear a portion of the applied normal load, and shallow the abrasion grooves, collectively reducing volumetric material loss. The MoS2 series achieved notable wear reduction through a different mechanism, with M3 (3 wt.%) reaching 1.75 × 10⁻⁴ mm3/N·m (37.7% reduction). MoS2 lamellae undergo basal-plane shearing to form a continuous lubricating tribofilm on the counter face, which reduces adhesive contact and shields the composite surface from direct asperity interaction. Statistical analysis confirmed S5 as the best-performing group, while the comparable performance of M3 indicates that solid-lubricant-mediated tribofilm formation can rival hard-particle reinforcement in reducing wear. To strengthen the waste-control interpretation, wear-related material loss was quantified using the unfilled C1 laminate as the reference condition. Because sliding distance and the load–speed domain were maintained constant across all composite groups, the average specific wear rate was treated as a normalized surrogate for wear-derived solid waste generation. A wear-control efficiency, ƞw, was calculated using Equation (23), while a relative waste index, Wi, and relative service-life factor, Lf, were calculated using Equations (24) and (25). The calculated values are summarized in Table 15. The lowest waste index was obtained for S5, with Wi = 0.605, which represents a 39.5% lower wear-derived material loss than C1 under the same ASTM G99 test domain. M3 showed a similar waste-control response, with Wi = 0.623 and ƞw = 37.7%. These calculations restrict the term “waste control” to experimentally measured wear-derived material loss rather than general end-of-life waste management. The quantified indices provide a direct basis for comparing filler systems in terms of material conservation during dry sliding.
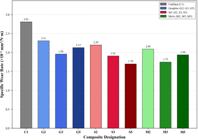
Overall average specific wear rate of glass fiber/epoxy composites with graphite, SiC, and MoS₂ fillers under pin-on-disc dry sliding conditions.
Quantitative wear-derived waste-control indices calculated from average specific wear rate.
where ƞw is the wear-control efficiency in %, Ks,C1 is the average specific wear rate of the unfilled C1 laminate, and Ks,i is the average specific wear rate of the filled composite.
where Wi is the relative waste index. A lower Wi denotes lower wear-derived material loss relative to C1.
where Lf is the relative service-life factor estimated from inverse wear-rate scaling under identical sliding conditions.
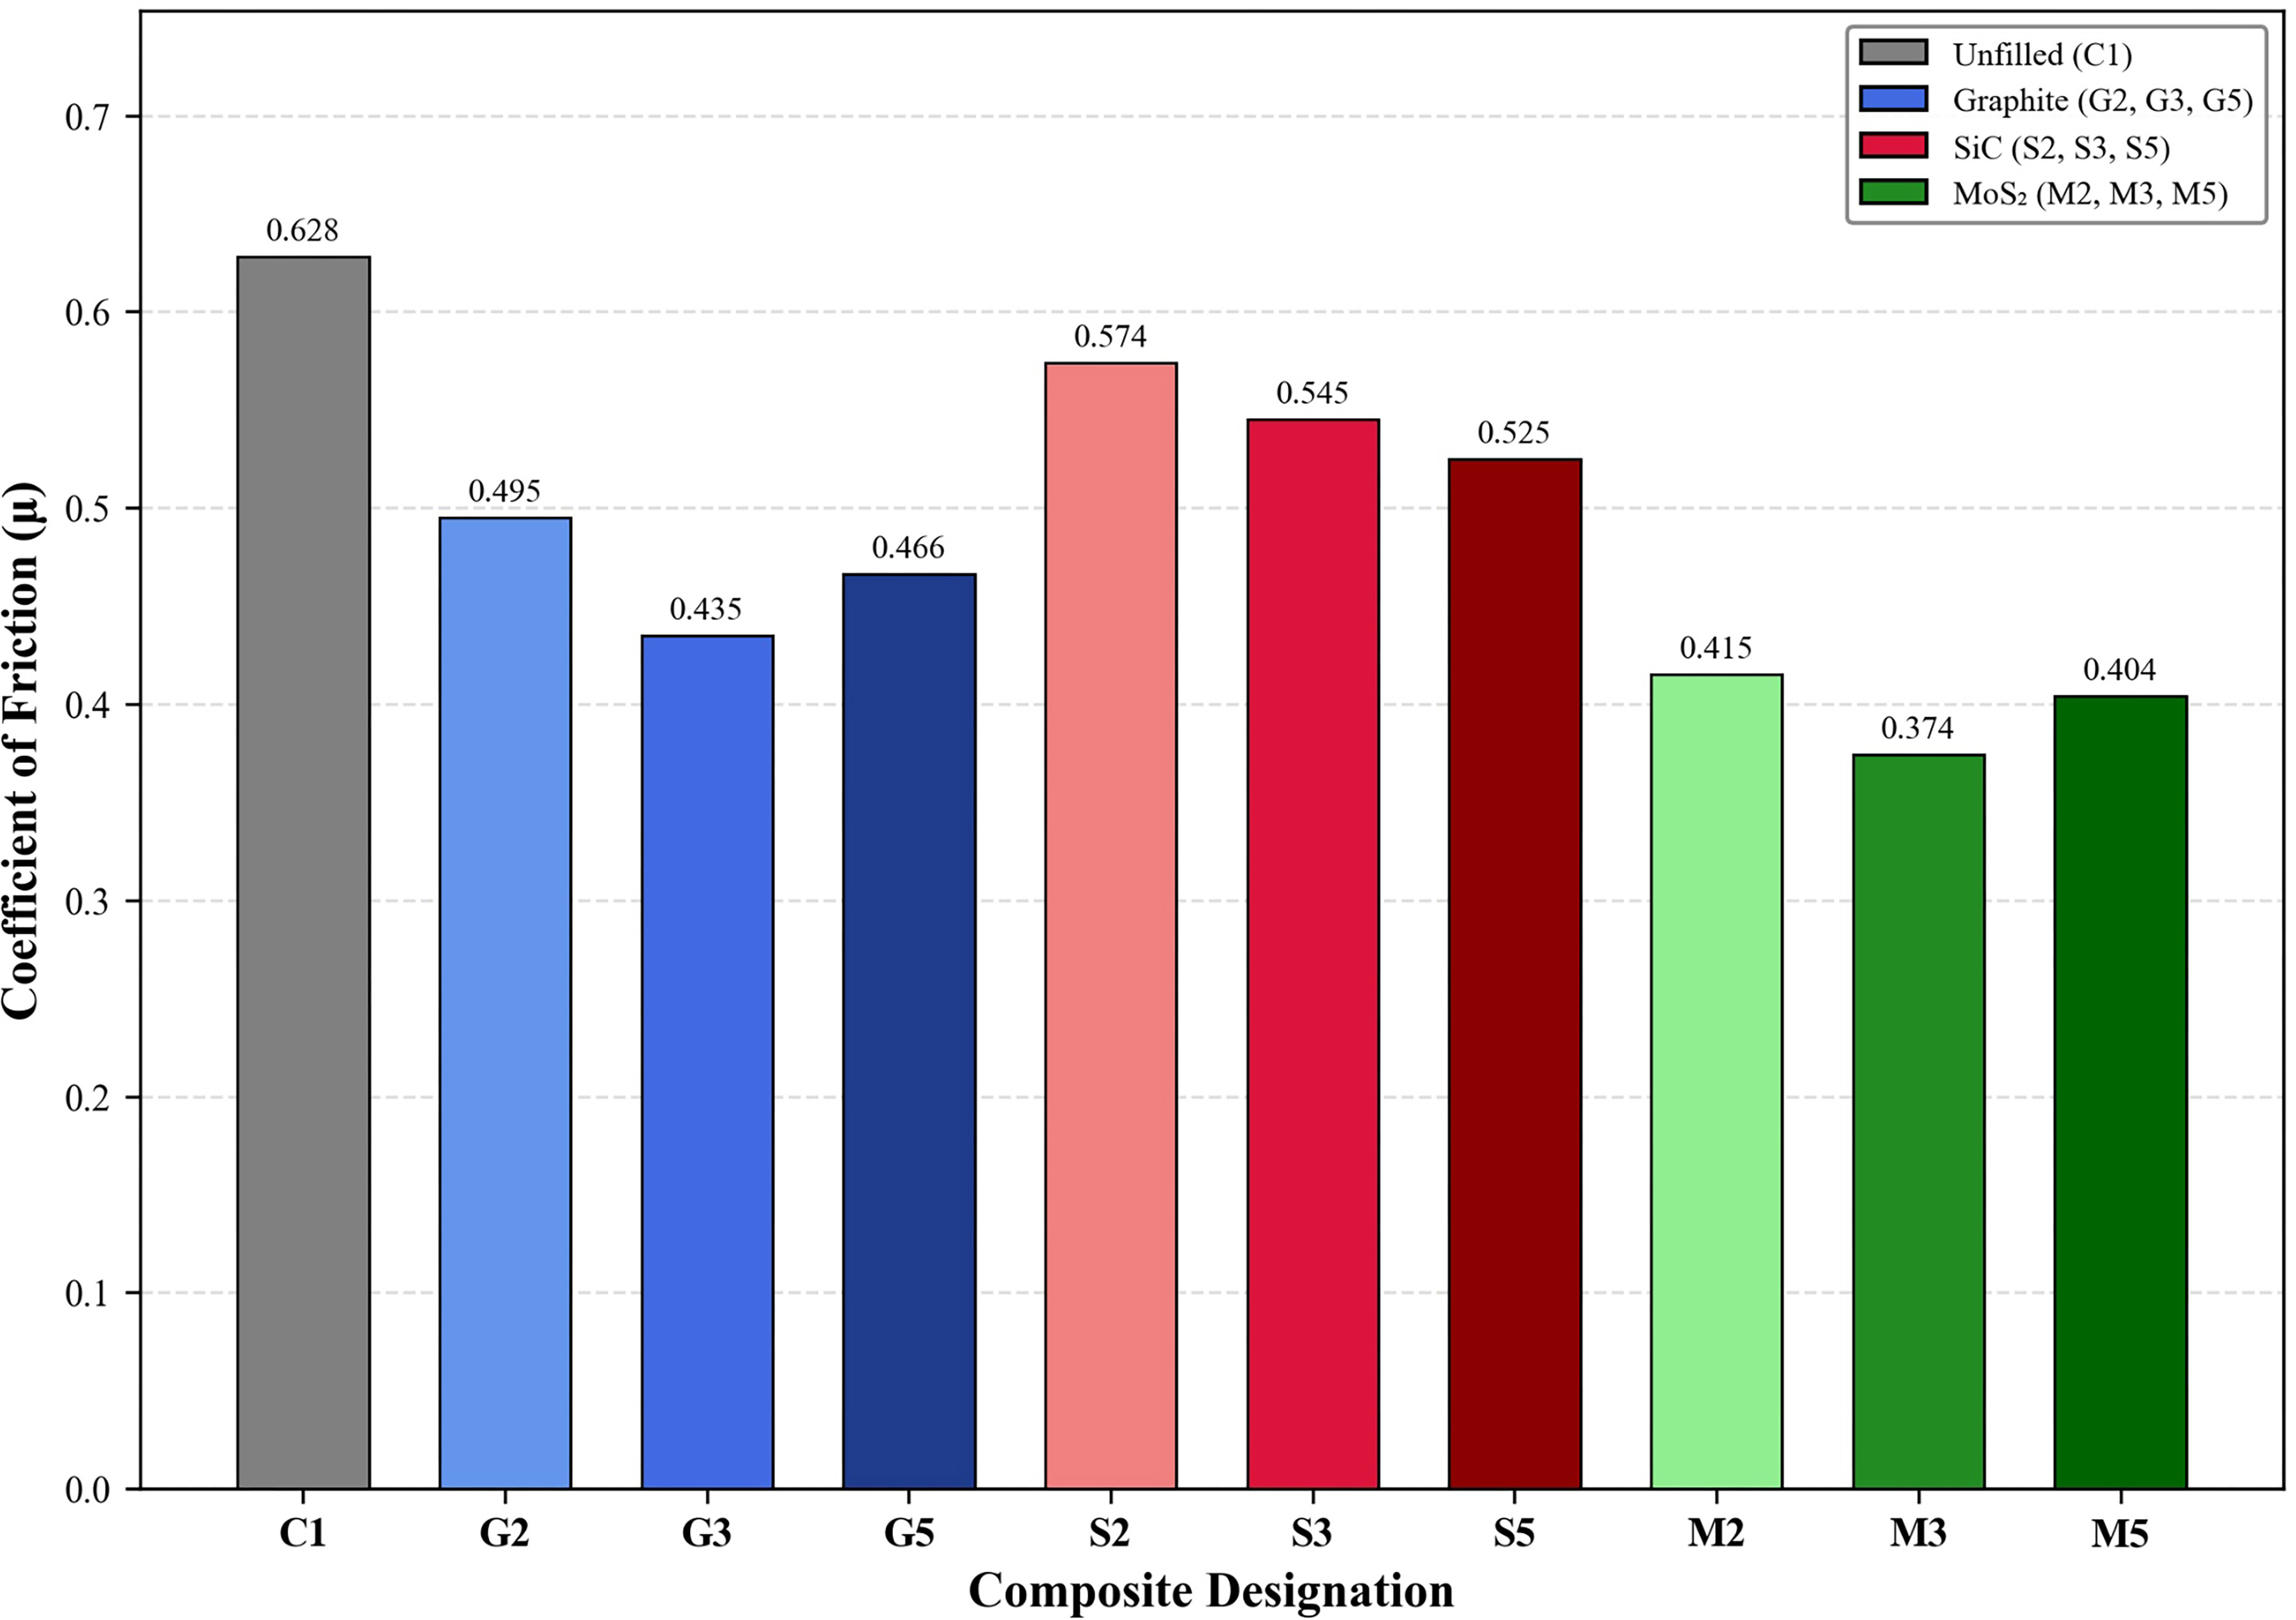
Tribological responses were obtained for each composite under the full factorial combination of three normal loads and three sliding speeds. Therefore, each composite generated nine condition-specific values for specific wear rate and coefficient of friction before any average value was calculated. The bar plots shown in Figures 8 and 9 represent only the overall mean values obtained after averaging the nine load–speed combinations for each composite group. To avoid ambiguity between the experimental matrix and the summarized graphical presentation, the complete load–speed responses for the unfilled C1 laminate are presented in Table 16 as a representative example, while the same averaging procedure was applied to all filled composites. The condition-specific data indicates that the reported single value in Figures 8 and 9 are not a single wear test result but rather as the mean response derived from the full ASTM G99 test matrix. This clarification ensures consistency between Figure 3, which defines the applied loads and sliding speeds, and Figures 8 and 9, which present the overall averaged tribological responses.
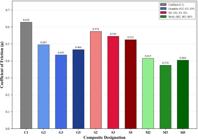
Overall average coefficient of friction of glass fiber/epoxy composites with graphite, SiC, and MoS₂ fillers under dry sliding conditions against an EN31 steel counterface.
Representative condition-specific tribological responses of the C1 laminate under the ASTM G99 load–speed matrix.
Figure 9 shows the overall mean coefficient of friction (µ) recorded for all composite variants averaged across the complete load–speed test matrix. The unfilled baseline C1 exhibited the highest friction coefficient of 0.628, attributable to direct polymer–metal adhesive contact and abrasive interaction between exposed glass fibres and the steel counterface. The SiC-filled series showed the least friction reduction among the three filler families, with values ranging from 0.574 (S2) to 0.525 (S5), representing a modest 16.4% decrease relative to C1. Although SiC particles effectively resist wear through load bearing and surface-hardening mechanisms, they do not form lubricating tribofilms, and their angular morphology can sustain abrasive micro ploughing, thereby maintaining elevated friction. The graphite-filled composites achieved greater friction reduction, with G3 (3 wt.%) recording 0.435—a 30.7% decrease, attributed to the formation of a graphite-rich transfer film on the steel counterface, which provides a low-shear-strength interlayer that reduces tangential resistance. The MoS2 series delivered the most substantial friction reduction, with M3 (3 wt.%) recording the minimum value of 0.374—a 40.4% decrease relative to C1. The hexagonal layered crystal structure of MoS2 facilitates easy basal-plane cleavage under shear, generating a continuous lubricating tribofilm that substantially reduces the interfacial shear stress. The statistical analysis yielded the highest F-value among all properties tested (F = 750.34, p < 0.001), and Tukey analysis identified M3 as statistically superior, confirming that the solid-lubricant mechanism of MoS2 is the most effective strategy for friction reduction. These results demonstrate that friction modification is primarily governed by the filler’s ability generate and sustain a low-shear-strength transfer layer rather than by particle hardness alone [31].
The relationship between mechanical properties and tribological response can be rationalized using a simplified micromechanical wear framework. Under dry sliding, the specific wear rate is governed by the resistance of the near-surface composite to penetration, ploughing, fibre exposure, and interfacial shear. According to the Archard-type wear relation, the wear volume is inversely related to the effective hardness of the sliding surface, as expressed in Equation 23. Therefore, the higher hardness and flexural stiffness observed in SiC-filled laminates can be associated with greater resistance to local asperity penetration and lower material removal during sliding. In contrast, friction reduction is controlled less by hardness and more by the interfacial shear strength of the contact layer, as expressed in Equation 24. The lower coefficient of friction of MoS2-filled composites can therefore be linked to the formation of a low-shear lamellar tribofilm, which reduces tangential resistance at the steel–composite interface. Graphite-filled composites occupy an intermediate condition, where partial transfer-film formation and moderate stiffness enhancement occur together. This micromechanical analysis links tensile/flexural load transfer, indentation resistance, transfer-layer formation, and wear loss within a common structure–property–tribology framework, as summarized in Table 17.
Micromechanical linkage between measured mechanical properties and tribological mechanisms.
The theoretical linkage may be inserted using the following equations:
where Vw is the wear volume loss, k is the dimensionless wear coefficient, FN is the applied normal load, D is the sliding distance, and Hc is the effective hardness of the composite surface.
where μ is the coefficient of friction, τi is the interfacial shear strength of the sliding contact layer, and pm is the mean contact pressure.
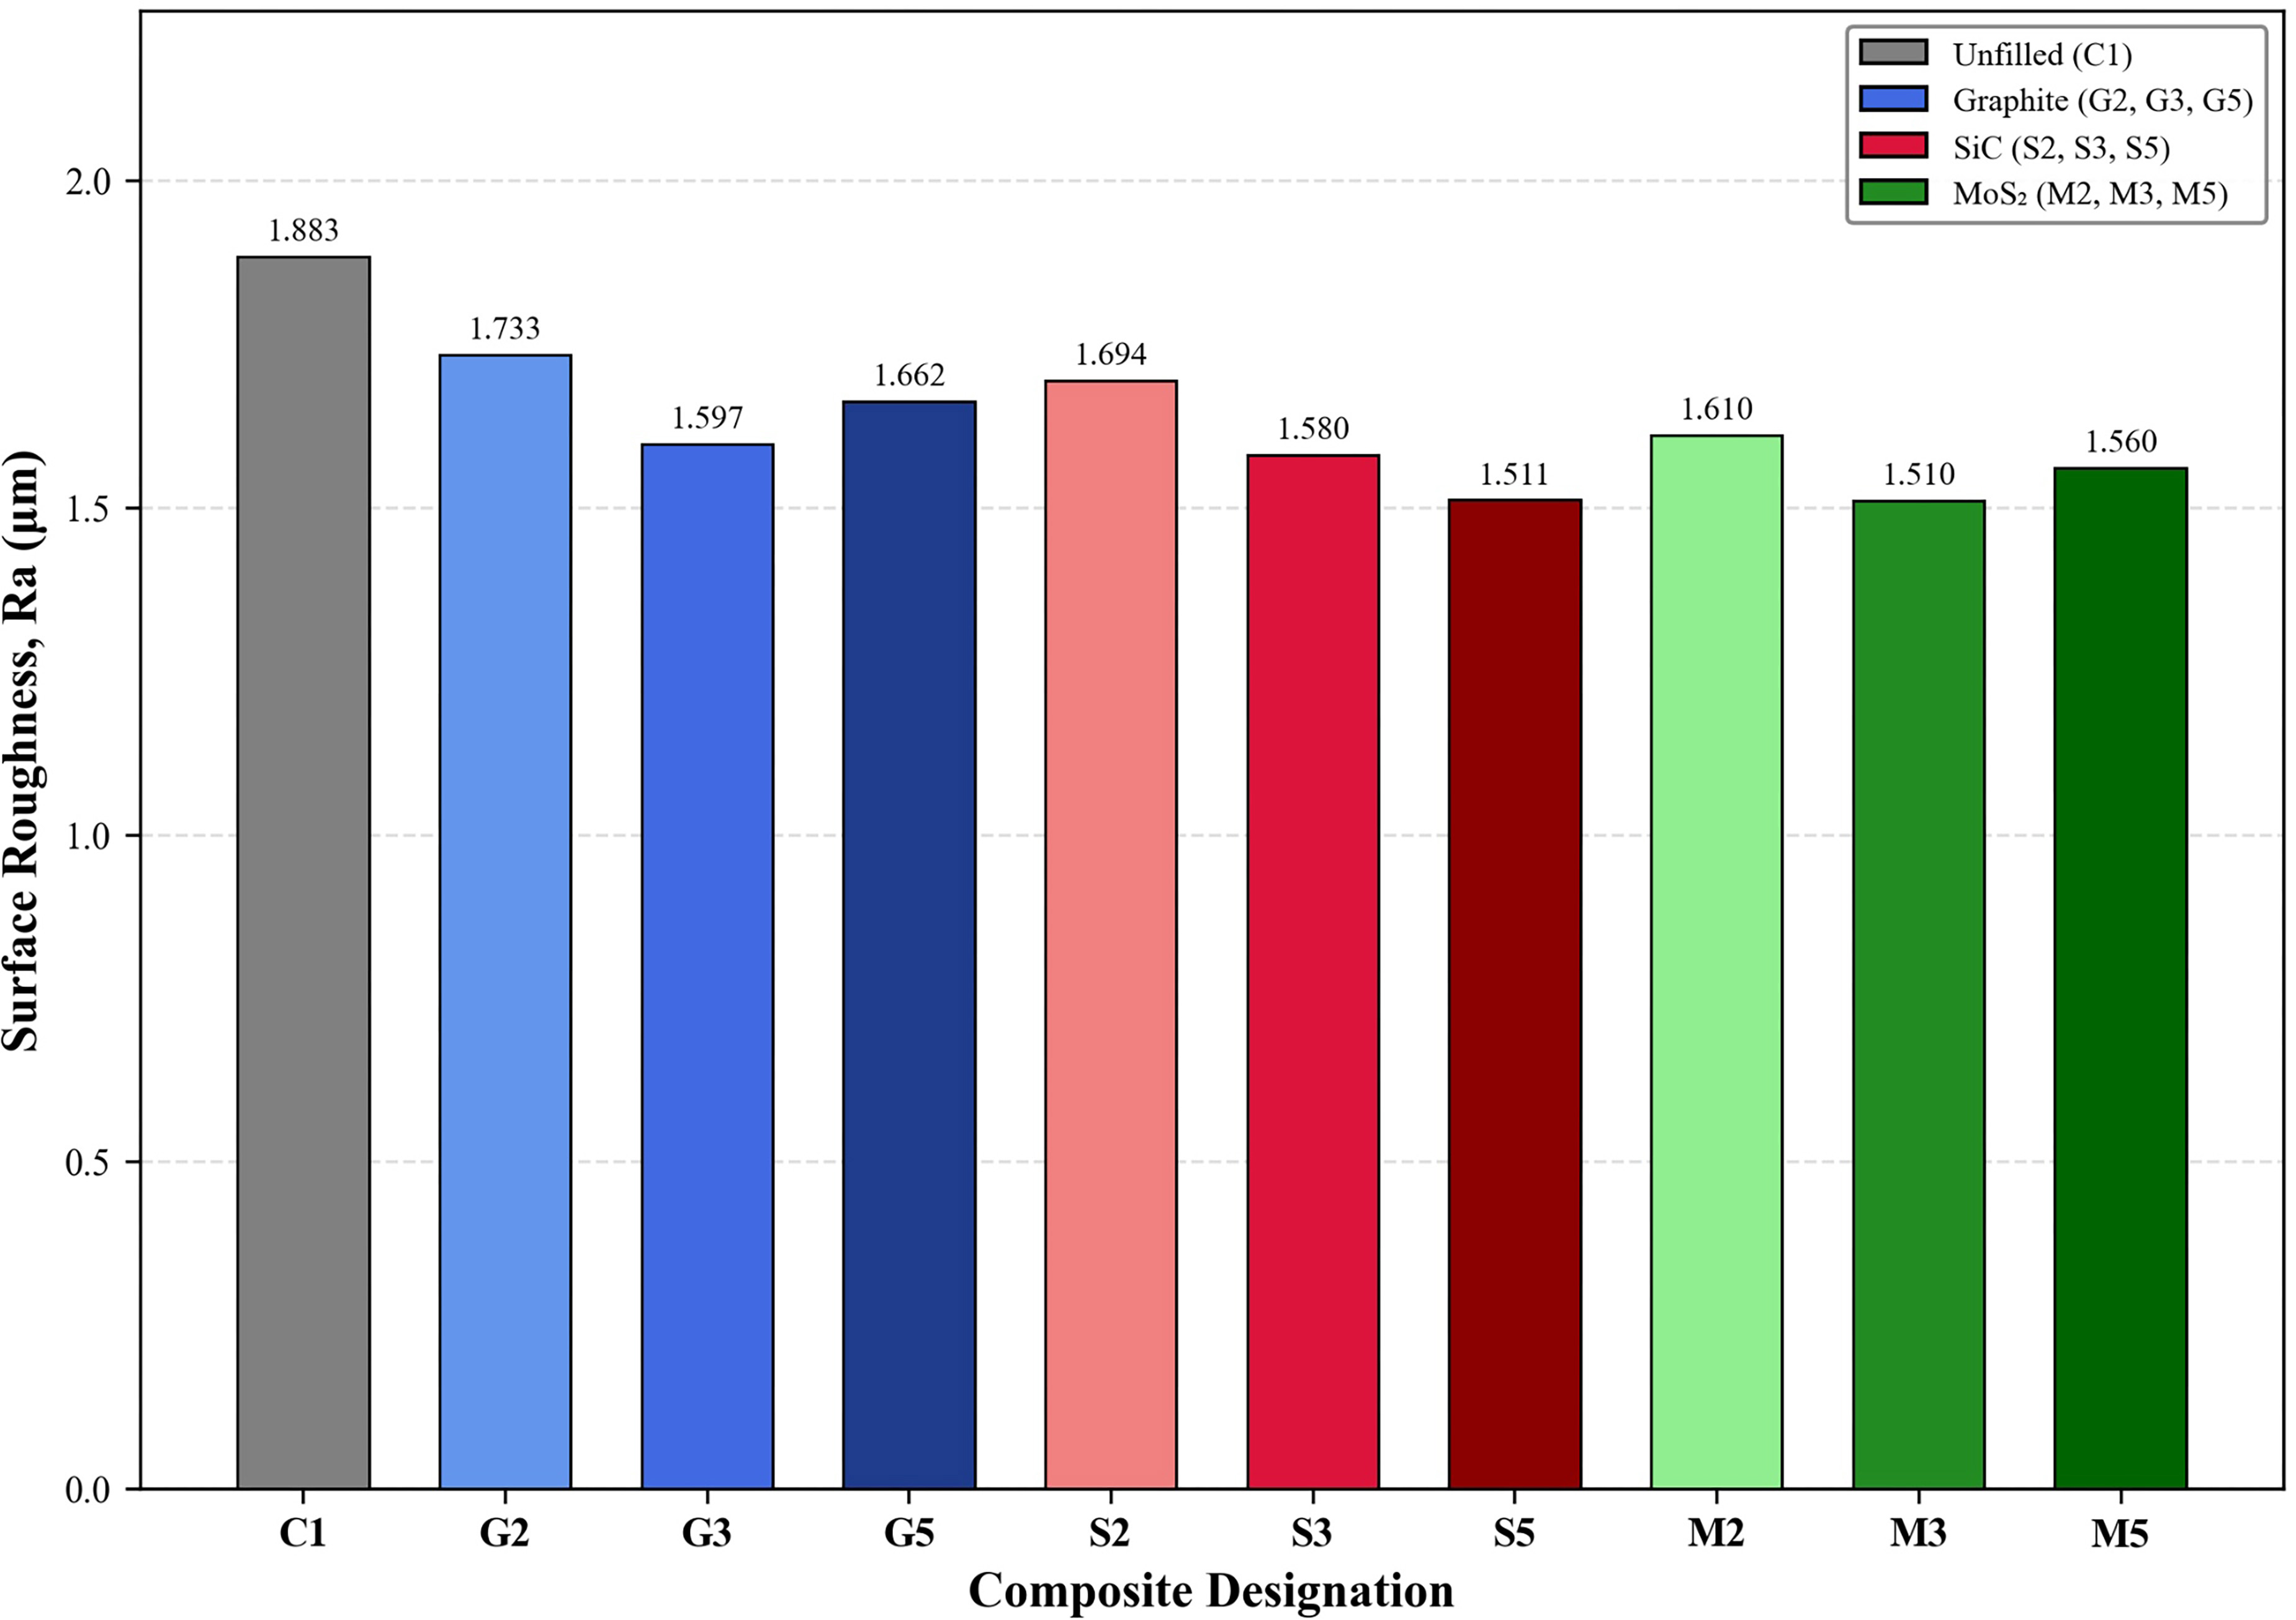
Figure 10 shows the arithmetic average surface roughness Ra measured on worn surfaces of all composite groups using a Mahr Surf GD120 profilometer with a cut-off length of 0.8 mm and evaluation length of 4 mm. The unfilled baseline C1 recorded the highest worn-surface roughness of 1.883 µm, consistent with severe material-removal mechanisms, including deep abrasion grooves, extensive fibre pull-out, and matrix fragmentation, which generate an irregular topography. All filled composites exhibited lower roughness values than C1, with the extent of reduction dependent on filler type and concentration. The graphite series showed decreasing roughness from G2 (1.733 µm) through G3 (1.597 µm) to a mild reversal at G5 (1.662 µm), indicating that the graphite transfer film smooths the worn surface at optimal loading but becomes discontinuous at higher concentrations. The SiC series demonstrated a progressive roughness reduction from S2 (1.694 µm) to S5 (1.511 µm)—a 19.8% improvement over C1—reflecting the ability of hard particles to restrict deep ploughing and promote a compacted, load-bearing surface layer that limits topographic irregularity. The MoS2 series achieved the lowest roughness at M3 (1.510 µm), comparable to that ofS5, with the lubricating tribofilm creating a uniform, smooth worn surface through controlled lamellar shearing. The statistical significance of roughness differences (ANOVA F = 4.22, p < 0.001) and identification of M3 as the optimal group by Tukey analysis confirm that tribofilm-mediated surface protection is the most effective mechanism for preserving worn-surface integrity. The correlation between low roughness values and low friction coefficients for MoS2-filled composites supports the hypothesis that tribofilm continuity governs both friction and surface finish simultaneously [32].
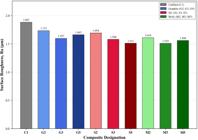
Overall mean surface roughness (Ra) of worn composite surfaces measured by contact profilometry after pin-on-disc testing.
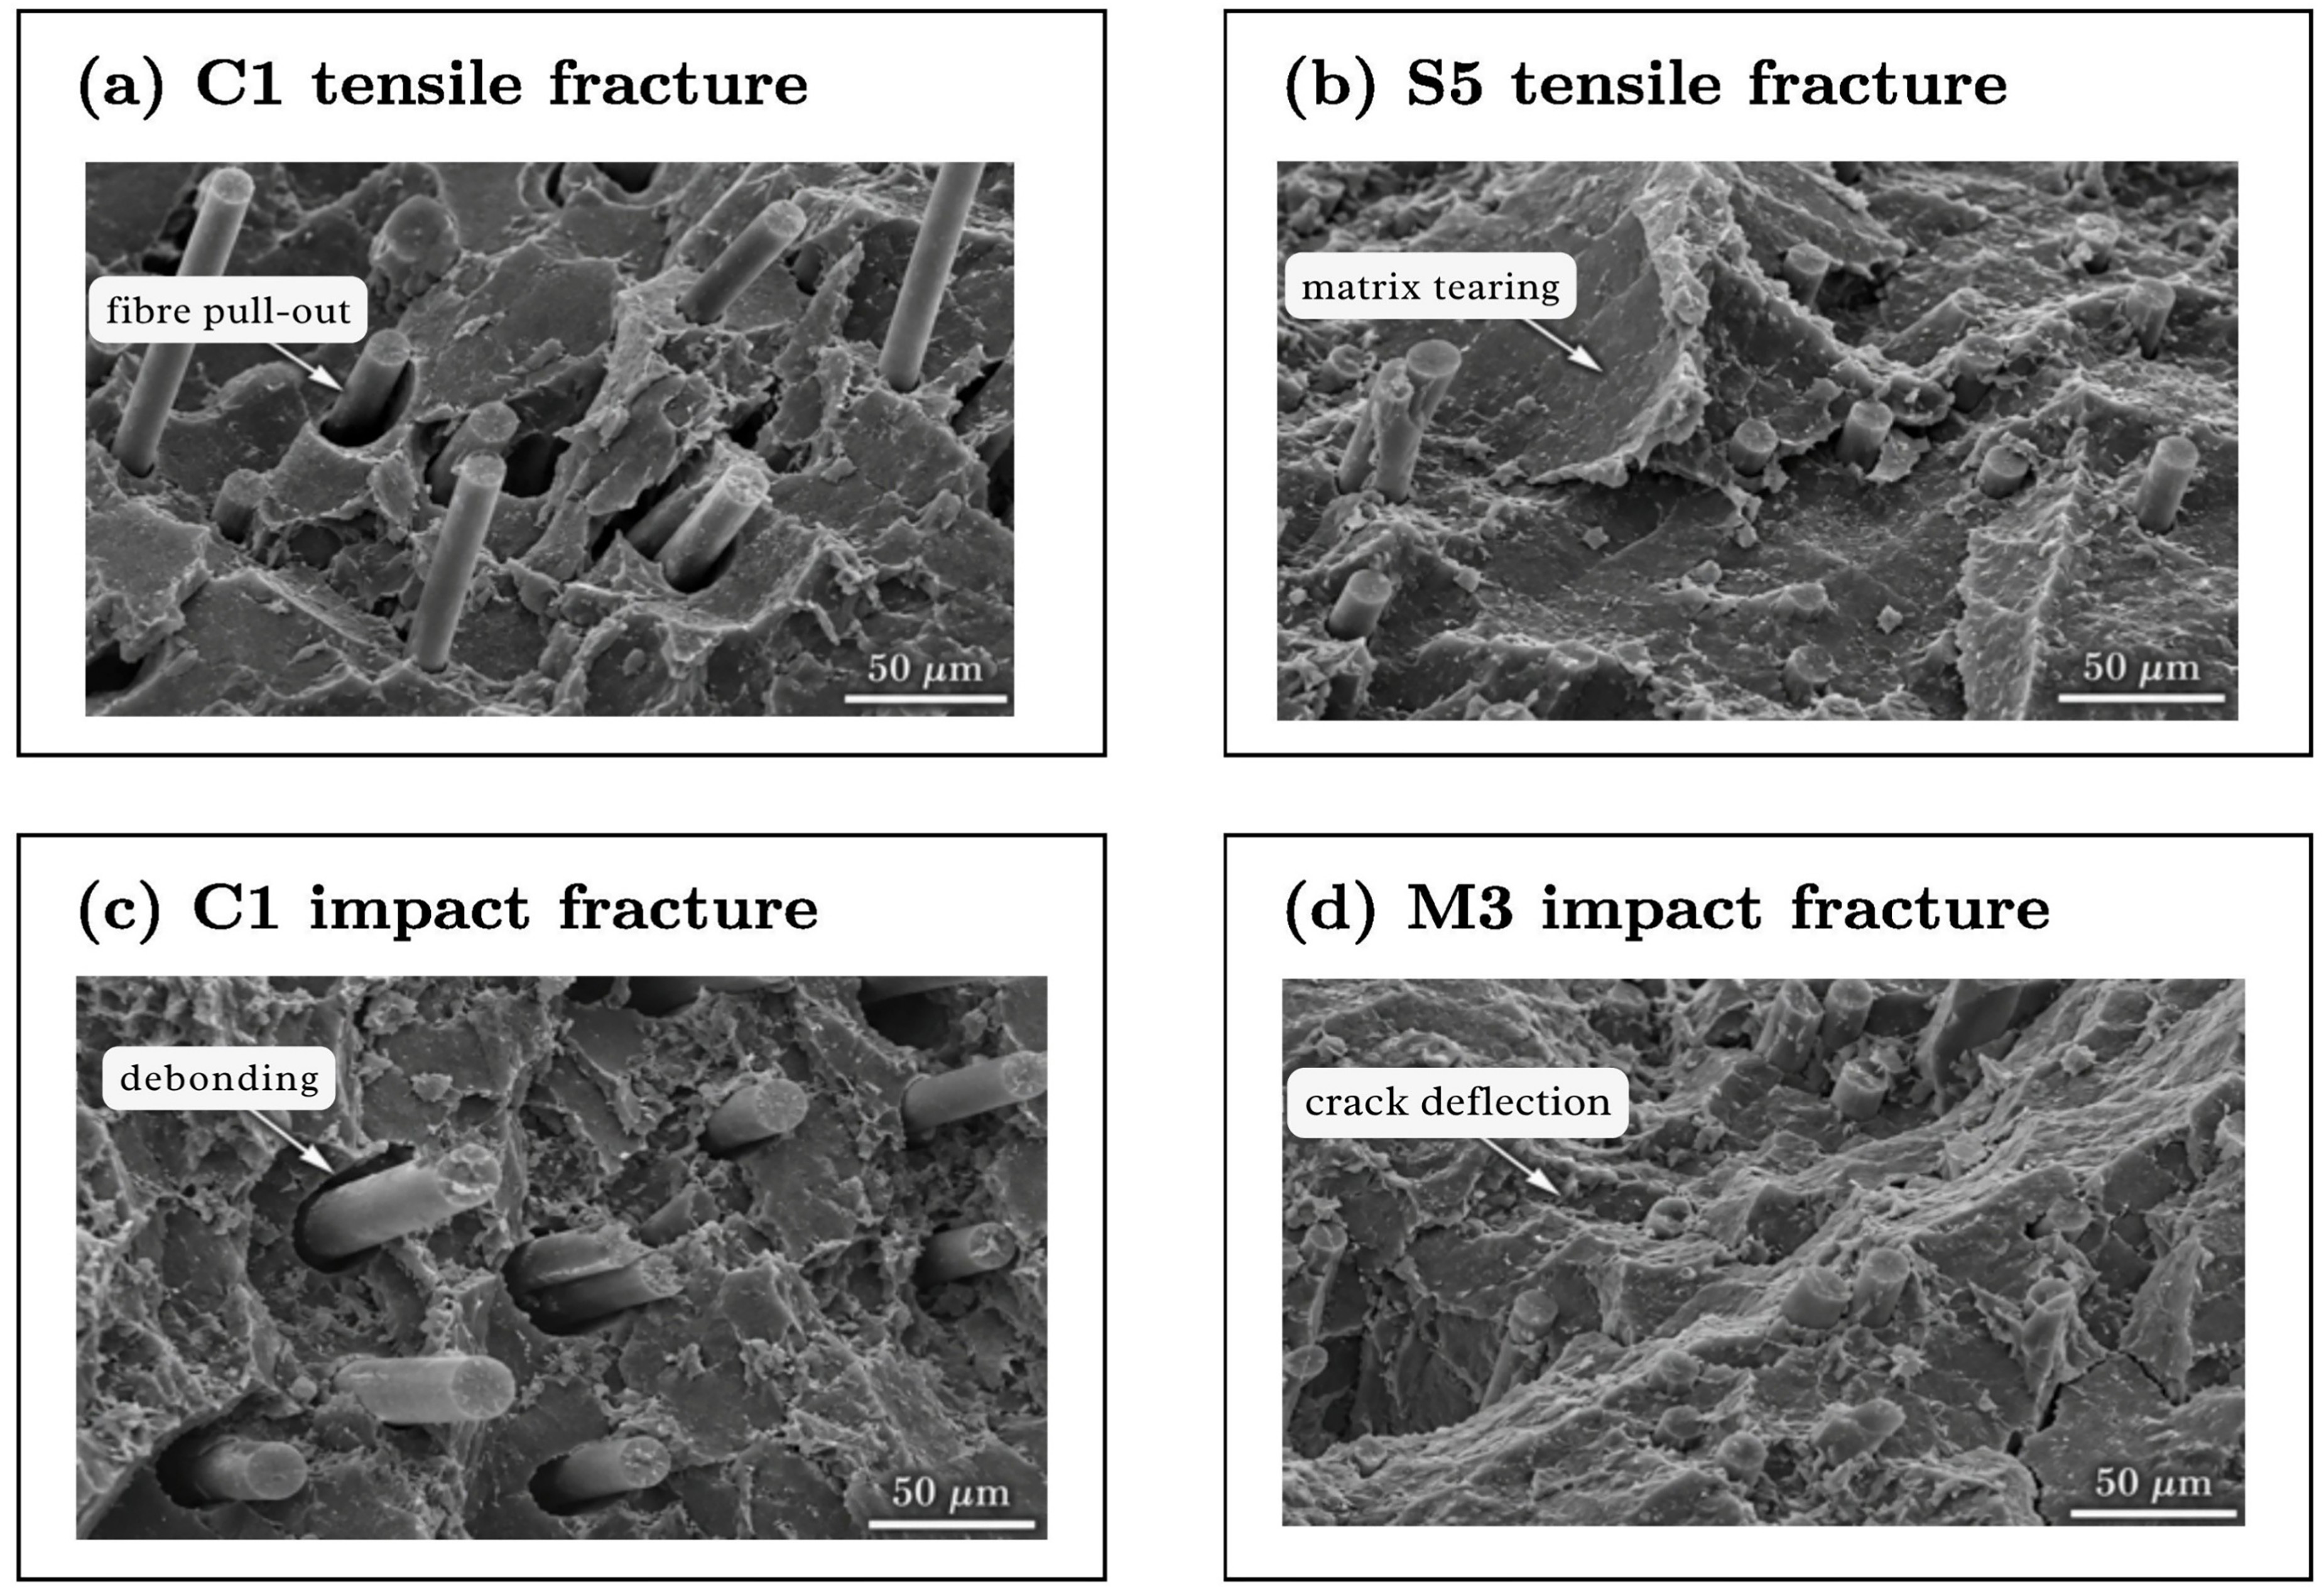
Figure 11 shows the SEM fractography of representative tensile- and impact-fractured specimens. The C1 tensile fracture surface in Figure 11a shows extensive fibre pull-out, open fibre cavities, and separated matrix regions, which suggests weak local fibre–matrix adhesion and limited stress transfer across the interface. Such morphology is typical of premature interfacial debonding, where cracks advance along the fibre–matrix boundary rather than through a strongly bonded matrix–fibre network. The S5 tensile fracture surface in Figure 11b shows rougher matrix tearing, shorter exposed fibre lengths, and more irregular fractured matrix ridges. This fracture pattern suggests that SiC-filled epoxy constrained local matrix deformation and forced crack propagation along a rougher path, thereby providing greater resistance to tensile failure [31, 33, 34]. The C1 impact fracture surface in Figure 11c shows debonding around exposed fibres and multiple pull-out cavities, which is associated with rapid crack growth and low resistance to dynamic fracture. By comparison, the M3 impact fracture surface in Figure 11d shows a crack path, stepped fracture features, and crack deflection within the matrix-rich region. These features suggest that MoS2 addition promoted crack deviation and frictional energy dissipation during impact loading. Therefore, the observations support the mechanical trends by linking filler type with interfacial adhesion, crack-path modification, and fracture-energy absorption [35].
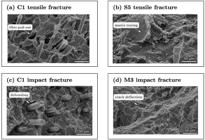
SEM fractographs of representative fractured glass fiber–reinforced epoxy composites after tensile and notched Izod impact testing: (a) C1 tensile fracture showing fibre pull-out, (b) S5 tensile fracture showing matrix tearing, (c) C1 impact fracture showing interfacial debonding, and (d) M3 impact fracture showing crack deflection. The scale bar is 50 µm.
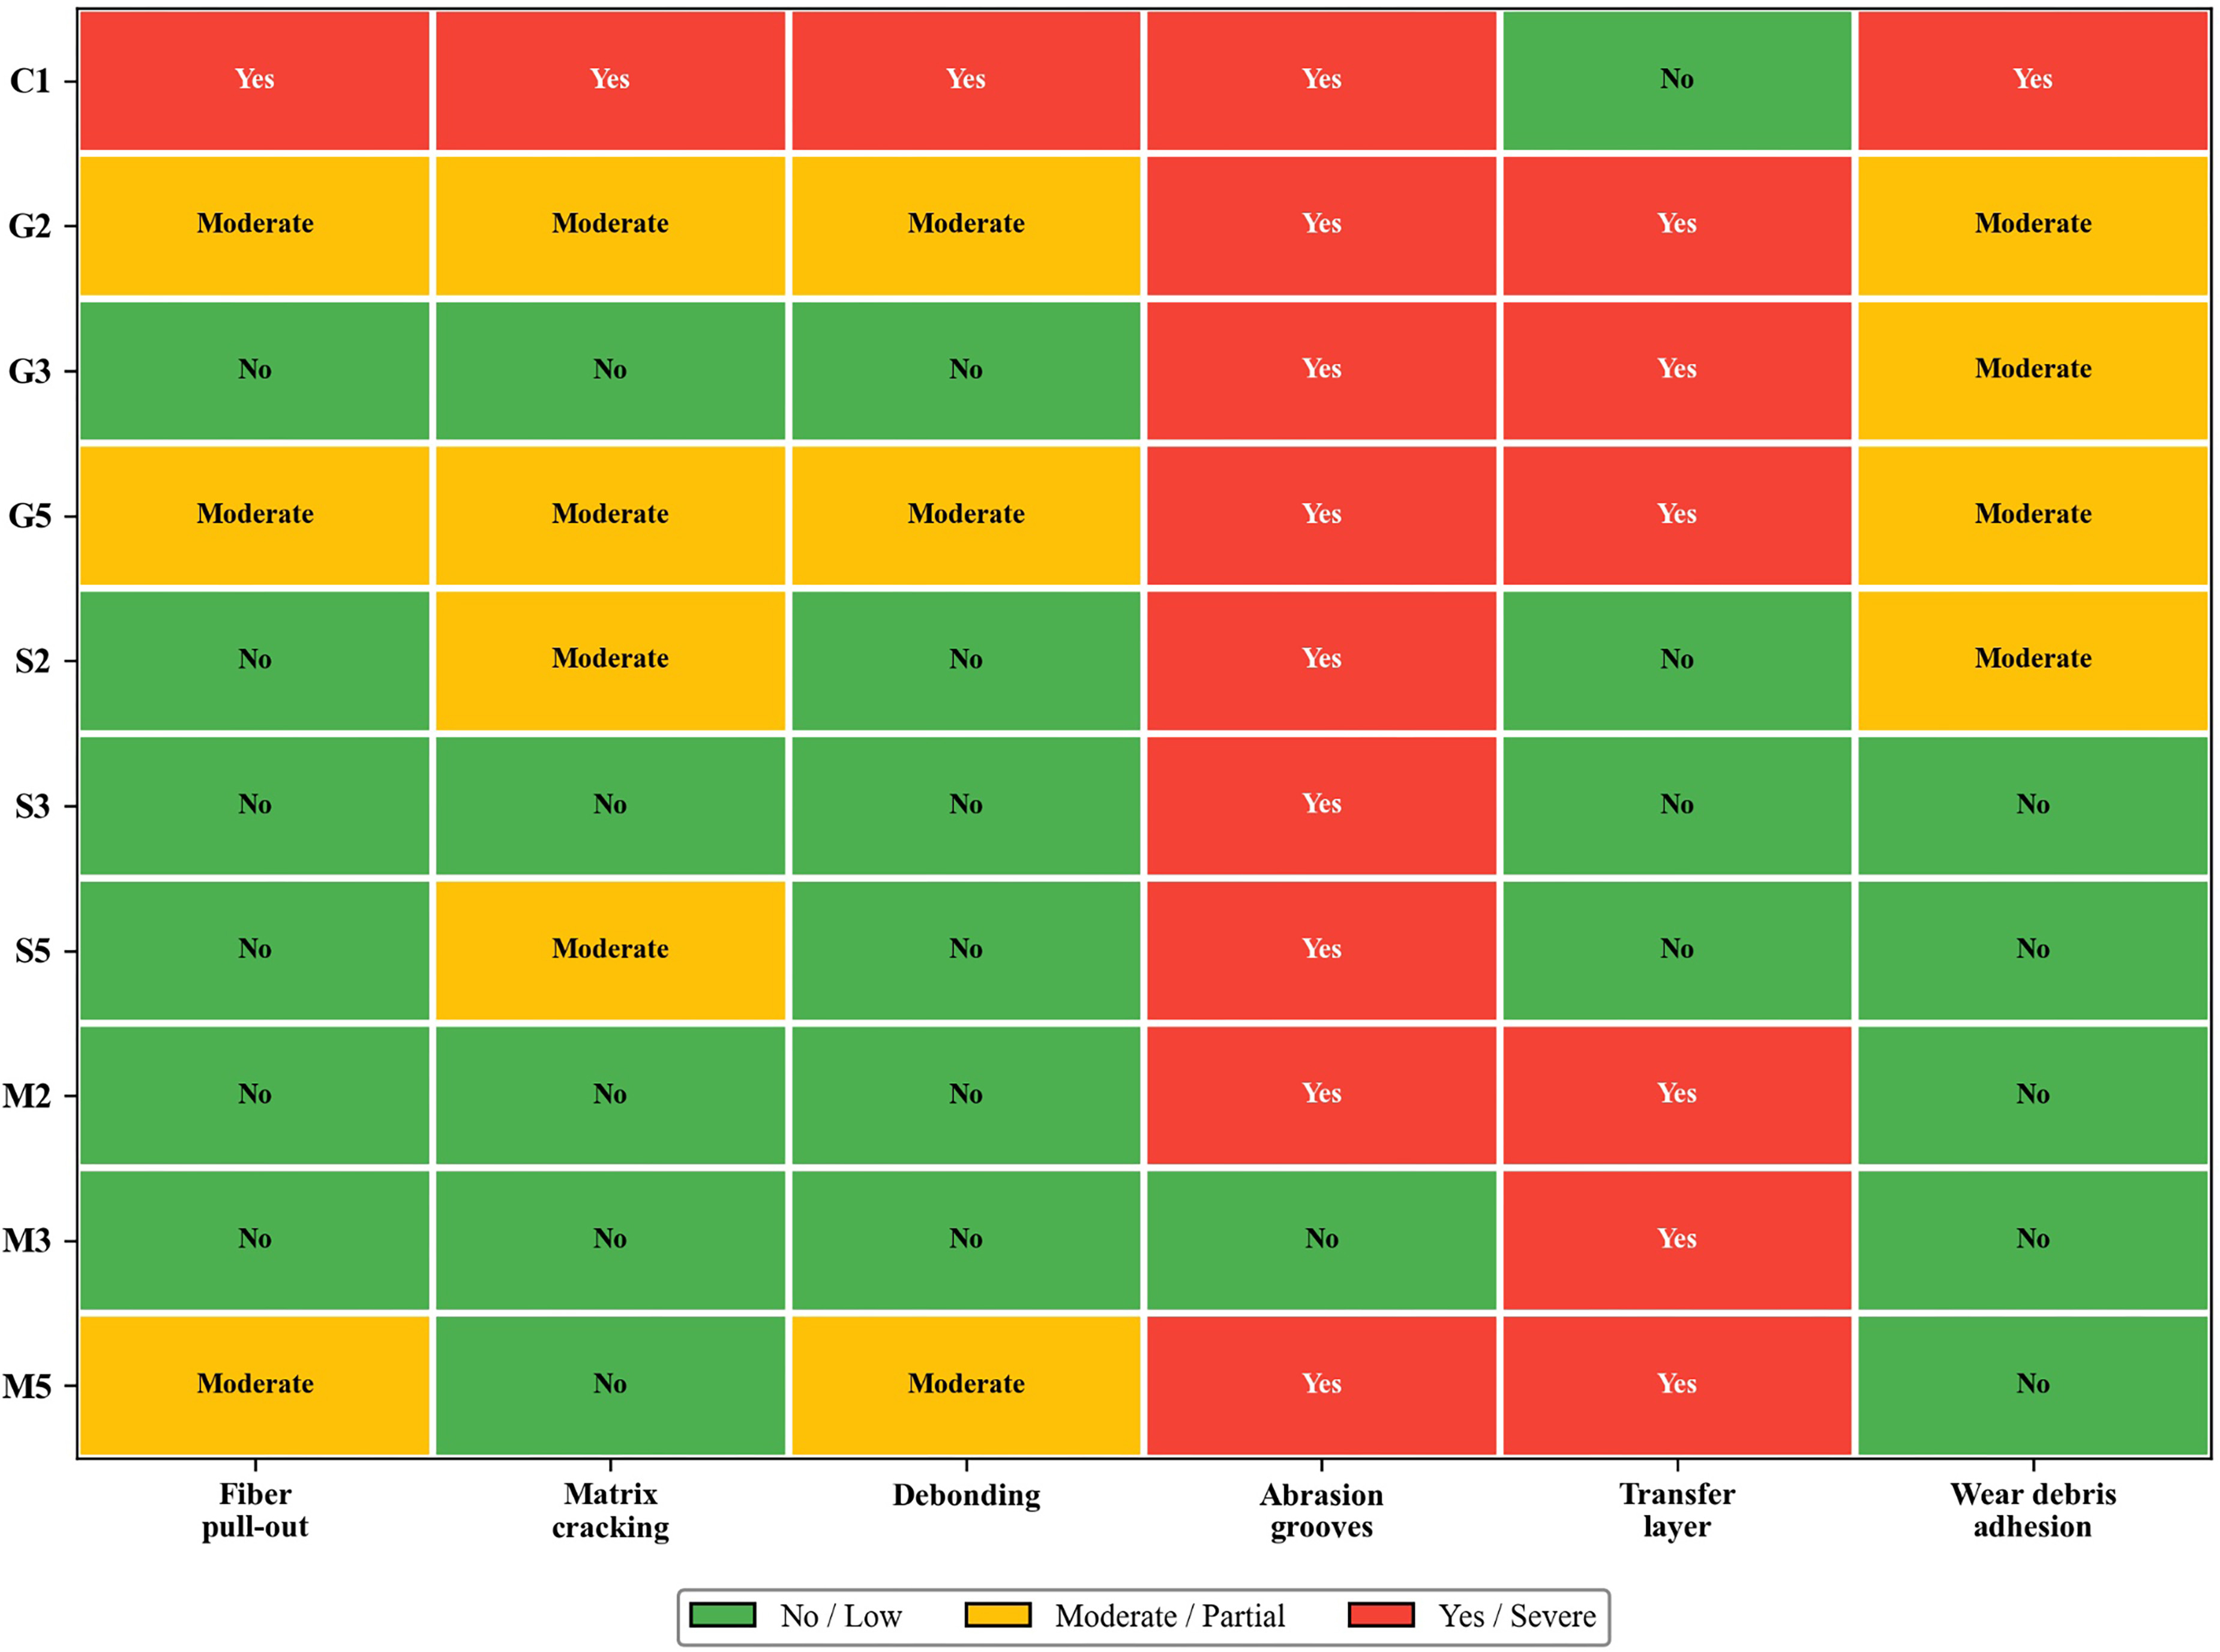
Figure 12 shows a heatmap summarizing the SEM observations across all 10 composite groups at the highest tribological severity condition. The unfilled baseline C1 exhibited severe damage across all morphological categories—fibre pull-out, matrix cracking, debonding, abrasion grooves, and wear debris adhesion—with no detectable transfer layer, confirming that the unprotected epoxy matrix undergoes severe surface degradation under dry sliding. The graphite-filled composites showed progressive damage mitigation with increasing filler content up to a filler loading of 3 wt.%, with G3 exhibiting no fibre pull-out, no matrix cracking, and no debonding, along with the formation of a visible transfer layer. G5 (5 wt.%) exhibited moderate fibre pull-out and matrix cracking, attributed to agglomerate-induced interfacial discontinuities that locally weaken the laminate [36]. The SiC-filled composites effectively suppressed fibre pull-out, debonding, and debris adhesion across all loadings, with S3 and S5 showing the cleanest worn surfaces characterized only by abrasion grooves—a signature of the micro-cutting action of angular SiC particles and the steel counterface. The absence of transfer layer formation in SiC composites confirms that their wear reduction mechanism operates through load-bearing reinforcement rather than interfacial lubrication. The MoS2-filled composites combined the suppression of fibre pull-out, matrix cracking, and debonding with prominent transfer-layer formation, particularly at M3, which exhibited the least-damaged surface among all groups. M5 (5 wt.%) showed moderate fibre pull-out and debonding, indicating that excess MoS2 weakens the filler–matrix interface despite sustaining tribofilm formation. These observations provide direct microstructural evidence supporting the quantitative mechanical and tribological trends observed in the preceding figures [37,38,39].
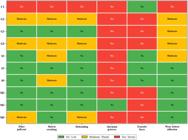
SEM-based qualitative assessment of worn surface features for all composite designations showing the severity of fibre pull-out, matrix cracking, debonding, abrasion grooves, transfer layer formation, and wear debris adhesion.
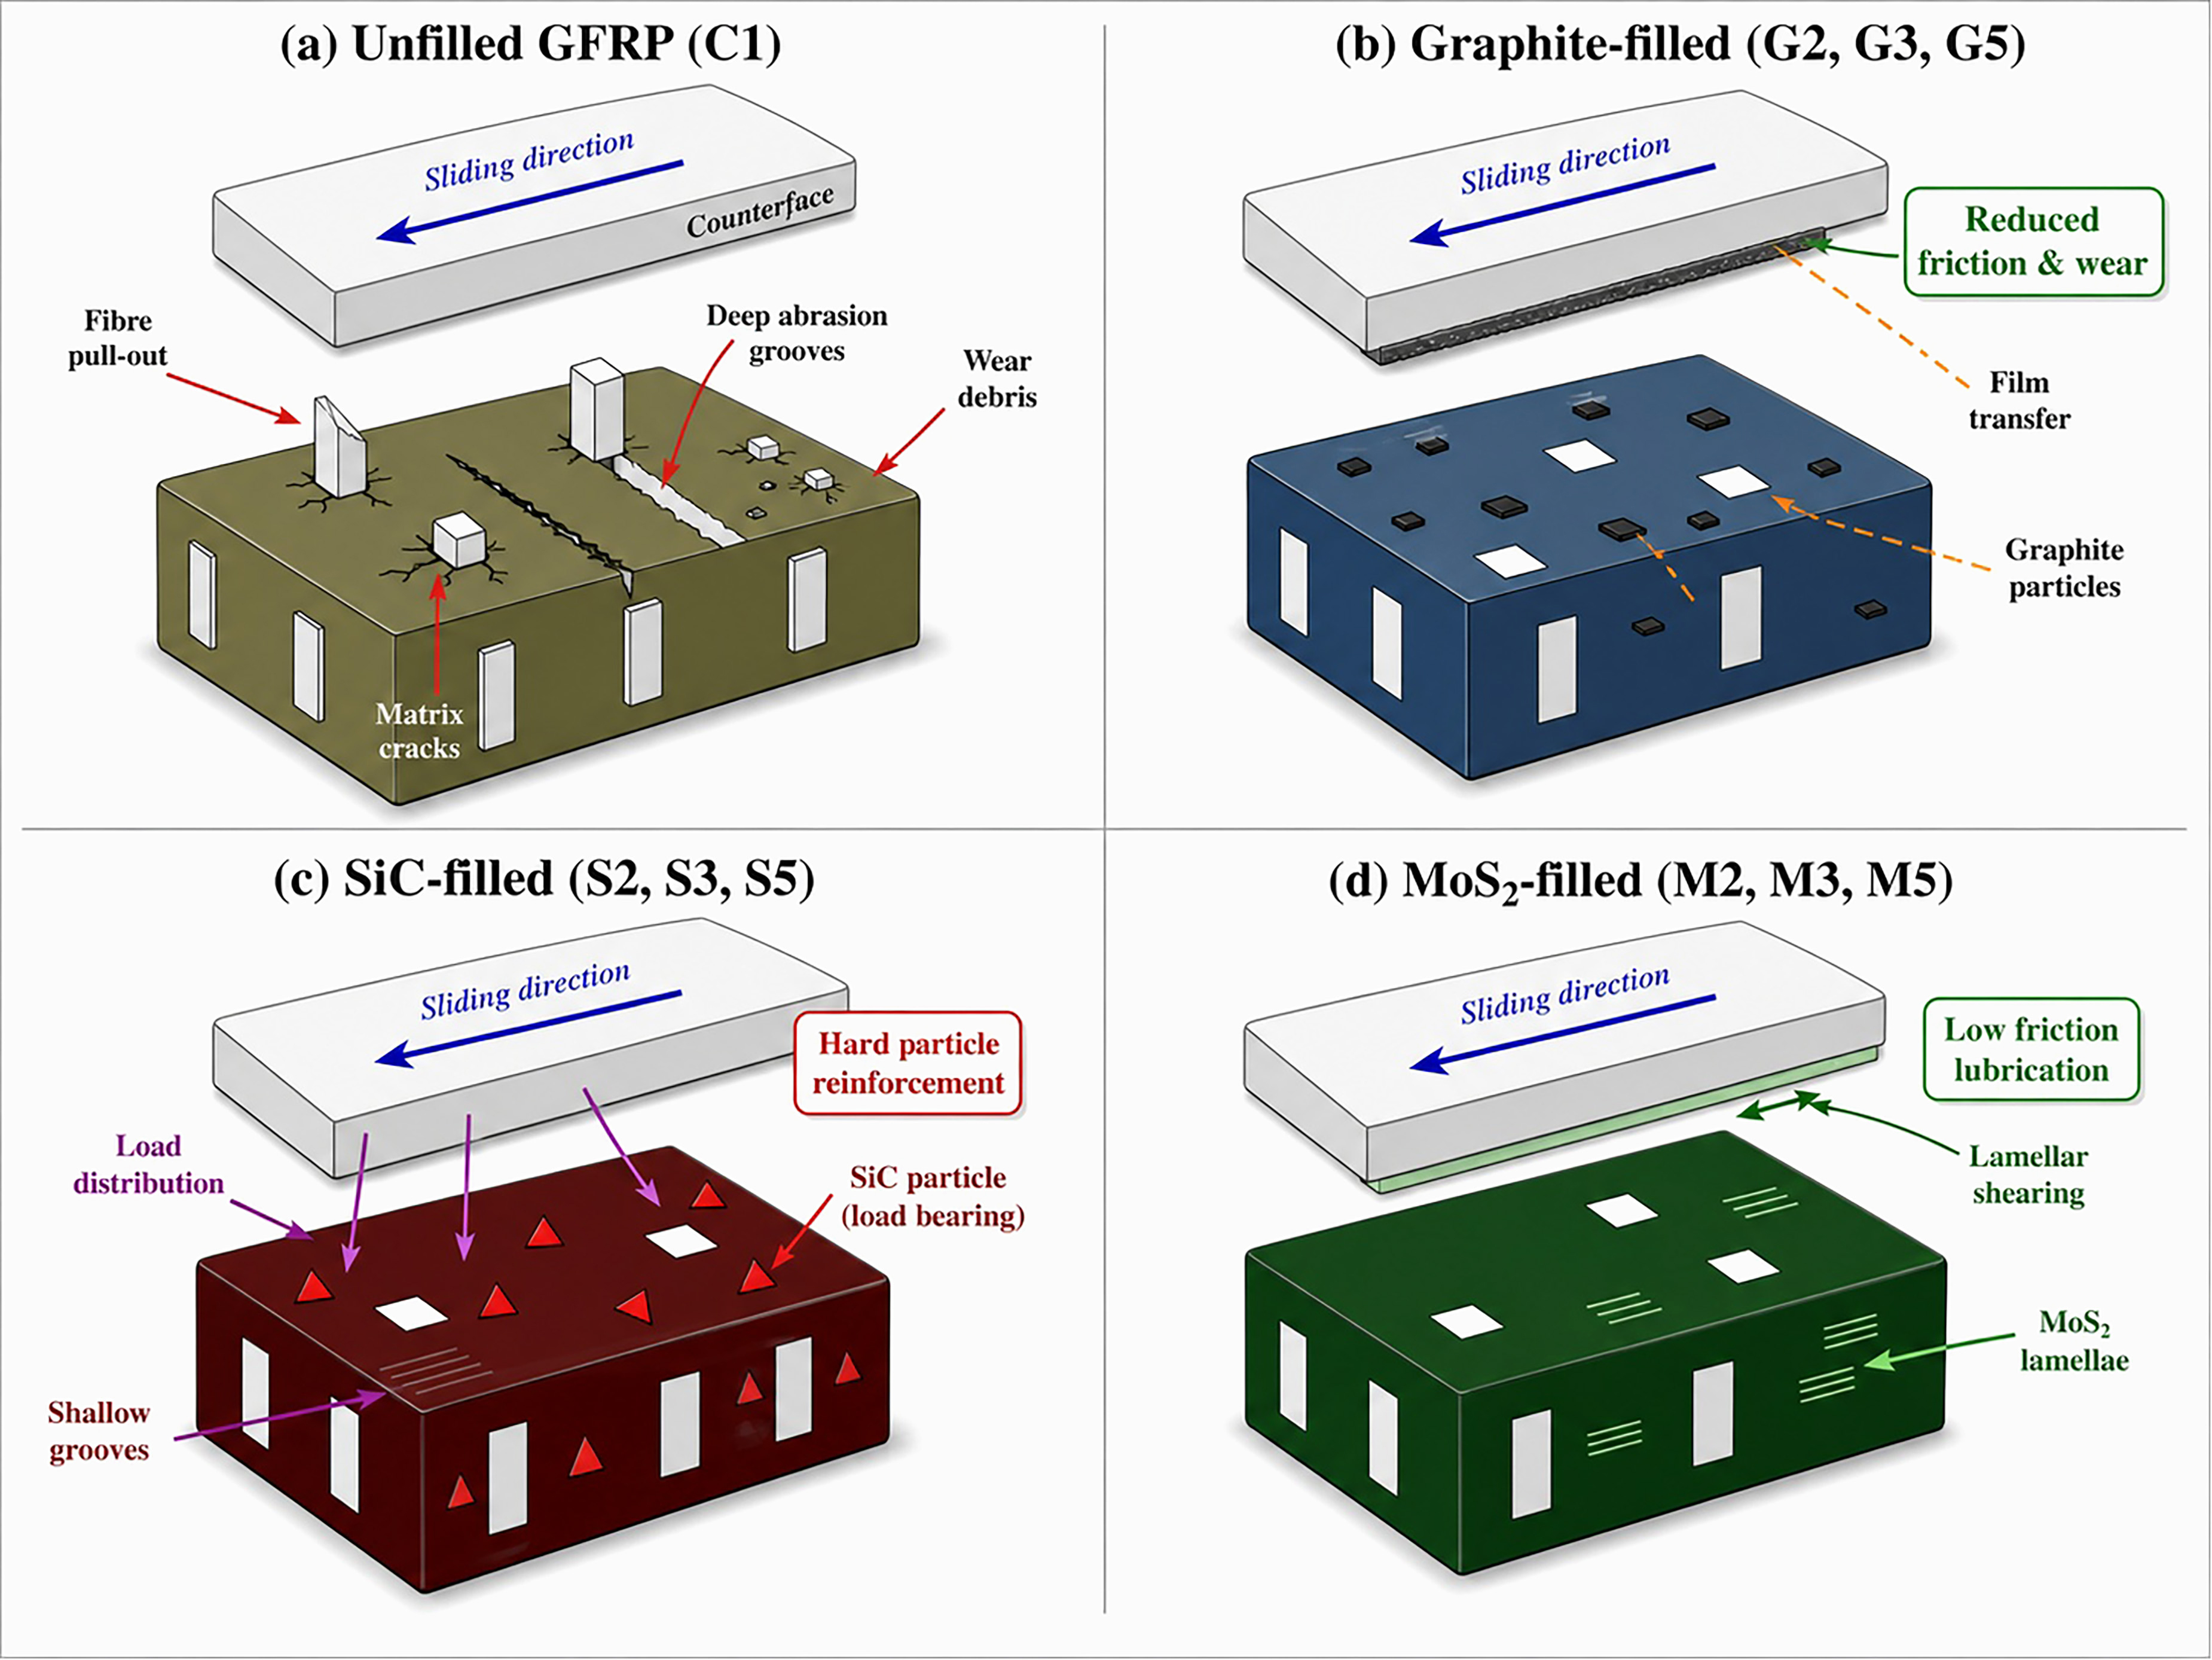
Figure 13 shows the four distinct wear mechanism regimes identified across the composite systems based on SEM observations and tribological data. The unfilled GFRP (C1) undergoes severe adhesive and abrasive wear characterized by deep abrasion grooves, extensive fibre pull-out, matrix cracking, and generation of coarse wear debris. The absence of any protective interlayer results in direct polymer–steel contact, producing the highest friction coefficient (0.628), specific wear rate (2.81 × 10⁻⁴ mm3/N·m), and surface roughness (1.883 µm). The graphite-filled composites (G2, G3, G5) operate via a transfer-film mechanism, in which graphite platelets released from the matrix during sliding accumulate on the steel counterface to form a carbonaceous transfer film. This film reduces adhesive junction formation and lowers interfacial shear stress, producing friction coefficients as low as 0.435 (G3) and shallower abrasion grooves. The SiC-filled composites (S2, S3, S5) function through a hard-particle load-bearing mechanism in which rigid SiC particles protrude from the matrix surface, bear a fraction of the applied normal load, and distribute contact stresses across a larger area. This mechanism restricts deep ploughing, yields the lowest specific wear rate (1.70 × 10⁻⁴ for S5), and enhances hardness (90.0 Shore D for S5), but does not substantially reduce friction due to the absence of a low-shear interlayer. The MoS2-filled composites (M2, M3, M5) generate a lubricating tribofilm through basal-plane lamellar shearing of MoS2 crystallites. This continuous tribofilm dramatically reduces both friction (0.374 for M3) and wear (1.75 × 10⁻⁴ for M3), while simultaneously preserving surface smoothness and enhancing impact energy absorption through frictional sliding along weak van der Waals planes [40].
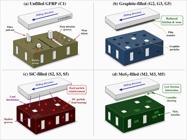
Wear mechanisms for unfilled, graphite-filled, SiC-filled, and MoS₂-filled glass fiber reinforced epoxy composites under dry sliding against a steel counterface.
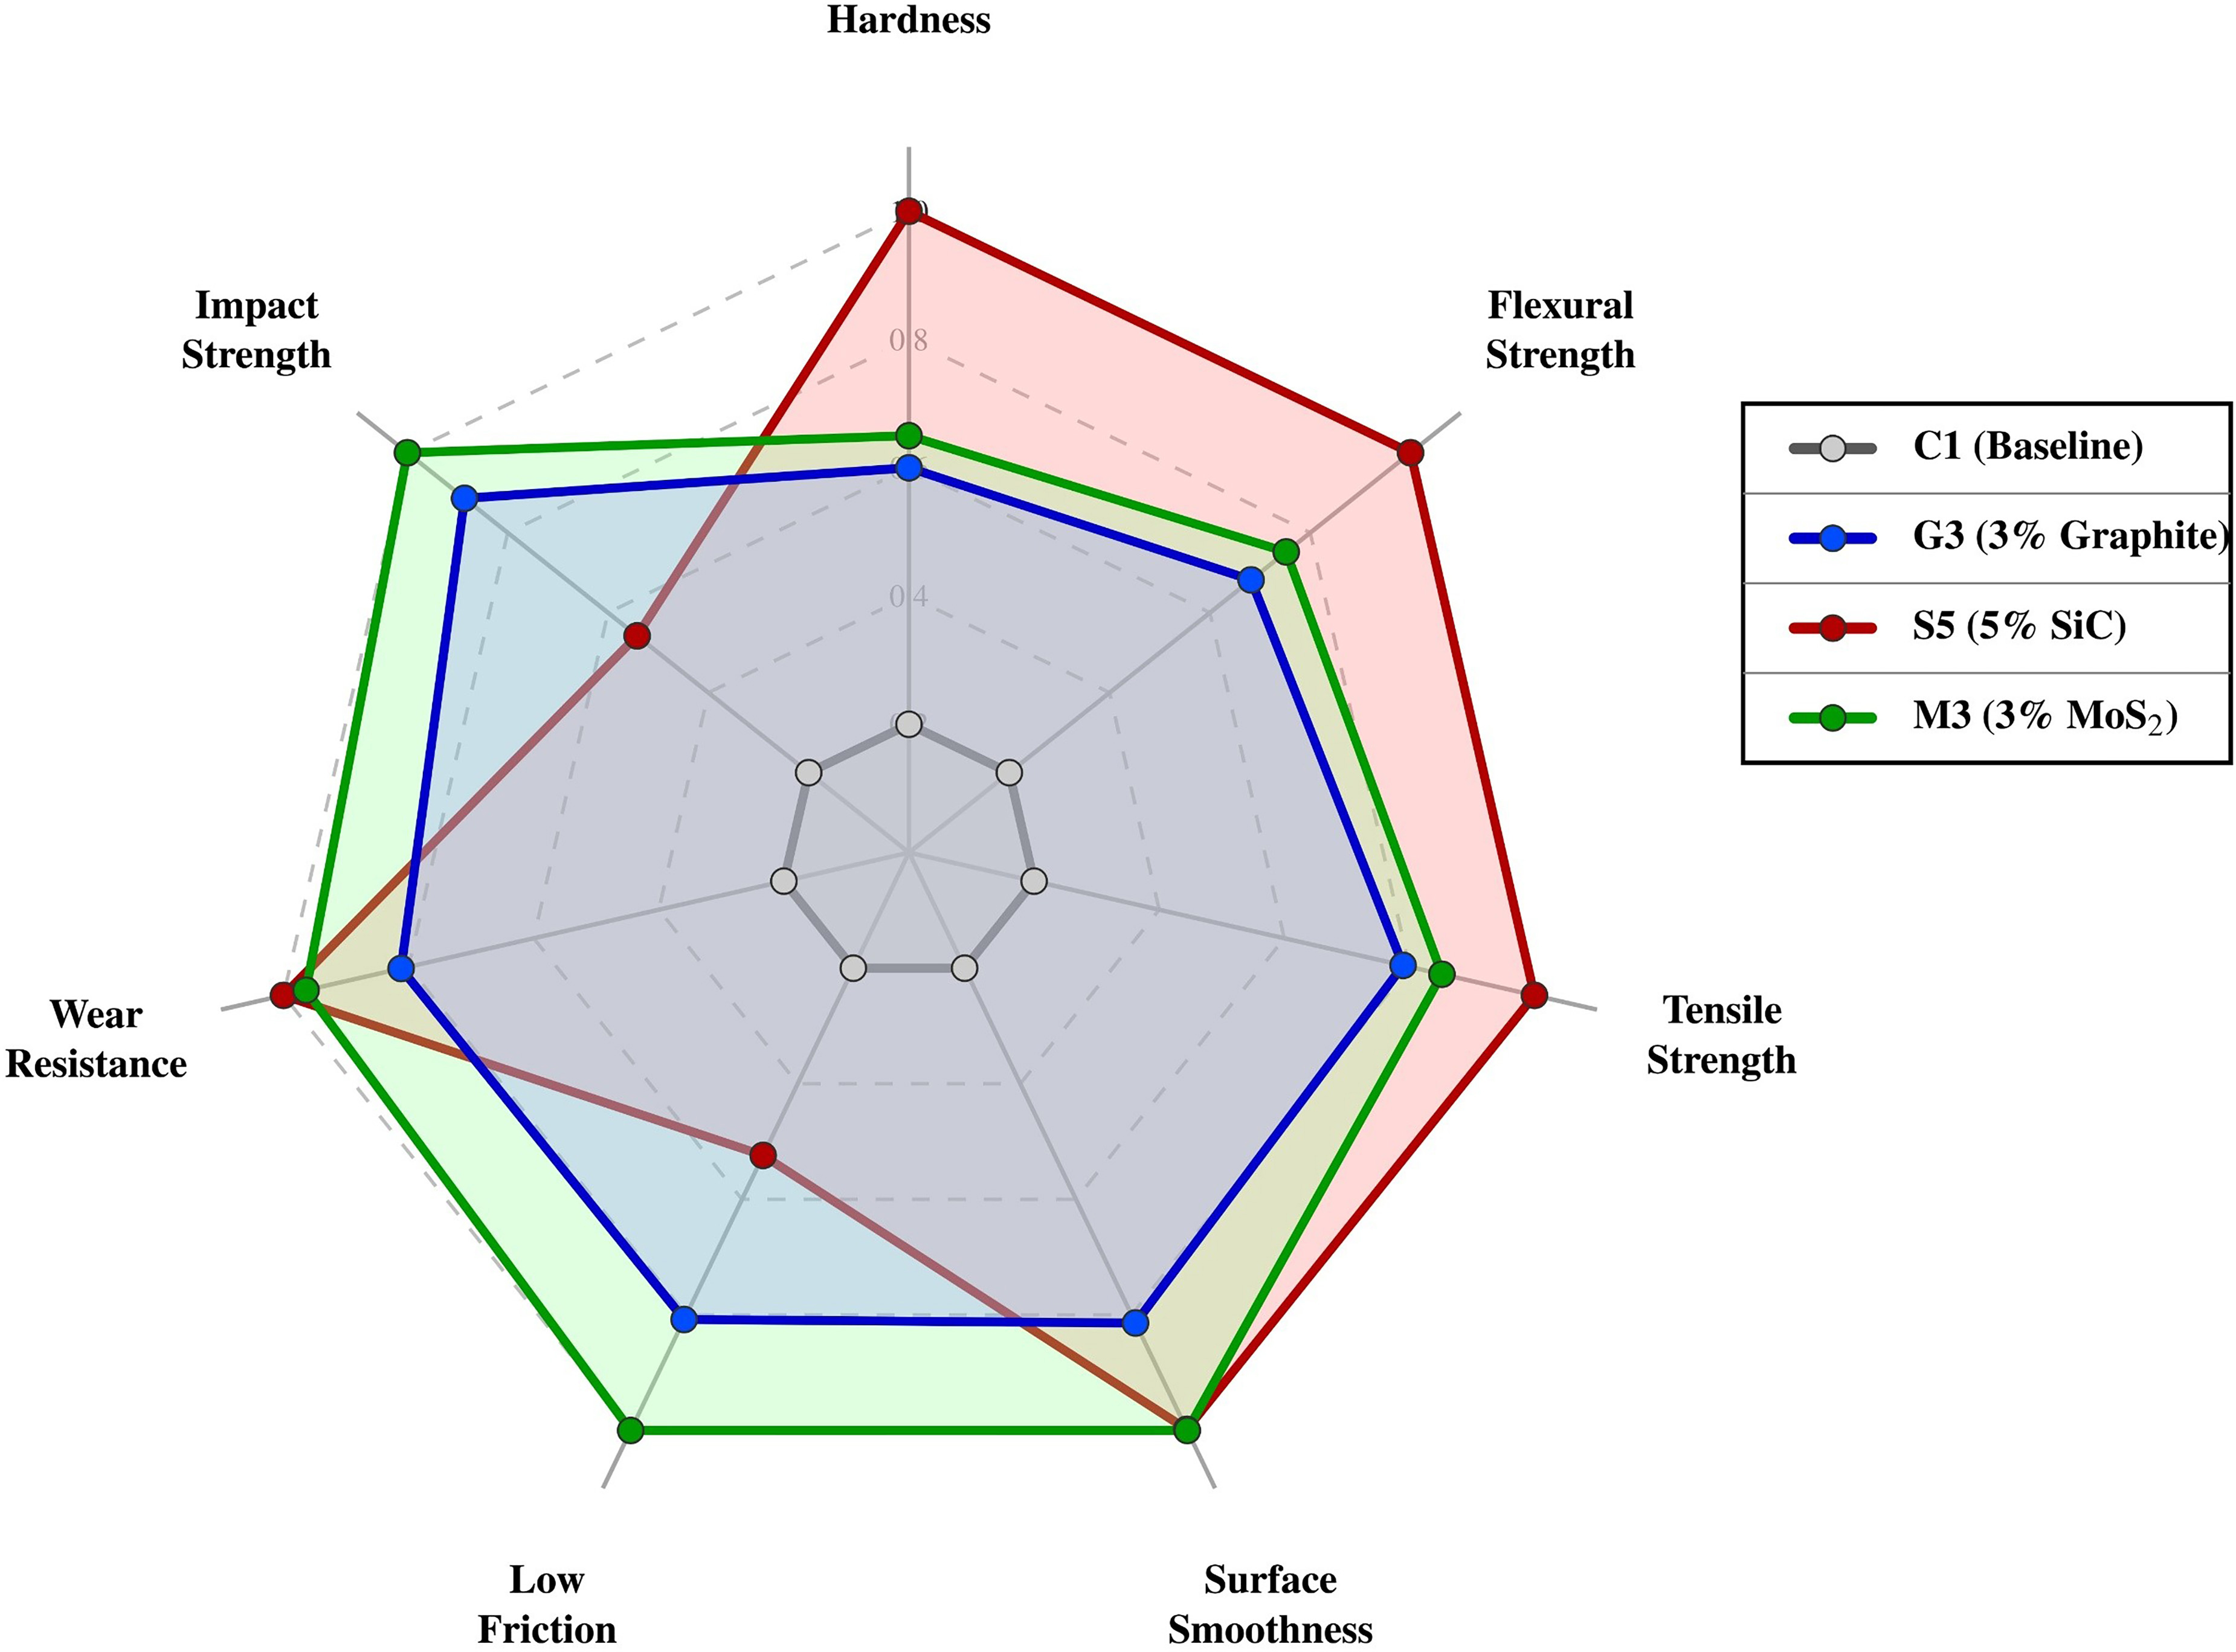
Figure 14 shows a radar chart comparing the normalized performance of the three best-performing filled composites—G3 (3 wt.% graphite), S5 (5 wt.% SiC), and M3 (3 wt.% MoS2)—against the unfilled baseline C1 across seven response parameters: tensile strength, flexural strength, hardness, impact strength, wear resistance, low friction, and surface smoothness. The baseline C1 shows the lowest normalized valuesacross all axes, confirming its inferior performance compared to all filled systems. S5 dominates the mechanical property axes, achieving the highest normalized scores for tensile strength (328 MPa), flexural strength (438 MPa), and hardness (90.0 Shore D), consistent with the rigid particle reinforcement mechanism of SiC. S5 also exhibits the highest wear resistance, reflecting its ability to withstand contact loads and limit material removal. M3 dominates the tribological property axes, achieving the highest normalized scores for low friction (COF 0.374) and surface smoothness (Ra 1.510 µm), alongside the highest impact strength (65.0 kJ/m2) among all composites. The lubricating tribofilm generated by MoS2 at 3 wt.% loading simultaneously reduces interfacial shear stress and preserves worn-surface integrity, while the lamellar energy dissipation mechanism enhances dynamic toughness. G3 occupies an intermediate position, offering balanced improvements across all parameters without exhibiting the highest value for any individual response, making it a good general-purpose filler. The radar chart reveals that no single filler system simultaneously optimizes all seven parameters, suggesting that application-specific filler selection is necessary: SiC for load-bearing structural applications requiring maximum strength and wear resistance, MoS2 for sliding-contact applications demanding minimum friction and maximum toughness, and graphite for applications requiring balanced multi-functional performance.
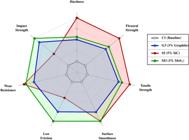
Normalized multi-attribute performance comparison of the best-performing composites G3 (3 wt.% graphite), S5 (5 wt.% SiC), and M3 (3 wt.% MoS₂) against the unfilled baseline C1 across seven mechanical and tribological response parameters.
4. RSM RESULTS AND OPTIMIZATION OF TRIBOLOGICAL RESPONSES
Response surface methodology was applied to evaluate the effect of applied load and sliding speed on the tribological performance of the selected representative composites, namely G3, S5, and M3. These three materials were selected as representative high-performing formulationsfrom the graphite-, SiC-, and MoS2-filled groups, respectively, based on their optimal combination of measured properties. Quadratic models were fitted for specific wear rate, coefficient of friction, and surface roughness using coded factors, where A = (L – 20)/10 and B = (V – 2), with L in N and V in m/s.
For G3, the fitted quadratic model for specific wear rate was highly significant, with R2 = 0.976 and p < 0.001. The coefficient of friction model was also significant, with R2 = 0.896, while the surface roughness model showed an good fit with R2 = 0.989. The positive coefficients for load and speed in the wear-rate model indicated that material loss increased with increasing tribological severity. In the friction model, load exerted a positive effect, whereas speed exerted a negative effect, indicating that friction decreased slightly at higher sliding speeds within the studied range. The roughness model showed strong positive contributions from both load and speed, indicating progressive surface damage under more severe contact conditions.
For S5, all three quadratic models were statistically significant. The wear-rate model gave R2 = 0.976, the friction model gave R2 = 0.904, and the roughness model gave R2 = 0.978. Among the three representative materials, S5 showed the lowest predicted specific wear rate under optimized conditions, which was consistent with the expected hard-particle reinforcement effect of SiC. The interaction term between load and speed was significant in the S5 wear-rate model, indicating that a simultaneous increase in both factors accelerated material removal more strongly than the individual effects alone.
For M3, the quadratic models also showed strong adequacy. The wear-rate model gave R2 = 0.978, the friction model gave R2 = 0.836, and the roughness model gave R2 = 0.994. The MoS2-filled system showed the lowest predicted coefficient of friction and roughness among the three selected composites at the optimized condition. This behavior was consistent with the lubricating action expected from MoS2-rich tribofilm formation. The wear-rate response of M3 remained competitive, although the minimum predicted wear rate was slightly higher than that of S5.
The optimization study indicated that the the optimal region within the investigated design spacefor all three representative materials occurred at the lower bound of load and speed within the investigated domain, namely 10 N and 1 m/s. Under these conditions, S5 had the lowest predicted specific wear rate, M3 had the lowest predicted coefficient of friction and surface roughness, and G3 showed intermediate behavior, with measurable improvement over the unfilled laminate. These findings indicated that SiC contributed most strongly to wear resistance, while MoS2 contributed most strongly to friction reduction and surface preservation. Graphite provided a balanced improvement, though its optimized response remained lower than M3 in friction control and to S5 in wear resistance.
Coded factors were defined as:
where L is the applied load in N and V is the sliding speed in m/s.
G3 composite
S5 composite
M3 composite
Response surface methodology confirmed that load and sliding speed were the dominant variables governing the tribological performance of the selected representative composites G3, S5, and M3 (Table 18). The quadratic models developed for specific wear rate, coefficient of friction, and roughness surface were statistically significant for all three materials, with values ranging from 0.836 to 0.994. Applied load and sliding speed exerted significant effects in nearly all models, while interaction effects were especially relevant for the wear-rate behavior of S5 and M3 (Table 19). Numerical optimization showed that the most favorable operating condition within the investigated design space was 10 N and 1 m/s for all three selected composites. Under this condition, S5 exhibited the lowest predicted specific wear rate (1.318 × 10⁻⁴ mm3/N\cdotpm), whereas M3 exhibited the lowest predicted coefficient of friction (0.370) and surface roughness (1.064 µm). G3 provided an intermediate response, indicating that graphite improved tribological stability but did not outperform the best SiC- and MoS2-filled systems in wear resistance and friction reduction, respectively [41].
RSM optimization results for specific wear rate, coefficient of friction, and surface roughness of G3, S5, and M3 composites.
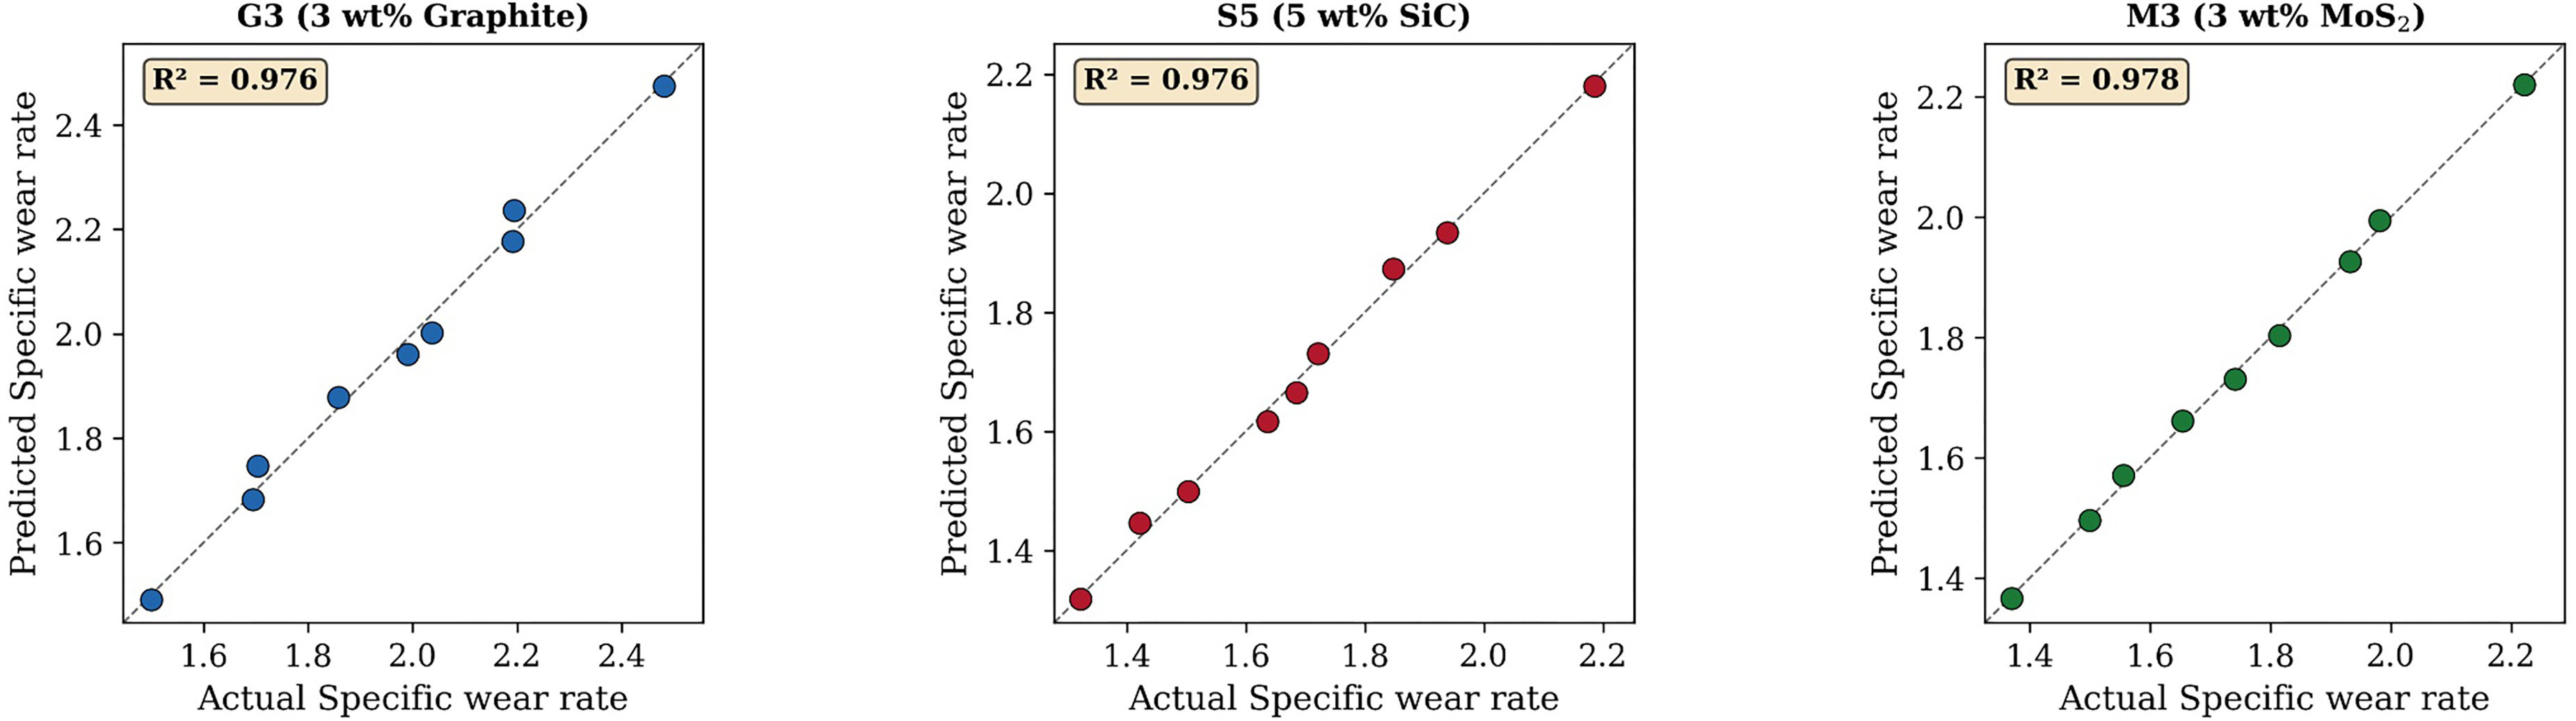
Figure 15 shows the agreement between experimentally measured and RSM-predicted specific wear rate values for the three representative composites. The data points for all three materials cluster tightly along the 45° parity line, confirming good predictive capability of the fitted quadratic models. G3 recorded R2 = 0.976, S5 recorded R2 = 0.976, and M3 recorded R2 = 0.978, indicating that the models captured more than 97% of the total variability in wear-rate response across the load–speed design space. The narrow scatter band observed for S5 reflects the consistent load-bearing action of rigid SiC particles, which stabilize the wear mechanism across varying tribological conditions [42]. M3 exhibited marginally tighter clustering at lower wear-rate magnitudes, consistent with the protective tribofilm formed by MoS2 lamellae that protects the composite surface against abrasive damage. These R2 values exceed the 0.95 threshold recommended for adequate RSM model fidelity, thereby validating the use of these quadratic equations for predictive optimization and confirming that second-order polynomial surfaces adequately represent the wear-rate response within the investigated factor domain [43].
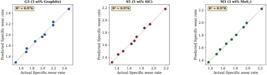
Predicted versus actual specific wear rate for G3 (3 wt% graphite), S5 (5 wt% SiC), and M3 (3 wt% MoS₂) composites derived from quadratic response surface models.
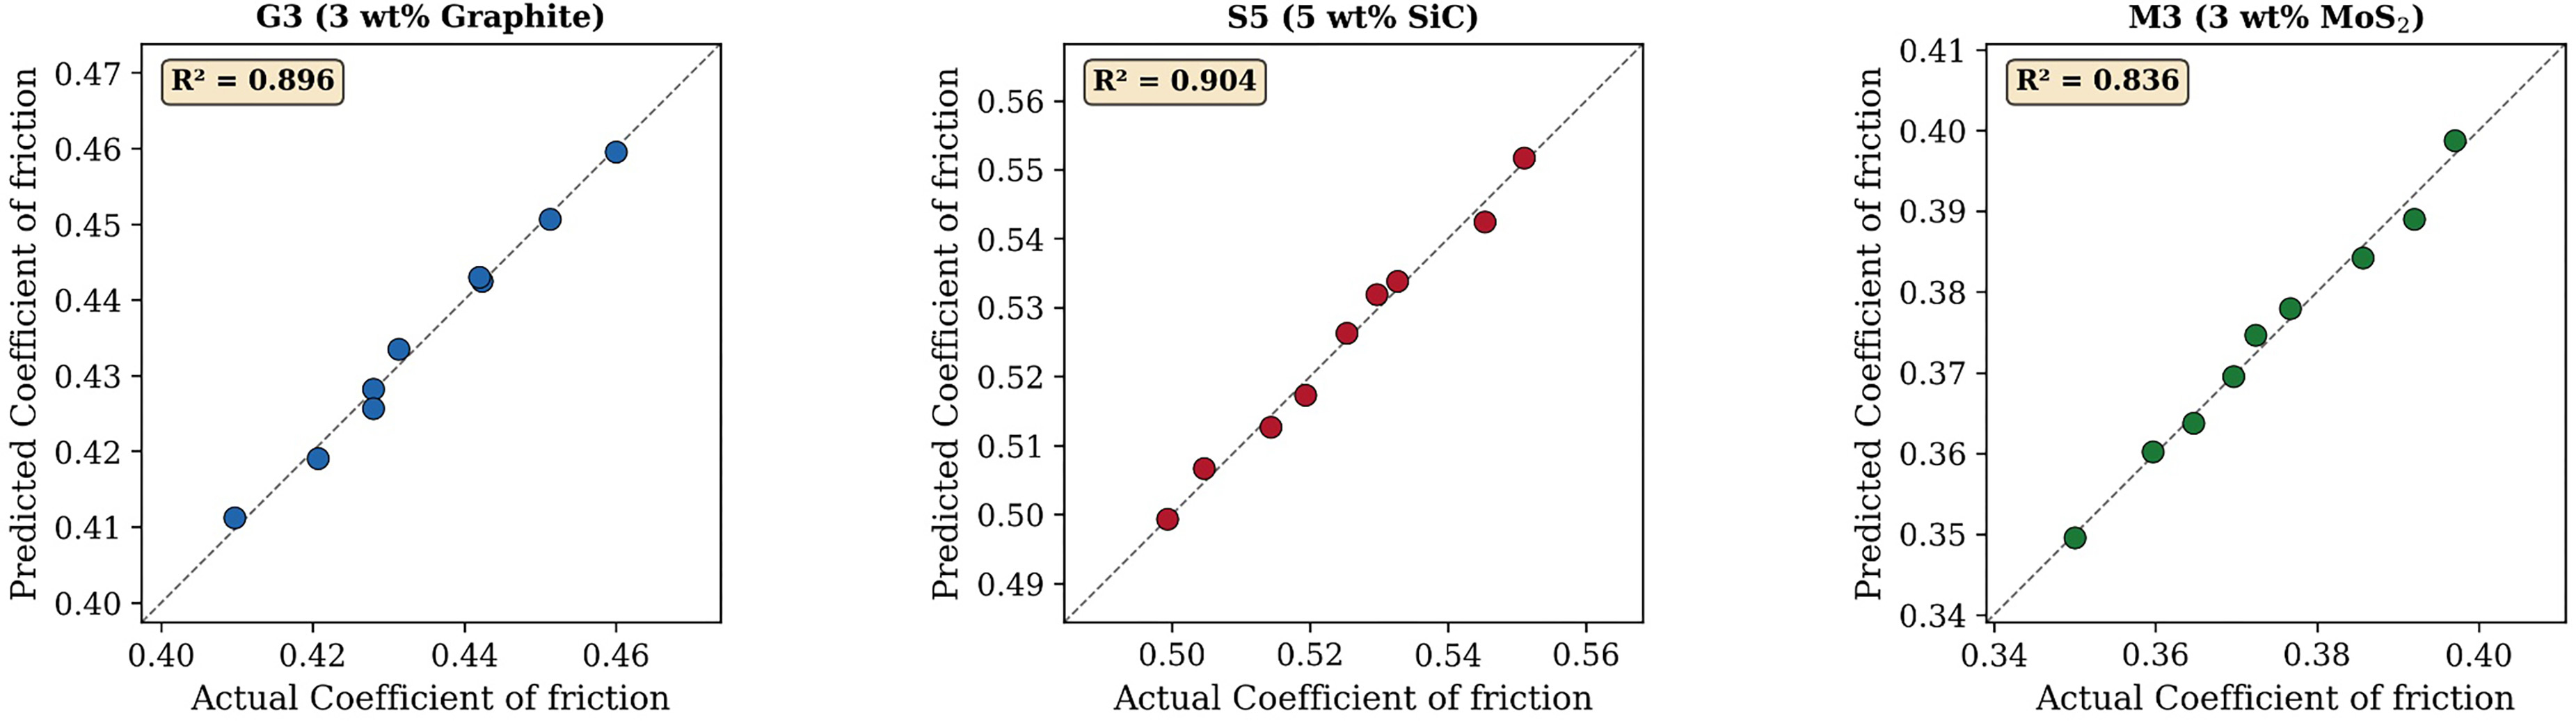
Figure 16 shows the correlation between measured and model-predicted coefficient of friction values for the three selected composites. G3 yielded R2 = 0.896, S5 yielded R2 = 0.904, and M3 yielded R2 = 0.836, indicating adequate but slightly lower model fidelity compared to the wear-rate models. The reduced R2 for M3 friction suggests that MoS2 tribofilm dynamics introduce greater variability in interfacial shear behavior that is not fully captured by a second-order polynomial. The COF values for M3 occupied the lowest range (0.36–0.40), confirming the dominant solid-lubricant mechanism of basal-plane shearing that reduces tangential resistance at the sliding interface. S5 exhibited the highest friction range (0.51–0.55), consistent with the absence of a low-shear transfer layer and the abrasive micro-ploughing action of angular SiC particles [44]. These model adequacy results confirm that filler-specific interfacial mechanisms govern the friction response and that load and speed are the primary controlling factors within the investigated domain.
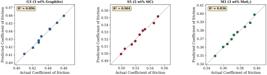
Predicted versus actual coefficient of friction for G3, S5, and M3 composites from quadratic RSM models.
Figure 17 shows the predicted-versus-actual diagnostic for worn-surface roughness across the three representative composites. The roughness models achieved the highest R2 values across all three responses: G3 (0.989), S5 (0.987), and M3 (0.994). The near-unity R2 for M3 indicates that the MoS2 tribofilm produces a highly reproducible surface finish governed by load and speed, with minimal stochastic variation. The data points for all three composites align closely along the parity line across the full Ra range from approximately 1.0 to 2.1 µm. S5 exhibited a marginally wider spread at intermediate roughness values, attributable to localized micro-cutting by protruding SiC particles, which introduce slight spatial heterogeneity in surface topography. The exceptional model fit for roughness confirms that profilometric response is the most predictable tribological output among the three studied responses, making Ra a reliable surrogate metric for monitoring worn-surface integrity under variable operating conditions [45].

Predicted versus actual surface roughness (Ra) for G3, S5, and M3 composites from quadratic RSM models.
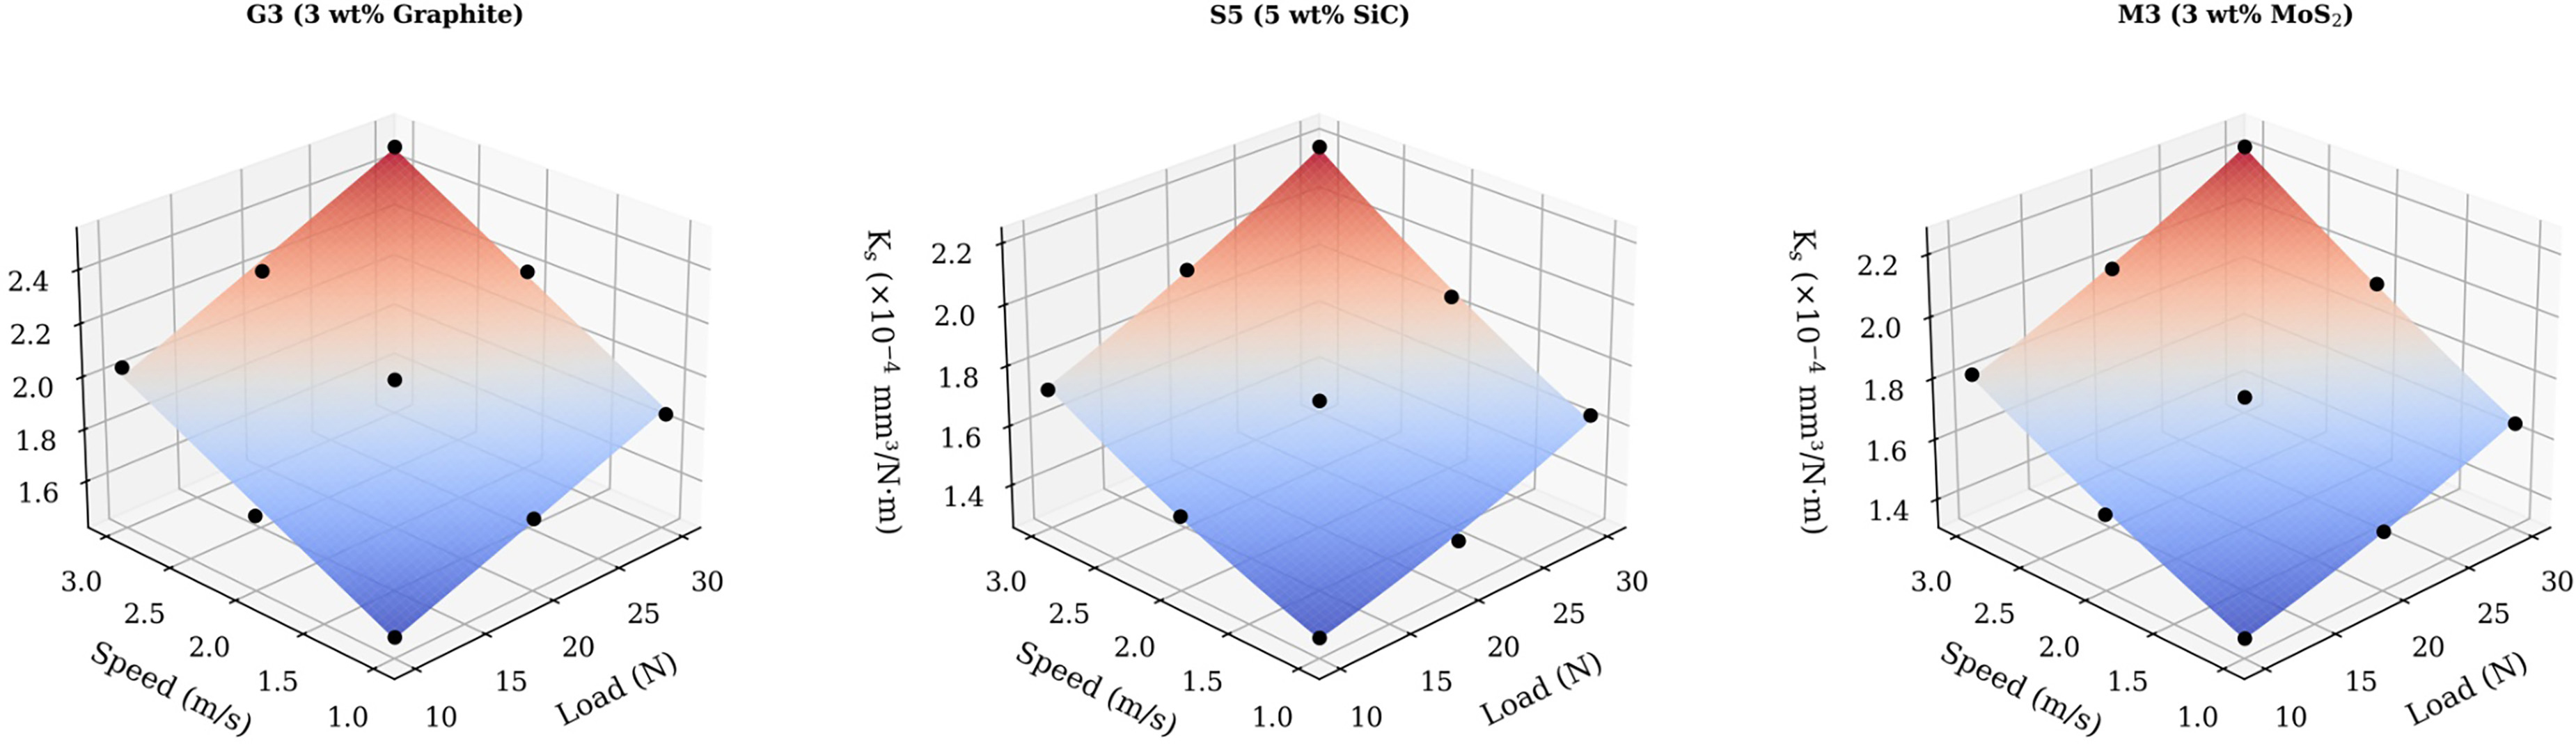
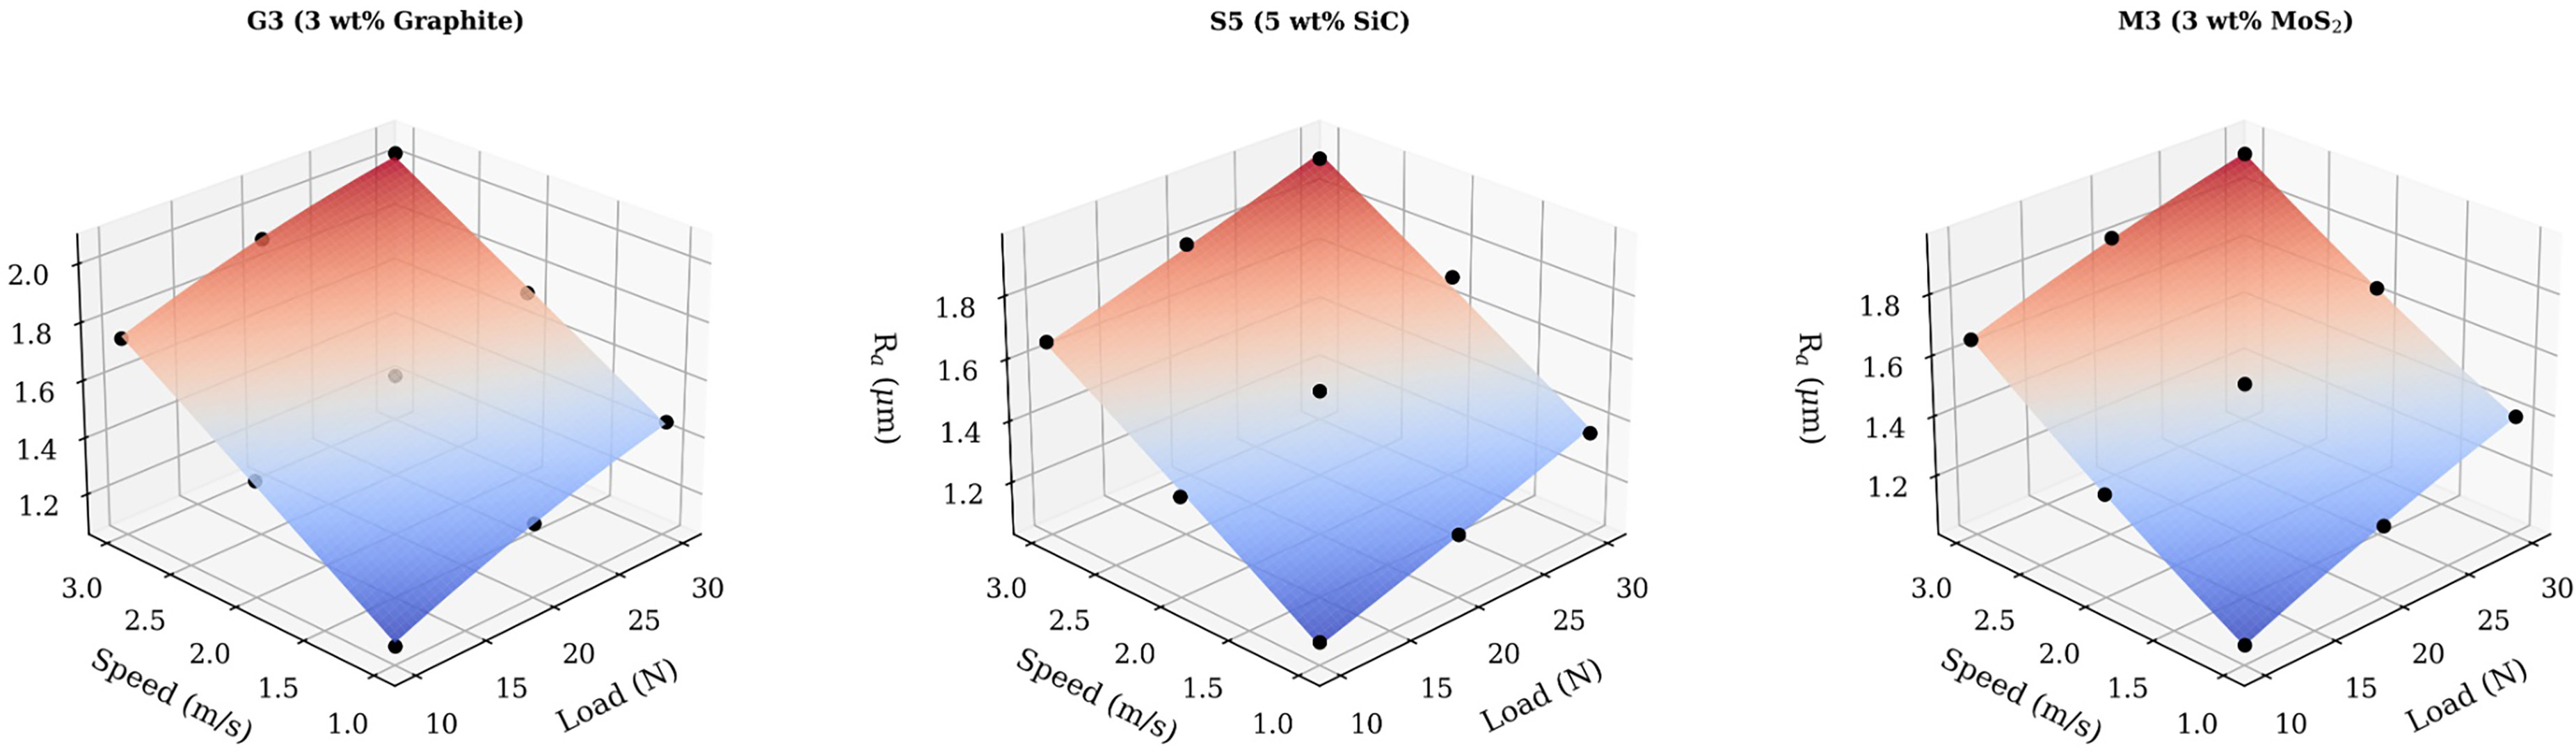
Figure 18 shows the quadratic response surfaces mapping specific wear rate against applied load (10–30 N) and sliding speed (1–3 m/s) for the three representative composites. All three surfaces exhibit a monotonic increase in wear rate from the low-load, low-speed corner toward the high-severity region, confirming that both factors promote material removal through enhanced contact stress and thermal softening. S5 produced the lowest predicted response magnitudeacross the entire domain, with predicted Ks ranging from 1.318 × 10⁻⁴ to approximately 2.15 × 10⁻⁴ mm3/N·m, attributable to the load-bearing reinforcement provided by hard SiC particles, which resist micro-cutting and distribute contact pressure [46]. The M3 surface exhibited comparable elevation at low severity but increasedmore rapidly at high load–speed combinations, indicating that the MoS2 tribofilm degrades under aggressive conditions. The significant load–speed interaction term in the S5 and M3 models produces a visible curvature in the surface that is absent in G3, where the wear-rate increase was more linearly additive [47].
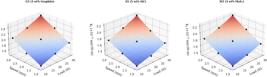
Three-dimensional response surfaces of specific wear rate as a function of applied load and sliding speed for G3, S5, and M3 composites.
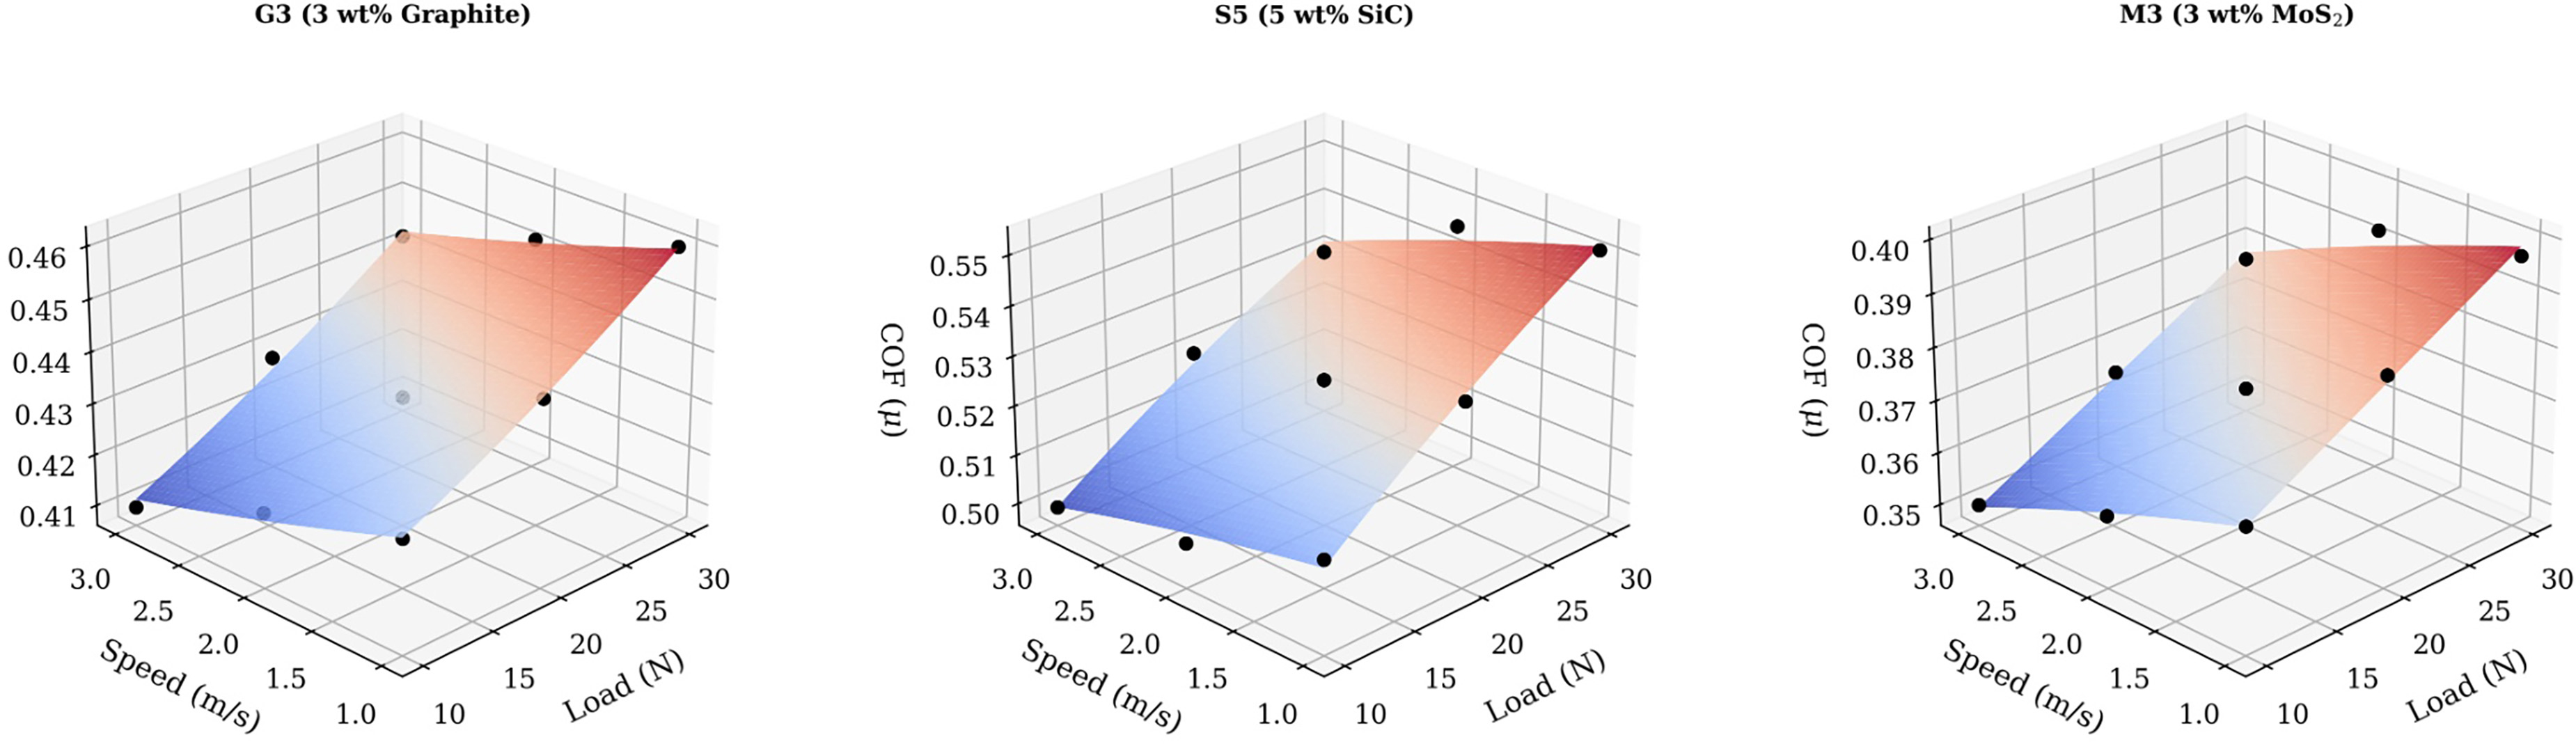
Figure 19 shows the 3D response surfaces for coefficient of friction across the load–speed domain. M3 occupies the lowest friction surface, with predicted COF values ranging from 0.370 at 10 N / 1 m/s to approximately 0.39 at 30 N / 3 m/s, reflecting the persistent lubricating action of the MoS2 tribofilm across the full operating range. G3 produced intermediate friction (0.428–0.45), consistent with the partial transfer-film mechanism of graphite that reduces adhesive junction strength but does not eliminate abrasive contributions. S5 exhibited the highest friction surface (0.513–0.55), confirming that hard-particle reinforcement enhances wear resistance without reducing interfacial shear stress. The negative coefficient of speed in the COF models for all three composites indicates that friction decreases slightly at higher sliding velocity, attributable to frictional heating that softens the matrix surface and reduces the real contact area. These surfaces demonstrate that friction reduction is governed primarily by filler lubricity rather than particle hardness [48].
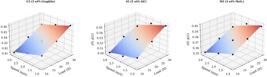
Three-dimensional response surfaces of coefficient of friction as a function of applied load and sliding speed for G3, S5, and M3 composites.
Figure 20 shows the response surfaces for worn-surface roughness across the investigated factor space. All three composites show a strong positive dependence of Ra on both load and speed, with roughness increasing from approximately 1.06–1.13 µm at the mildest condition to 1.9–2.1 µm at the most severe condition. M3 maintained the smoothest surface across the domain, with Ra values consistently 0.02–0.05 µm below those of S5 and G3, attributable to the continuous MoS2 tribofilm that shields the composite surface from direct asperity contact and prevents deep ploughing. The speed axis contributed a larger coefficient than load in all three roughness models, indicating that sliding velocity—through increased frictional temperature and material displacement rate—exerts a stronger influence on surface topography degradation than contact pressure alone. The surface curvature for M3 reflects the significant AB interaction term (p < 0.05), indicating that combined high-load and high-speed conditions synergistically accelerate surface deterioration [49].
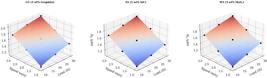
Three-dimensional response surfaces of surface roughness (Ra) as a function of applied load and sliding speed for G3, S5, and M3 composites.
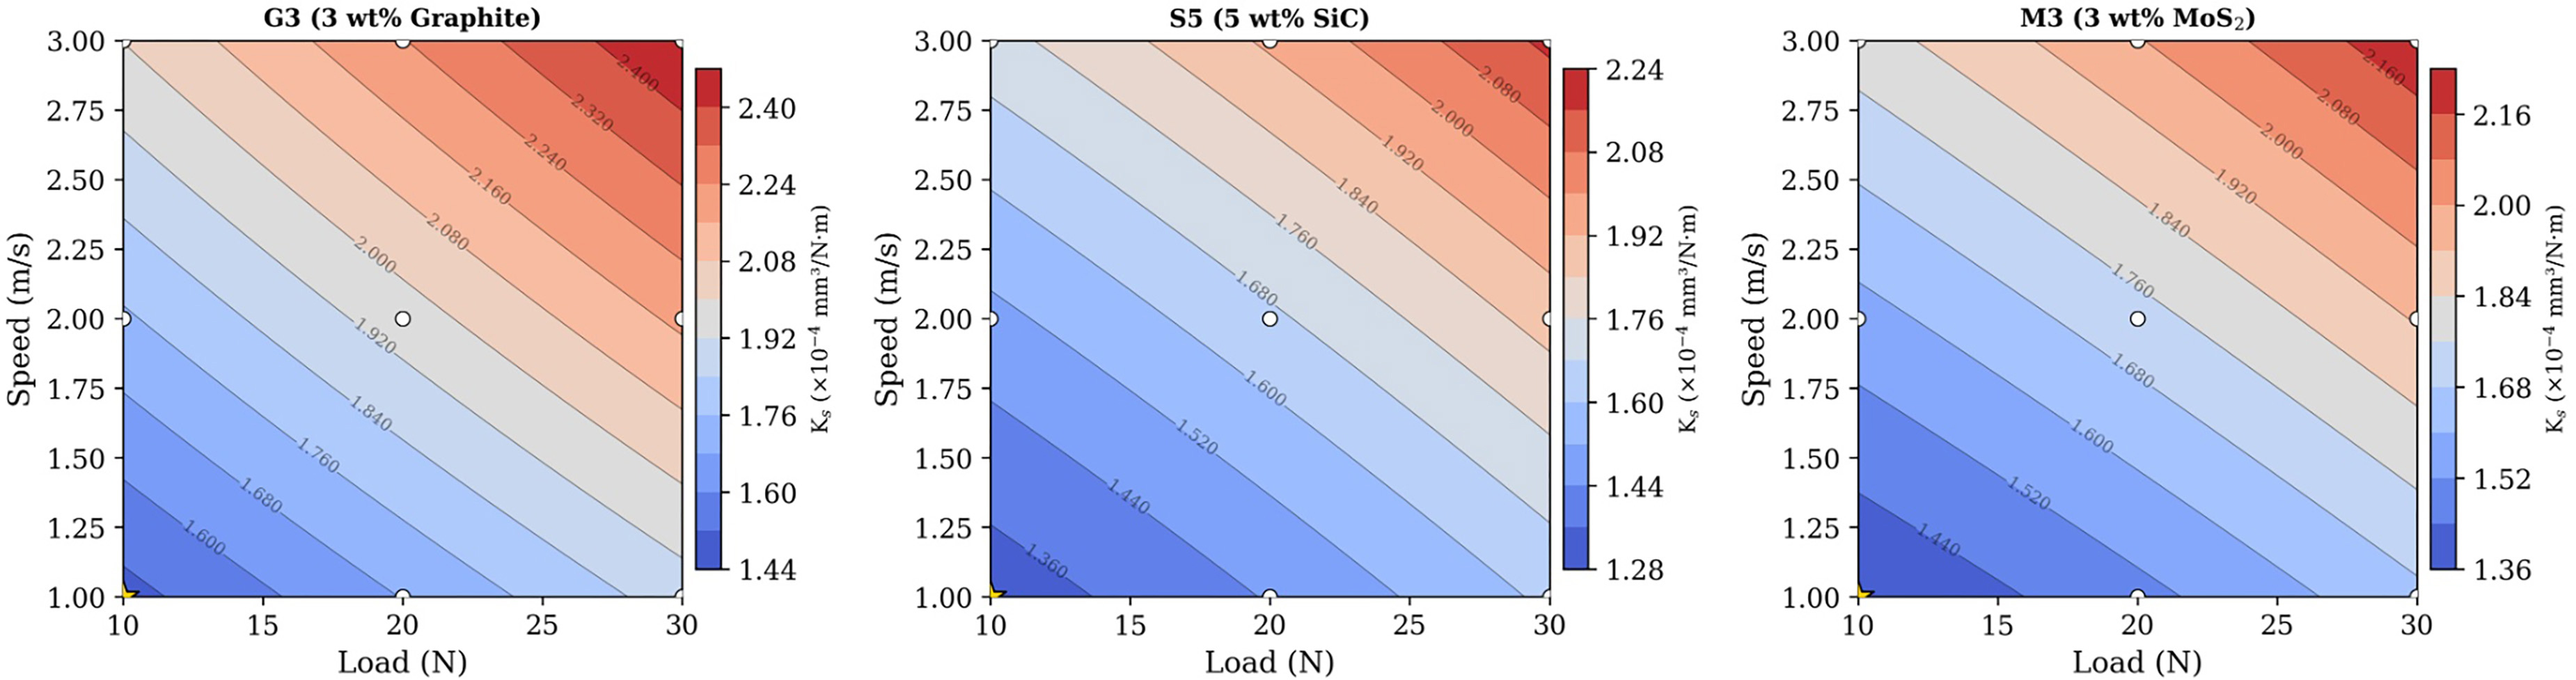
Figure 21 shows filled contour maps of specific wear rate projected onto the load–speed plane for the three representative composites. The isolines progress from the lowest wear region at the region (10 N, 1 m/s) toward the highest wear region at the top-right corner (30 N, 3 m/s) in all three panels. S5 exhibited the widest low-wear-rate zone, with the 1.4 × 10⁻⁴ isoline extending further into the design space than in G3 or M3, confirming the robust wear resistance conferred by SiC particles across a broader operating window. The contour gradient was steepest for G3, indicating that graphite-filled composites are more sensitive to changes in tribological severity. The optimum condition, marked at 10 N and 1 m/s, produced predicted wear rates of 1.491 × 10⁻⁴ (G3), 1.318 × 10⁻⁴ (S5), and 1.367 × 10⁻⁴ (M3) mm3/N·m. These contour maps enable researchers to identify suitable operating envelopes for each composite system [50].
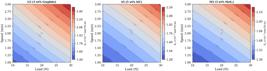
Contour plots of specific wear rate in the load–speed domain for G3, S5, and M3 composites with optimum conditions indicated.
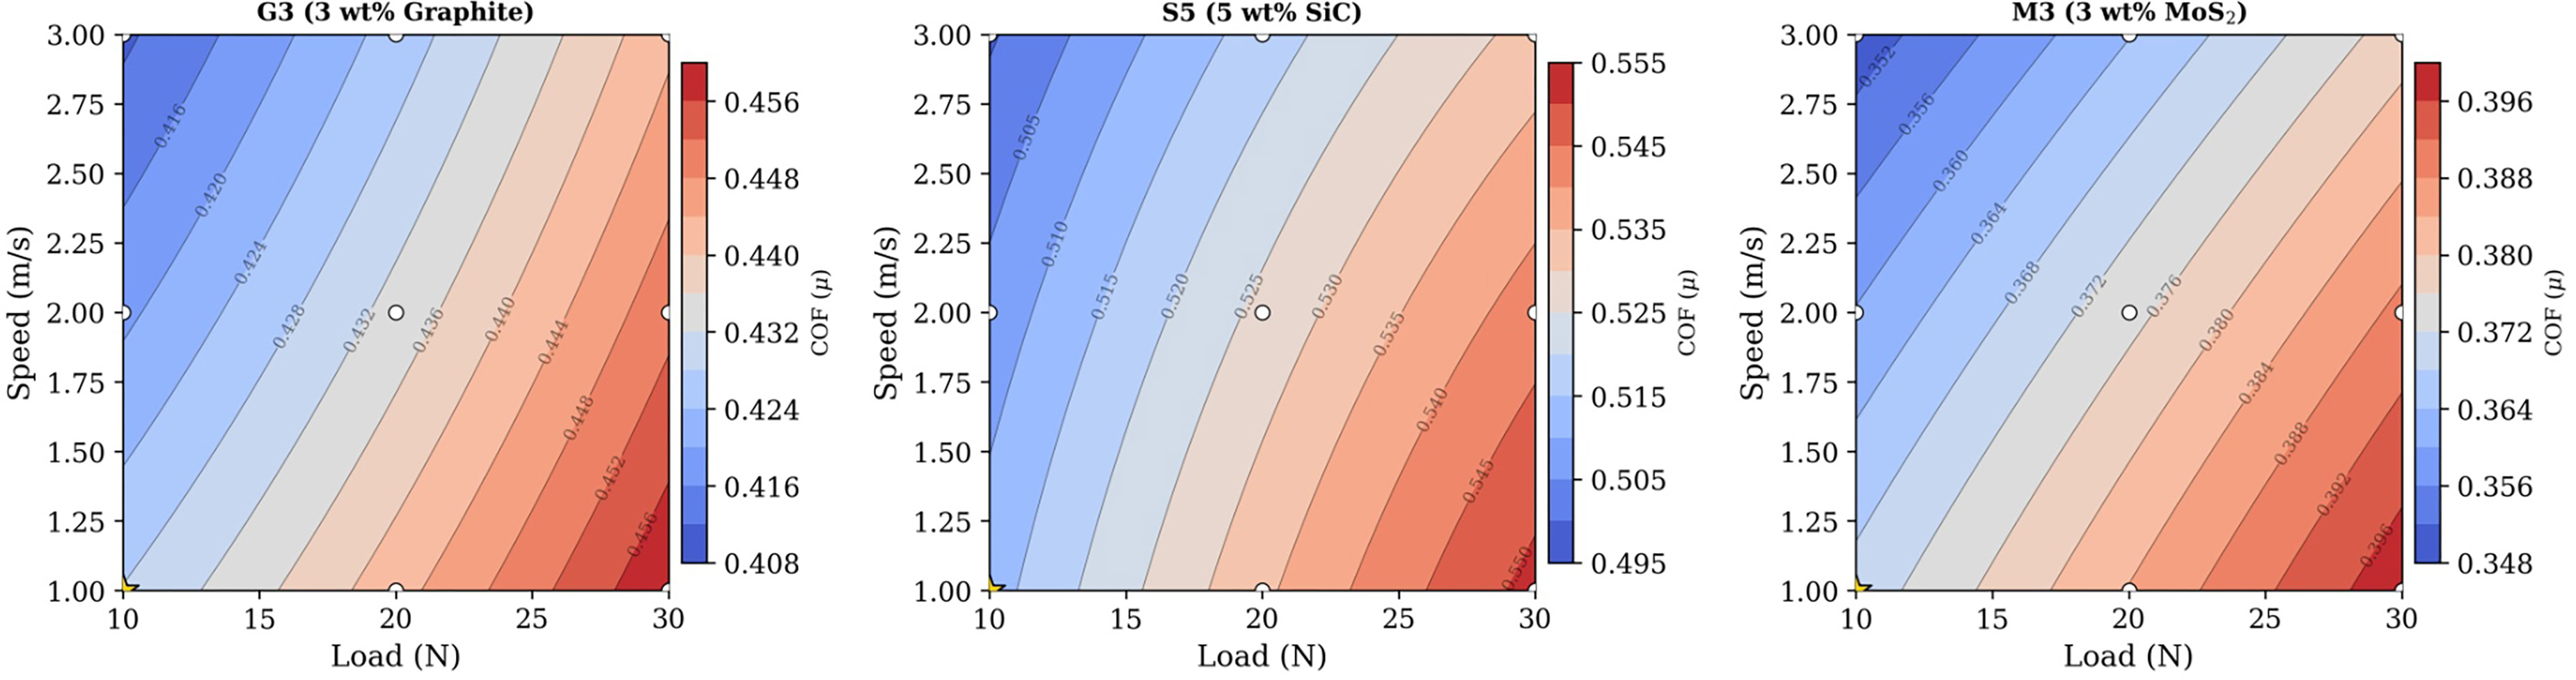
Figure 22 shows the contour distributions of coefficient of friction across the load–speed domain for G3, S5, and M3. The M3 contour map occupies a distinctly lower range (0.36–0.40) compared to G3 (0.42–0.46) and S5 (0.51–0.55), confirming the superior friction-reduction capability of the MoS2 tribofilm [51]. The isolines in the M3 panel are more widely spaced, indicating that friction varies more gradually with operating conditions when a continuous solid-lubricant film is established. The S5 panel shows tighter isoline spacing along the load axis, reflecting the stronger dependence of SiC-composite friction on contact pressure, which increases the penetration depth of hard asperities into the matrix [52]. The negative speed coefficient manifests as a slight systematic tilt of the isolines across all panels, confirming that higher sliding velocity marginally reduces friction via thermal softening. These maps identify M3 at 10 N / 1 m/s as the global friction minimum across all three composite systems [53].
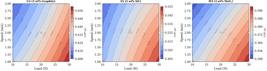
Contour plots of coefficient of friction in the load–speed domain for G3, S5, and M3 composites with optimum conditions indicated.
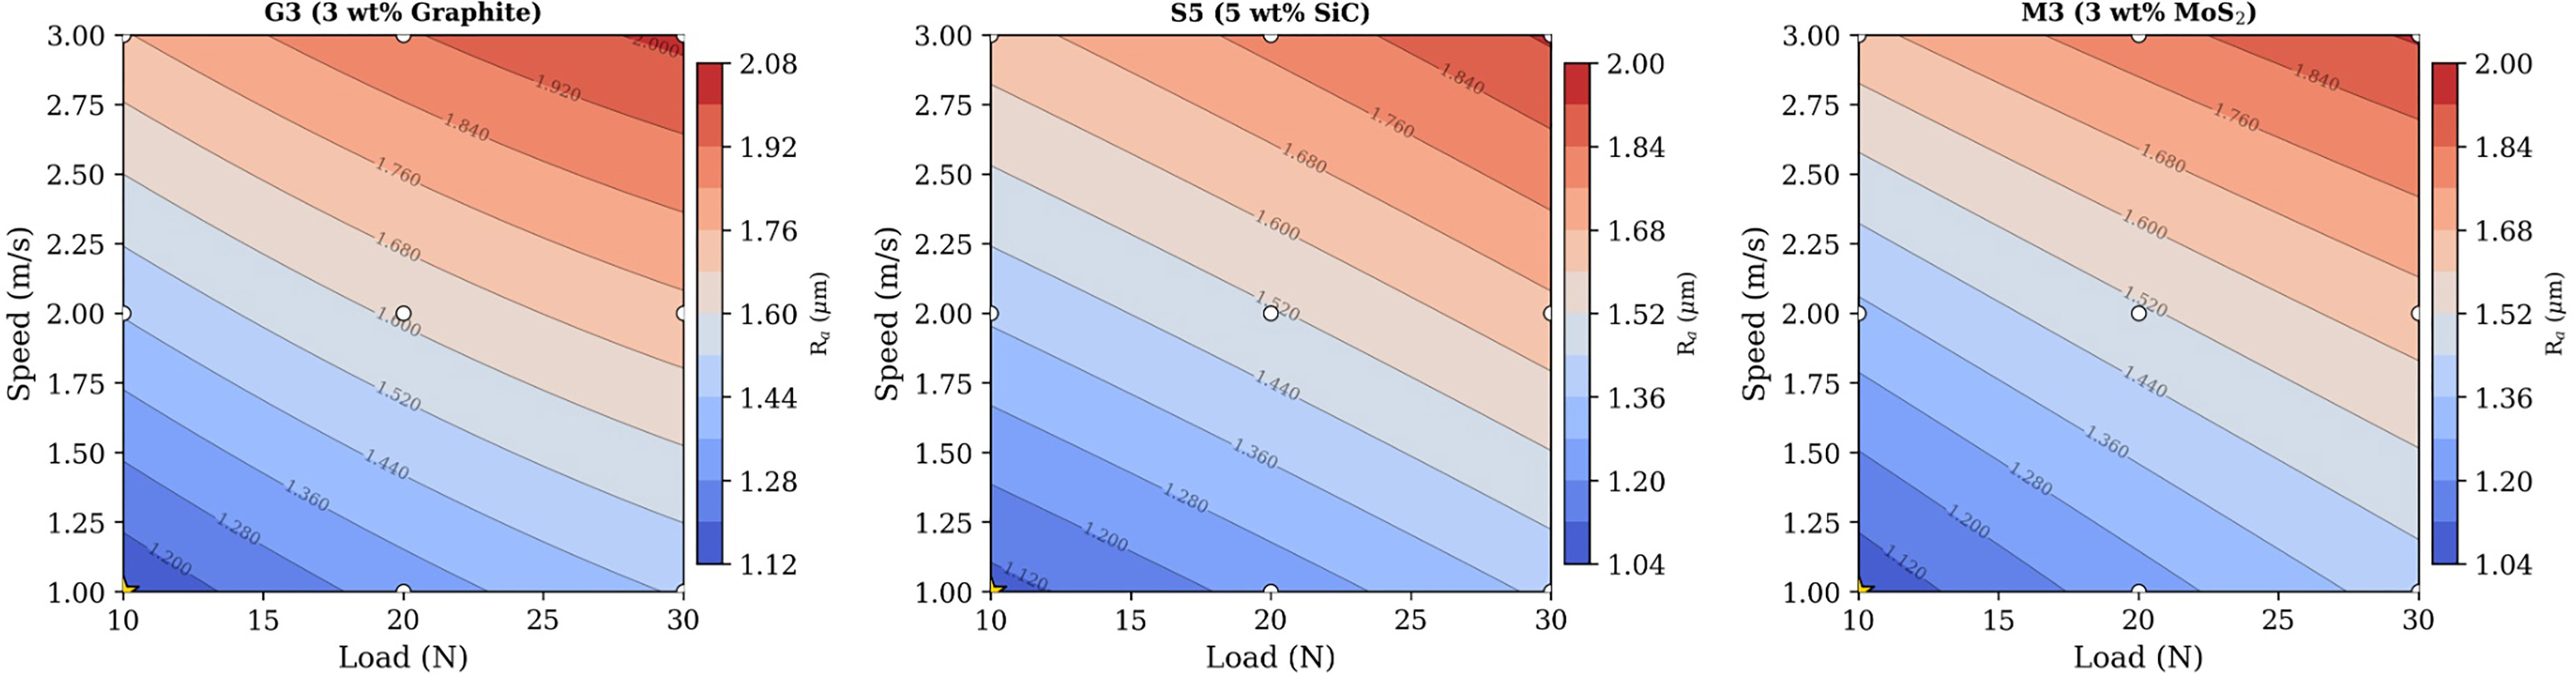
Figure 23 shows the contour distributions of worn-surface roughness across the design space for the three selected composites. The roughness isolines are approximately parallel and diagonally oriented in all panels, reflecting the combined positive influence of load and speed on surface topography degradation. M3 exhibited the lowest overall roughness range (1.06–1.95 µm), with the 1.2 µm isoline encompassing a larger fraction of the design space than in G3 or S5, confirming that the lubricating tribofilm preserves surface integrity over a wider operating envelope. The contour gradient along the speed axis was steeper than along the load axis for all composites, consistent with the larger speed coefficient in the quadratic models. The optimum condition at 10 N / 1 m/s yielded predicted roughness values of 1.133 µm (G3), 1.090 µm (S5), and 1.064 µm (M3). These contour maps provide direct guidance for selecting operating parameters that maintain worn-surface quality within acceptable limits [54].
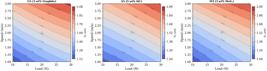
Contour plots of surface roughness (Ra) in the load–speed domain for G3, S5, and M3 composites with optimum conditions indicated.
Figure 24 shows the optimization ramp diagrams for the three representative composites, showing the convergence of applied load and sliding speed toward their respective optima, along with the corresponding predicted tribological responses. All three composites converged to the same optimum factor combination of 10 N and 1 m/s, which confirms the lower boundary of the investigated design space. Under this condition, S5 achieved the lowest predicted specific wear rate (1.318 × 10⁻⁴ mm3/N·m), confirming the superior material-removal resistance conferred by rigid SiC particle reinforcement. M3 achieved the lowest predicted coefficient of friction (0.370) and the lowest predicted surface roughness (1.064 µm), consistent with the formation of a continuous MoS2 lubricating tribofilm. G3 exhibited intermediate response levels across all three outputs, indicating balanced but non-dominant performance. The ramp plots confirm that minimizing tribological severity yields the most favorable multi-response performance for all filler systems examined [55].
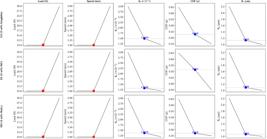
Numerical optimization ramp plots showing factor settings and predicted response values at the optimum condition for G3, S5, and M3 composites.
Figure 25 shows a direct bar-chart comparison of the three optimized tribological responses for the selected composites at 10 N and 1 m/s. S5 recorded the lowest optimized specific wear rate at 1.318 × 10⁻⁴ mm3/N·m, which was 11.6% lower than G3 (1.491 × 10⁻⁴) and 3.6% lower than M3 (1.367 × 10⁻⁴), confirming that the hard-particle reinforcement mechanism of SiC provides the most effective resistance to material removal under dry sliding. M3 achieved a coefficient of friction of 0.370, which was 13.6% lower than G3 (0.428) and 27.9% lower than S5 (0.513), demonstrating the dominant friction-reduction capability of the MoS2 lamellar shearing mechanism. M3 also achieved the lowest surface roughness of 1.064 µm, compared to 1.090 µm for S5 and 1.133 µm for G3 [56]. These quantitative comparisons establish that application-specific filler selection is essential: SiC for maximum wear resistance and MoS2 for minimum friction and optimal surface preservation.
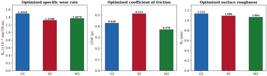
Comparison of optimized specific wear rate, coefficient of friction, and surface roughness for G3, S5, and M3 composites at the optimal condition of 10 N and 1 m/s.
The present work was limited to dry sliding under 10–30 N, short-duration ASTM G99 testing, supplier-reported filler particle sizes, and SEM-based morphology without SEM–EDS/XRD confirmation of filler dispersion. High-load wear testing at 200–400 N, long-duration sliding, thermal ageing, humidity exposure, fatigue loading, and direct filler-mapping analysis should be added in future studies. The current material selection was also based on individual responses, including tensile strength, flexural strength, hardness, impact strength, wear rate, friction coefficient, surface roughness, and wear-derived waste index. Future work should apply multi-criteria decision-making methods to rank composite formulations under competing performance requirements. R-method ranking can be used to prioritize mechanical, thermal, and tribological attributes, as reported in the literature[57,58,59,60,61,62,63,64]. Entropy-VIKOR and VIKOR-MATLAB can be used for weighted optimization and computational rank verification, as reported by Yadav, Saini, Sonwal, Meena, Huh, Brambilla, and Ionescu. Hybrid Entropy-VIKOR, FAHP-TOPSIS, FAHP-FTOPSIS, PSI, and AHP-TOPSIS can also be adapted for glass fiber–epoxy filler selection, as described in the works of Yadav et al., Yadav and Lee, and Yadav.
5. CONCLUSION
The study assessed graphite, SiC, and MoS2 fillers at 2, 3, and 5 wt.% in glass fiber–epoxy laminates fabricated by hand lay-up and compression molding, using mechanical testing, pin-on-disc wear testing, profilometry, SEM, and RSM. The unfilled C1 laminate had tensile strength of 290 MPa, flexural strength of 380 MPa, Shore D hardness of 82, impact strength of 58 kJ m−2, specific wear rate of 2.81 × 10⁻⁴ mm3 N−1 m−1, coefficient of friction of 0.628, and roughness of 1.883 µm. Graphite addition produced its most balanced response at 3 wt.%, with G3 reaching 318 MPa tensile strength, 415 MPa flexural strength, 64 kJ m−2 impact strength, 1.96 × 10⁻⁴ mm3 N−1 m−1 wear rate, and 0.435 friction coefficient. The SiC series showed a progressive wear-strength advantage, with S2 and S3 recording flexural strengths of 405 and 425 MPa, respectively, while S5 had a waste index of 0.605 and a relative service-life factor of 1.65. The MoS2 series produced the strongest sliding-surface response, with M2 and M5 giving friction coefficients of 0.415 and 0.404, and M3 giving the lowest optimized friction value of 0.370 at 10 N and 1 m s−1. RSM models yielded R2 values ranging from 0.836 to 0.994, indicating that load and sliding speed were captured with adequate predictive accuracy. These results establish a practical selection basis: SiC-filled laminates suitable strength-critical wear pads, guide blocks, support liners, and structural sliding contacts, while MoS2-filled laminates suitable low-friction bushings, light-duty bearing surfaces, and polymer tribo-components. Future work will examine high-load sliding, thermal–humidity ageing, fatigue, SEM–EDS/XRD filler mapping, long-duration debris generation, and MCDM-based material ranking.
6. DATA AVAILABILITY
The datasets generated and/or analyzed during the current study are available from the corresponding author upon reasonable request.
7. BIBLIOGRAPHY
-
[1] YADAV, R., MEENA, A., LEE, S.-Y., et al, “Experimental tribological and mechanical behavior of aluminium alloy 6061 composites incorporated ceramic particulates using Taguchi analysis”, Tribology International, v. 192, pp. 109243, 2024. doi: ttps://doi.org/10.1016/j.triboint.2023.109243.
» https://doi.org/10.1016/j.triboint.2023.109243 -
[2] YADAV, R., SINGH, M., SHEKHAWAT, D., et al, “The role of fillers to enhance the mechanical, thermal, and wear characteristics of polymer composite materials: a review”, Composites. Part A, Applied Science and Manufacturing, v. 175, pp. 107775, 2023. doi: https://doi.org/10.1016/j.compositesa.2023.107775.
» https://doi.org/10.1016/j.compositesa.2023.107775 -
[3] YADAV, R., SONWAL, S., SHARMA, Y.K., et al, “A mini review on physical, mechanical, tribology analysis of micro-nano fibers and ceramics reinforced polymer composites for advanced manufacturing processes”, Polymers for Advanced Technologies, v. 36, n. 5, e70205, 2025. doi: https://doi.org/10.1002/pat.70205.
» https://doi.org/10.1002/pat.70205 -
[4] SINGH, M., YADAV, R., DODLA, S., et al, “The influence of nanoparticle surface coatings on fiber-reinforced polymer composites: a review of mechanical, tribological, and thermal properties”, Composite Interfaces, 2026. In press. doi: https://doi.org/10.1080/09276440.2026.2613181.
» https://doi.org/10.1080/09276440.2026.2613181 -
[5] YADAV, R., SONWAL, S., SHARMA, R.P., et al, “Ranking analysis of tribological, mechanical, and thermal properties of nano hydroxyapatite filled dental restorative composite materials using the R-method”, Polymers for Advanced Technologies, v. 35, n. 12, e70010, 2024. doi: https://doi.org/10.1002/pat.70010.
» https://doi.org/10.1002/pat.70010 -
[6] SMOLEŃ, J., OLESIK, P., STĘPIEŃ, K., et al, “The influence of graphite filler on the self-lubricating properties of epoxy composites”, Materials, v. 17, n. 6, pp. 1308, 2024. doi: https://doi.org/10.3390/ma17061308. PubMed PMID: 38541462.
» https://doi.org/10.3390/ma17061308 -
[7] REN, Z., YANG, Y., LIN, Y., et al, “Tribological properties of molybdenum disulfide and helical carbon nanotube modified epoxy resin”, Materials, v. 12, n. 6, pp. 903, 2019. doi: https://doi.org/10.3390/ma12060903. PubMed PMID: 30889884.
» https://doi.org/10.3390/ma12060903 -
[8] ALBAHKALI, T., FOULY, A., ALNASER, I.A., et al, “Investigation of the mechanical and tribological behavior of epoxy-based hybrid composite”, Polymers, v. 15, n. 19, pp. 3880, 2023. doi: https://doi.org/10.3390/polym15193880. PubMed PMID: 37835929.
» https://doi.org/10.3390/polym15193880 -
[9] YADAV, R., LEE, H.-H., MEENA, A., et al, “Effect of alumina particulate and E-glass fiber reinforced epoxy composite on erosion wear behavior using Taguchi orthogonal array”, Tribology International, v. 175, pp. 107860, 2022. doi: https://doi.org/10.1016/j.triboint.2022.107860.
» https://doi.org/10.1016/j.triboint.2022.107860 -
[10] ERDOĞAN, A., GÖK, M.S., KOÇ, V., et al, “Friction and wear behavior of epoxy composite filled with industrial wastes”, Journal of Cleaner Production, v. 237, pp. 117588, 2019. doi: https://doi.org/10.1016/j.jclepro.2019.07.063.
» https://doi.org/10.1016/j.jclepro.2019.07.063 -
[11] ÖRÇEN, G., BAYRAM, D., “Effect of nanoclay on the mechanical and thermal properties of glass fiber-reinforced epoxy composites”, Journal of Materials Science, v. 59, n. 8, pp. 3467–3487, 2024. doi: https://doi.org/10.1007/s10853-024-09387-w.
» https://doi.org/10.1007/s10853-024-09387-w -
[12] SYDOW, Z., SYDOW, M., WOJCIECHOWSKI, Ł., et al, “Tribological performance of composites reinforced with the agricultural, industrial and post-consumer wastes: a review”, Materials, v. 14, n. 8, pp. 1863, 2021. doi: https://doi.org/10.3390/ma14081863. PubMed PMID: 33918606.
» https://doi.org/10.3390/ma14081863 -
[13] ZHONG, W., CHEN, S., MA, L., et al, “Tribological properties of carbon fabric/epoxy composites filled with FGr@MoS_2 hybrids under dry sliding conditions”, Materials, v. 15, n. 22, pp. 7951, 2022. doi: https://doi.org/10.3390/ma15227951. PubMed PMID: 36431437.
» https://doi.org/10.3390/ma15227951 -
[14] ALOTAIBI, J.G., ALAJMI, A.E., MEHOUB, G.A., et al, “Epoxy and polyester composites’ characteristics under tribological loading conditions”, Polymers, v. 13, n. 14, pp. 2230, 2021. doi: https://doi.org/10.3390/polym13142230. PubMed PMID: 34300988.
» https://doi.org/10.3390/polym13142230 -
[15] GÜRBÜZ, H., AKCAN, İ.H., BADAY, Ş., et al, “Investigation of drilling performances, tribological and mechanical behaviors of GFRC filled with B_4C and Gr”, Arabian Journal for Science and Engineering, v. 50, n. 12, pp. 9167–9184, 2025. doi: https://doi.org/10.1007/s13369-024-09392-w.
» https://doi.org/10.1007/s13369-024-09392-w -
[16] SHARMA, N., KUMAR, S., SINGH, K.K., “Taguchi’s DOE and artificial neural network analysis for the prediction of tribological performance of graphene nano-platelets filled glass fiber reinforced epoxy composites under the dry sliding condition”, Tribology International, v. 172, pp. 107580, 2022. doi: https://doi.org/10.1016/j.triboint.2022.107580.
» https://doi.org/10.1016/j.triboint.2022.107580 -
[17] SINGH, N., SINHA, S.K., “Tribological performances of hybrid composites of epoxy, UHMWPE and MoS_2 with in situ liquid lubrication against steel and itself”, Wear, v. 486–487, pp. 204072, 2021. doi: https://doi.org/10.1016/j.wear.2021.204072.
» https://doi.org/10.1016/j.wear.2021.204072 -
[18] LI, Z., QI, X., LIU, C., et al, “Particle size effect of PTFE on friction and wear properties of glass fiber reinforced epoxy resin composites”, Wear, v. 532–533, pp. 205104, 2023. doi: https://doi.org/10.1016/j.wear.2023.205104.
» https://doi.org/10.1016/j.wear.2023.205104 -
[19] SMOLEŃ, J., STĘPIEŃ, K., MIKUŚKIEWICZ, M., et al, “Tribological properties of composites based on single-component powdered epoxy matrix filled with graphite”, Materials, v. 17, n. 13, pp. 3054, 2024. doi: https://doi.org/10.3390/ma17133054. PubMed PMID: 38998138.
» https://doi.org/10.3390/ma17133054 -
[20] CHEN, B., ZHANG, M., LI, X., et al, “Tribological properties of epoxy-based self-lubricating composite coating enhanced by 2D/2D h-BN/MoS_2 hybrid”, Progress in Organic Coatings, v. 147, pp. 105767, 2020. doi: https://doi.org/10.1016/j.porgcoat.2020.105767.
» https://doi.org/10.1016/j.porgcoat.2020.105767 -
[21] PINATE, S., ZANELLA, C., “Wear behavior of Ni-based composite coatings with dual nano-SiC: Graphite powder mix”, Coatings, v. 10, n. 11, pp. 1060, 2020. doi: https://doi.org/10.3390/coatings10111060.
» https://doi.org/10.3390/coatings10111060 -
[22] LIU, C., LI, M., SHEN, Q., et al, “Preparation and tribological properties of modified MoS_2/SiC/epoxy composites”, Materials, v. 14, n. 7, pp. 1731, 2021. doi: https://doi.org/10.3390/ma14071731. PubMed PMID: 33916099.
» https://doi.org/10.3390/ma14071731 -
[23] AMERICAN SOCIETY FOR TESTING AND MATERIALS, ASTM ASTM D3039/D3039M-17 Standard Test Method for Tensile Properties of Polymer Matrix Composite Materials, West Conshohocken, ASTM, 2017. doi: https://doi.org/10.1520/D3039_D3039M-17.
» https://doi.org/10.1520/D3039_D3039M-17 -
[24] AMERICAN SOCIETY FOR TESTING AND MATERIALS, ASTM D790-17 Standard Test Methods for Flexural Properties of Unreinforced and Reinforced Plastics and Electrical Insulating Materials, West Conshohocken, ASTM, 2017. doi: https://doi.org/10.1520/D0790-17.
» https://doi.org/10.1520/D0790-17 -
[25] AMERICAN SOCIETY FOR TESTING AND MATERIALS, ASTM D2240-15(2021) Standard Test Method for Rubber Property—Durometer Hardness, West Conshohocken, ASTM, 2021. doi: https://doi.org/10.1520/D2240-15R21.
» https://doi.org/10.1520/D2240-15R21 -
[26] AMERICAN SOCIETY FOR TESTING AND MATERIALS, ASTM D256-23 Standard Test Methods for Determining the Izod Pendulum Impact Resistance of Plastics, West Conshohocken, ASTM, 2023. doi: https://doi.org/10.1520/D0256-23.
» https://doi.org/10.1520/D0256-23 -
[27] AMERICAN SOCIETY FOR TESTING AND MATERIALS, ASTM G99-17 Standard Test Method for Wear Testing with a Pin-on-Disk Apparatus, West Conshohocken, ASTM, 2017. doi: https://doi.org/10.1520/G0099-17.
» https://doi.org/10.1520/G0099-17 -
[28] YADAV, R., SAINI, S., SONWAL, S., et al, “Optimization and ranking of dental restorative composites by ENTROPY-VIKOR and VIKOR-MATLAB”, Polymers for Advanced Technologies, v. 35, n. 7, e6526, 2024. doi: https://doi.org/10.1002/pat.6526.
» https://doi.org/10.1002/pat.6526 -
[29] YADAV, R., SINGH, M., MEENA, A., et al, “Selection and ranking of dental restorative composite materials using hybrid Entropy-VIKOR method: An application of MCDM technique”, Journal of the Mechanical Behavior of Biomedical Materials, v. 147, pp. 106103, 2023. doi: https://doi.org/10.1016/j.jmbbm.2023.106103. PubMed PMID: 37690292.
» https://doi.org/10.1016/j.jmbbm.2023.106103 -
[30] YADAV, R., LEE, H.-H., “Fabrication, characterization, and selection using FAHP-TOPSIS technique of zirconia, titanium oxide, and marble dust powder filled dental restorative composite materials”, Polymers for Advanced Technologies, v. 33, n. 10, pp. 3286–3295, 2022. doi: https://doi.org/10.1002/pat.5780.
» https://doi.org/10.1002/pat.5780 -
[31] ASSUNÇÃO, G.S.C., VELASQUES, J.A., ZAKRZEVSKI, A., et al, “Mechanical properties of glass-fiber reinforced polyester composites manufactured by two different spray-up techniques”, Matéria, v. 29, n. 3, e20240450, 2024. doi: https://doi.org/10.1590/1517-7076-rmat-2024-0450.
» https://doi.org/10.1590/1517-7076-rmat-2024-0450 -
[32] SAMINATHARAJA, D., CHINNATHAMBI, D., RAJENDRAN, S., et al, “Comparative analysis of the effect of alkali-treated Prosopis Juliflora, palm, and glass fibre as reinforcement for epoxy polymer composites”, Matéria, v. 30, e20250769, 2025. doi: https://doi.org/10.1590/1517-7076-rmat-2025-0769.
» https://doi.org/10.1590/1517-7076-rmat-2025-0769 -
[33] ARUN MOHAN, A.M., KALIAPPAN, S., NATRAYAN, L., et al, “TiO2 nanoparticle-enhanced kevlar fiber epoxy composites: development, characterization, and performance analysis”, Matéria, v. 31, e20250796, 2026. doi: https://doi.org/10.1590/1517-7076-rmat-2025-0796.
» https://doi.org/10.1590/1517-7076-rmat-2025-0796 -
[34] MAHALINGAM, V., VEERAMANI, A., SHANMUGAM, S., et al, “Optimization of tribological parameters of hybrid polymer composites reinforced with kenaf fibers and recycled spent abrasive particles”, Matéria, v. 30, e20240941, 2025. doi: https://doi.org/10.1590/1517-7076-rmat-2024-0941.
» https://doi.org/10.1590/1517-7076-rmat-2024-0941 -
[35] YADAV, R., LEE, H.-H., “Ranking and selection of dental restorative composite materials using FAHP-FTOPSIS technique: an application of multi criteria decision making technique”, Journal of the Mechanical Behavior of Biomedical Materials, v. 132, pp. 105298, 2022. doi: https://doi.org/10.1016/j.jmbbm.2022.105298. PubMed PMID: 35660553.
» https://doi.org/10.1016/j.jmbbm.2022.105298 -
[36] PERIYATHAMBI, V., RAJAMANICKAM, S., GOVINDASAMY, M., et al, “Optimizing alumina reinforcement in kevlar-epoxy composites: a study on mechanical and tribological enhancements”, Matéria, v. 30, e20250185, 2025. doi: https://doi.org/10.1590/1517-7076-rmat-2025-0185.
» https://doi.org/10.1590/1517-7076-rmat-2025-0185 -
[37] ARUMUGAM, M., DEVARAJAN, K., PERIYATHAMBI, V., et al “Mechanical characterization of bamboo-reinforced polymer composites: a comparative study of epoxy and polyurethane matrices”, Matéria, v. 29, e20240653, 2025. doi: https://doi.org/10.1590/1517-7076-RMAT-2024-0653.
» https://doi.org/10.1590/1517-7076-RMAT-2024-0653 -
[38] ZHENG, W., WANG, W., WANG, Y., “Mechanical properties of carbon fiber reinforced epoxy resin treated by electrochemical process”, Matéria, v. 30, e20250025, 2025. doi: https://doi.org/10.1590/1517-7076-RMAT-2025-0025.
» https://doi.org/10.1590/1517-7076-RMAT-2025-0025 -
[39] RAMAKRISHNAN, M., RAMASUBRAMANIAN, S., SUBBARAYALU, V., et al, “Analysis of mechanical properties of pineapple leaf/glass fiber-vinyl ester hybrid composite”, Matéria, v. 30, e13167, 2022. doi: https://doi.org/10.1590/S1517-707620220002.1367.
» https://doi.org/10.1590/S1517-707620220002.1367 -
[40] YADAV, R., “Fabrication, characterization, and optimization selection of ceramic particulate reinforced dental restorative composite materials”, Polymers & Polymer Composites, v. 30, pp. 09673911211062755, 2022. doi: https://doi.org/10.1177/09673911211062755.
» https://doi.org/10.1177/09673911211062755 -
[41] FIDAN, S., ÖZSOY, M.İ., ÜRGÜN, S., et al, “Scratch resistance of glass-basalt fiber reinforced epoxy hybrid composites: a comparative study”, Polymer Composites, v. 45, n. 13, pp. 11940–11959, 2024. doi: https://doi.org/10.1002/pc.28610.
» https://doi.org/10.1002/pc.28610 -
[42] BHOWMIK, A., BHATTACHARJEE, B., VENKATESH, V.S.S., et al, “Investigation on microstructure, mechanical properties, and fracture morphology of Al7075/TiB2 composites”, Journal of the Minerals Metals & Materials Society, v. 76, n. 7, pp. 3783–3797, 2024. doi: https://doi.org/10.1007/s11837-024-06608-0.
» https://doi.org/10.1007/s11837-024-06608-0 -
[43] MALKAPURAM, D., BALLARI, S.O., CHINTA, S., et al, “Mechanical, water absorption, efflorescence, soundness anmorphological analysis of hybrid brick composites”, Matéria, v. 29, e20240179, 2024. doi: https://doi.org/10.1590/1517-7076-RMAT-2024-0179.
» https://doi.org/10.1590/1517-7076-RMAT-2024-0179 -
[44] FLORA, B., KUMAR, R., TIWARI, P., et al, “Development of chemically synthesized hydroxyapatite composite with reduced graphene oxide for enhanced mechanical properties”, Journal of the Mechanical Behavior of Biomedical Materials, v. 142, pp. 105845, 2023. doi: https://doi.org/10.1016/j.jmbbm.2023.105845. PubMed PMID: 37060714.
» https://doi.org/10.1016/j.jmbbm.2023.105845 -
[45] SILVA BRAGA, T.T., ANDRADE, N.P., TERNI, A.W., et al, “Flexural performance of concrete beams reinforced with epoxy resin/glass and carbon fibers composites”, Materials Research, v. 24, n. 6, e20210109, 2021. doi: https://doi.org/10.1590/1980-5373-mr-2021-0109.
» https://doi.org/10.1590/1980-5373-mr-2021-0109 -
[46] JEYAGURU, S., THIAGAMANI, S.M.K., SIENGCHIN, S., et al, “Effect of various weaving architectures on mechanical, vibration and acoustic behavior of Kevlar-Hemp intra-ply hybrid composites”, Composites. Part A, Applied Science and Manufacturing, v. 176, pp. 107845, 2024. doi: https://doi.org/10.1016/j.compositesa.2023.107845.
» https://doi.org/10.1016/j.compositesa.2023.107845 -
[47] SUNDER, S., JAUREGUI ROZO, M., INASU, S., et al, “A systematic investigation of the transfer of polyphosphate/inorganic silicate flame retardants from epoxy resins to layered glass fiber-reinforced composites and their post-furnace flexural properties”, Polymer Composites, v. 45, n. 10, pp. 9389–9406, 2024. doi: https://doi.org/10.1002/pc.28416.
» https://doi.org/10.1002/pc.28416 -
[48] SÁNCHEZ-ROMATE, X.F., ALVARADO, A., JIMÉNEZ-SUÁREZ, A., et al, “Carbon nanotube reinforced poly (ε-caprolactone)/epoxy blends for superior mechanical and self-sensing performance in multiscale glass fiber composites”, Polymers, v. 13, n. 18, pp. 3159, 2021. doi: https://doi.org/10.3390/polym13183159. PubMed PMID: 34578059.
» https://doi.org/10.3390/polym13183159 -
[49] BITENCOURT, A.H.S., RIBEIRO, M.M., SILVA, D.S., et al, “Structural analysis and mechanical performance of industrial conveyor flight bars manufactured with epoxy matrix composites reinforced by glass, carbon, and Kevlar fibers”, Polymers, v. 18, n. 4, pp. 433, 2026. doi: https://doi.org/10.3390/polym18040433. PubMed PMID: 41754623.
» https://doi.org/10.3390/polym18040433 -
[50] MANUNEETHI ARASU, P., KARTHIKAYAN, A., VENKATACHALAM, R., “Mechanical and thermal behavior of hybrid glass/jute fiber reinforced composites with epoxy/polyester resin”, Polimery, v. 64, n. 7–8, pp. 504–508, 2019. doi: https://doi.org/10.14314/polimery.2019.7.6.
» https://doi.org/10.14314/polimery.2019.7.6 -
[51] SUBRAMANI, R., RUSHO, M.A., JIA, X., “Machine learning-driven sustainable optimization of rapid prototyping via FDM: enhancing mechanical strength, energy efficiency, and SDG contributions of thermoplastic composites”, Applied Chemical Engineering, v. 8, n. 2, pp. 5621, 2025. doi: https://doi.org/10.59429/ace.v8i2.5621.
» https://doi.org/10.59429/ace.v8i2.5621 -
[52] KALATHARAN, S.N., IMRAN, A.I., IRAWAN, A.P., et al, “Mechanical performance of alkali-treated rattan strips with epoxy coating for sustainable composite applications”, Advance Sustainable Science, Engineering and Technology, v. 7, n. 3, pp. 02503018, 2025. doi: https://doi.org/10.26877/asset.v7i3.2017.
» https://doi.org/10.26877/asset.v7i3.2017 -
[53] UTHEMANN, C., GRIES, T., “Comparative study on the mechanical behavior of flax and glass fiber multiaxial fabric-reinforced epoxy composites”, Materials, v. 18, n. 19, pp. 4469, 2025. doi: https://doi.org/10.3390/ma18194469. PubMed PMID: 41095293.
» https://doi.org/10.3390/ma18194469 -
[54] ISLAM, M.N., ANWAR, M.S., ISLAM, M.S., et al, “Bending analysis of glass fiber reinforced epoxy composites/copper-clad laminates for multi-layer printed circuit boards”, Hybrid Advances, v. 4, pp. 100090, 2023. doi: https://doi.org/10.1016/j.hybadv.2023.100090.
» https://doi.org/10.1016/j.hybadv.2023.100090 -
[55] WANG, X., YANG, J., LIANG, K., et al, “Optimizing dredging waste sediment in cementitious composites using layered double oxides: effects on mechanical behaviour, durability, and microstructure”, Construction & Building Materials, v. 458, pp. 139714, 2025. doi: https://doi.org/10.1016/j.conbuildmat.2024.139714.
» https://doi.org/10.1016/j.conbuildmat.2024.139714 -
[56] MERAVI, M.K., PANCHORE, V., “Fiber alignment’s effect on the properties of hybrid glass/flax fiber-reinforced epoxy composite laminates”, Polymers for Advanced Technologies, v. 35, n. 10, e6618, 2024. doi: https://doi.org/10.1002/pat.6618.
» https://doi.org/10.1002/pat.6618 -
[57] YADAV, R., “Analytic hierarchy process-technique for order preference by similarity to ideal solution: A multi criteria decision-making technique to select the best dental restorative composite materials”, Polymer Composites, v. 42, n. 12, pp. 6867–6877, 2021. doi: https://doi.org/10.1002/pc.26346.
» https://doi.org/10.1002/pc.26346 -
[58] JAYASINGHE, R., RAMOS, M., NAND, A., et al, “Enhancing mechanical and tribological properties of epoxy composites with ultrasonication exfoliated MoS2: Impact of low filler loading on wear performance and tribofilm formation”, Nanomaterials, v. 14, n. 21, pp. 1744, 2024. doi: https://doi.org/10.3390/nano14211744. PubMed PMID: 39513824.
» https://doi.org/10.3390/nano14211744 -
[59] PUROHIT, A., SATAPATHY, A., “Epoxy matrix composites filled with micro-sized LD sludge: Wear characterization and analysis”, IOP Conference Series. Materials Science and Engineering, v. 115, pp. 12006, 2016. doi: https://doi.org/10.1088/1757-899X/115/1/012006.
» https://doi.org/10.1088/1757-899X/115/1/012006 -
[60] PATNAIK, P.K., SWAIN, P.T.R., PUROHIT, A., et al, “Tribological study on slurry abrasive wear behavior of nonwoven viscose fabric composites with DOE approach”, Surface Review and Letters, v. 27, n. 8, pp. 1950185, 2020. doi: https://doi.org/10.1142/S0218625X19501853.
» https://doi.org/10.1142/S0218625X19501853 -
[61] PUROHIT, A., AGRAWAL, A., PRADHAN, P., et al, “Machine learning guided optimization of engineered wood dust reinforced hybrid polymer composites”, Wood Material Science & Engineering, 2026. In press. doi: https://doi.org/10.1080/17480272.2025.2612312.
» https://doi.org/10.1080/17480272.2025.2612312 -
[62] PUROHIT, A., PRADHAN, P., PALANIMUTHU, S., et al, “Experimental and computational analysis of epoxy-cotton seed particle composites: a multi-property study for automotive use”, Journal of Materials Engineering and Performance, 2026. In press. doi: https://doi.org/10.1007/s11665-026-13474-1.
» https://doi.org/10.1007/s11665-026-13474-1 -
[63] PUROHIT, A., SATAPATHY, A., “Erosion wear response of epoxy composites filled with steel industry slag and sludge particles: a comparative study”, IOP Conference Series. Materials Science and Engineering, v. 338, pp. 12059, 2018. doi: https://doi.org/10.1088/1757-899X/338/1/012059.
» https://doi.org/10.1088/1757-899X/338/1/012059 -
[64] PUROHIT, A., SATAPATHY, A., “Mechanical and wear characteristics of epoxy composites filled with industrial wastes: a comparative study”, IOP Conference Series. Materials Science and Engineering, v. 178, pp. 12019, 2017. doi: https://doi.org/10.1088/1757-899X/178/1/012019.
» https://doi.org/10.1088/1757-899X/178/1/012019