 Effect of rolling and tempering process on microstructure and mechanical properties along the thickness direction of HSLA steel plate
ABSTRACT
This study investigates the effects of thermo-mechanical controlled processing (TMCP) and tempering (T) on the microstructure and mechanical properties along the thickness direction of HSLA steel plates. The evolution of microstructure, dislocation density, and mechanical properties was analyzed at the surface, 1/4t, and 1/2t positions using optical microscopy (OM), scanning electron microscopy (SEM), electron backscatter diffraction (EBSD), X-ray diffraction (XRD) techniques and mechanical testing. The results show that the microstructure primarily consists of lath martensite and bainite, with the martensite fraction and dislocation density gradually decreasing from the surface to the center due to the cooling rate gradient. Tempering at 300~600 °C promotes recovery of dislocations and carbide precipitation. With increasing tempering temperature, the tensile strength gradually decreases, while the yield strength first increases and then decreases. In contrast, ductility and impact toughness exhibit an opposite trend. The optimal balance of strength and toughness is achieved after tempering at 450 °C, which is attributed to the formation of fine and spheroidized carbides, a moderate dislocation density, and a refined effective grain size. This study not only clarifies the evolution mechanism of microstructure and mechanical properties at different thickness under different tempering conditions, but also provides useful guidance for the industrial production of HSLA steel plates.
Keywords:
TMCP; HSLA steel plate; Microstructure; Mechanical properties
1. INTRODUCTION
High-strength low-alloy (HSLA) steels have found widespread applications in shipbuilding, bridge construction, offshore engineering, and pipeline manufacturing due to their well-balanced combination of high strength, excellent toughness, good weldability, and relatively low cost [1,2,3]. In these demanding applications, structural materials must exhibit high strength to minimize weight, while also maintaining good low-temperature toughness and weldability to ensure structural integrity, safety, and reliability. To maintain good processability and manufacturability, HSLA steels are typically designed with a low-carbon microalloyed composition. The addition of trace elements such as niobium (Nb), vanadium (V), and titanium (Ti) promotes grain refinement through the precipitation of carbonitrides, thereby enhancing the strength and toughness of the steel [4, 5]. At present, Thermal Mechanical Controlled Processing (TMCP) technology has become one of the core methods for manufacturing HSLA steel plates [6, 7]. By precisely controlling the rolling temperature and deformation, followed by accelerated cooling after rolling, the TMCP process can significantly refine austenite grains and promote the formation of multiphase microstructures, thereby greatly enhancing the strength of the steel without compromising its toughness.
In actual production, cooling rates are typically increased to obtain low-temperature phase transformation structures such as bainite or martensite, thereby achieving a favorable combination of strength and toughness. However, actual production process may result in an uneven distribution of residual stress, which leads to cutting and other machining problems [8, 9]. Therefore, subsequent heat treatment (tempering) is required, to optimise the microstructure after the TMCP process, thereby obtaining a good combination of properties. The past research focused on investigating the relationship between tempering temperature and mechanical properties during the TMCP in HSLA steel plates [10,11,12]. VILLALOBOS et al. [13] investigated the effect of tempering temperature on the mechanical properties of X120 steel plates. As the tempering temperature increased from 200 °C to 600 °C, the yield strength (YS) first increased from 790 MPa to 827 MPa and then decreased to 779 MPa. CHEN et al. [14] conducted similar research on constructional steel. They found that as the tempering temperature increased from 300 °C to 600 °C, the YS gradually increased from 545 MPa to 607 MPa, while the impact toughness at −20 °C decreased from 172 J to 110 J and then recovered to 146 J. Again, tempering at 500–600 °C yielded the optimal mechanical properties. WANG et al. [15] investigated the effect of tempering temperature on the mechanical properties of HSLA plates. They found with the increase of tempering temperature, the tensile strengths decrease monotonously, while the yield strengths increase firstly and then decrease based on the amount of mobile dislocations. However, the relationship between microstructure and mechanical properties in the thickness direction during TMCP + T process has been less studied.
Based on this, this study for the first time systematically elucidates the effects of the TMCP and tempering process on the microstructural evolution, dislocation density, and mechanical properties of HSLA steel plates at different thickness positions. Advanced characterization techniques were employed to investigate the microstructural evolution of the material along the thickness direction. The dislocation density at different thickness positions was quantified using X-ray diffraction, and corresponding mechanical properties were systematically evaluated by mechanical property tests. By analyzing parameters such as average KAM, HAGBs density, and the evolution of precipitated phases, the microstructural differences across the thickness positions and their underlying roles in governing strength and toughness were elucidated. The results provide a scientific basis for optimizing tempering strategies in thick HSLA steel plates and improving the uniformity of mechanical properties along the thickness direction.
2. MATERIALS AND METHODS
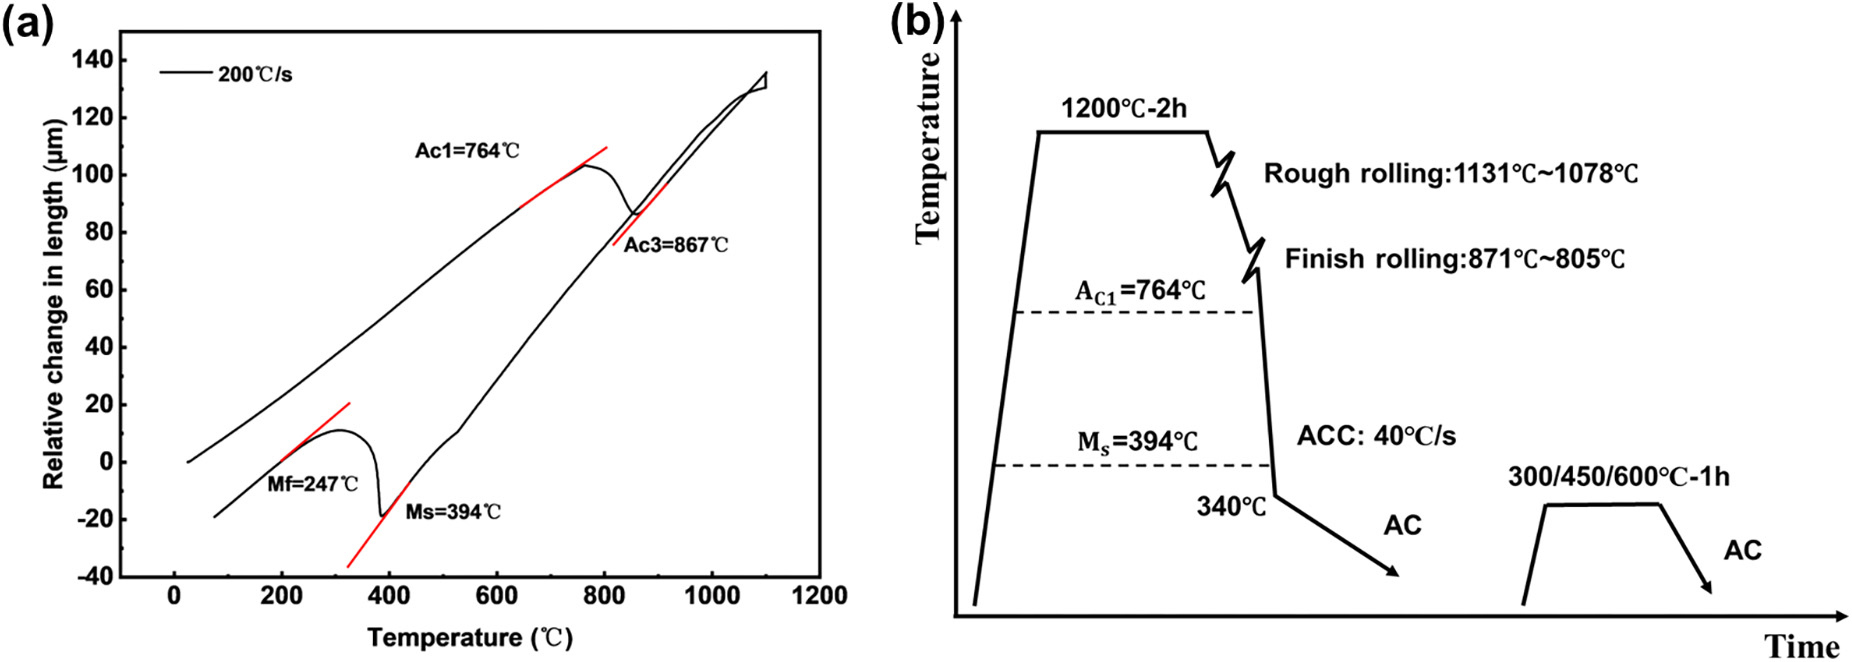
The chemical composition of the experimental steel is Fe-0.07C-1.57Mn-0.28Si-0.27Mo-1.82 (Cr + Ni + Cu)–0.06 (Nb + V + Ti)–0.002B (wt.%), it was fabricated and cast in a vacuum induction furnace. The phase transformation temperatures Ac1, Ac3 and Ms of the experimental steel were 764 °C, 867 °C and 394 °C, which were measured by dilatometry (L78RITA, LINSES, Germany), as shown in Figure 1a. The plates were rolled to 30 mm on a 4300 mm double-frame rolling mill under TMCP process, and the schematic representation of TMCP and tempering process are presented in Figure 1b. Firstly, the ingot was reheated to 1200 °C for 2 hours to dissolve second-phase particles. Then, the ingot was rolled to 30 mm with rough rolling (1078 °C~1131 °C) and finish rolling (805 °C~871 °C) process, and each pass achieving a reduction rate exceeding 20%. After rolling, accelerated cooling (ACC) was applied at a controlled rate of 40 °C/s until the temperature reached 400 °C and then air cooling to room temperature. Following the TMCP, the experimental plates was tempering at 300 °C, 450 °C and 600 °C for 1 hour.
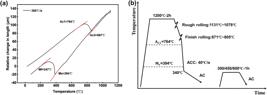
(a) Critical phase transformation temperatures of experimental steel and (b) schematic representation of TMCP and tempering process.
Samples with dimensions of 5 mm × 3 mm × 5 mm were cut by wire c electrical discharge machining along the rolling direction-normal direction-transverse direction (RD-ND-TD) at the different thickness positions of the experimental plates. Optical microscopy (OM, Axioscope 5, ZEISS, Germany) and scanning electron microscopy (SEM, Mira LMS, TESCAN, China, operated at 20 keV with a working distance of 15 mm) were employed to observe the microstructure on the RD-ND plane at various thickness positions. Prior to observation, the specimens were mechanically polished and etched in 4% Nital ethanol solution for 5–10 s.
The dislocation density and phase composition were determined using an X-ray diffractometer (XRD, Bruker D8 Advance, BRUKER, Germany) equipped with a Cu-Kα radiation source and operated at 40 kV. The scanning was conducted over a 2θ range of 40°–120° with a step size of 0.02° and a scanning speed of 1°/min. Specimens for XRD were firstly mechanically ground and polished, followed by electropolishing in 6% perchlorate alcohol solution at 20 V for 15 s. The diffraction profiles used for this analysis were the (110), (200), (211), (220) and (310) reflections of the α phase.
Electron backscatter diffraction (EBSD) analysis was performed at a step size of 0.3 μm using the same SEM equipped with an HKL Nirdlys F + detector (OXFORD Instruments, Oxford, UK). EBSD specimens were electropolished in a solution containing 6 vol.% perchloric acid and ethanol at 20 V for 20 s after mechanical grinding and polishing. The EBSD data were processed using Aztec software to analyze the average Kernel Average Misorientation (KAM) and effective grain size (EGS). The density of high-angle grain boundaries (HAGBs) was calculated using the MTEX toolbox in MATLAB [16].
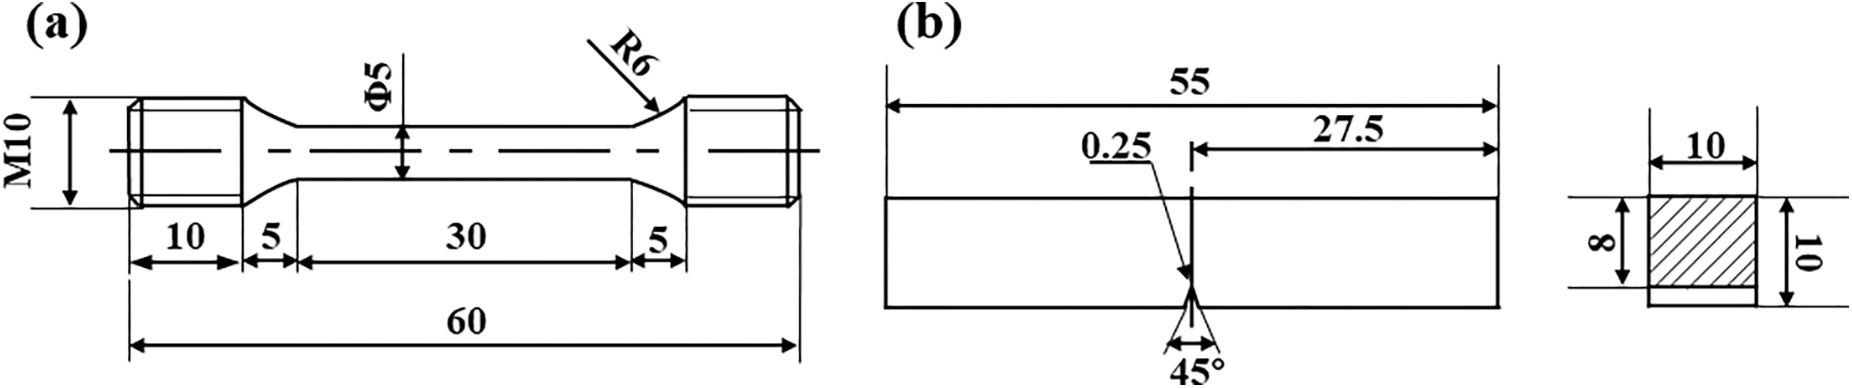
Round tensile specimens were machined in the longitudinal direction from the 1/4t and 1/2t positions of the experimental plates (where t denotes the plate thickness). The specimens had a gauge diameter of 5 mm and a gauge length of 30 mm, in accordance with the GB/T 228.1–2021 standard, as shown in Figure 2a. Room temperature tensile tests were conducted using a universal testing machine (Instron 8801, INSTRON, UK) at a strain rate of 10–3 s–1. Three tensile tests were performed for each condition, and the average values were reported to ensure reliability.
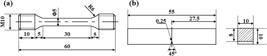
Charpy V-notch (CVN) impact specimens with dimensions of 10 mm × 10 mm × 55 mm were prepared from the 1/4t and 1/2t positions in accordance with GB/T 229–2020, with the V-notch oriented parallel to the TD of the plates, as illustrated in Figure 2b. The impact tests were carried out at –40 °C using an instrumented pendulum impact tester (JBDW-300D, China) with a capacity of 450 J. To ensure the accuracy of the results, three specimens were conducted from each position to obtain the average impact energy values.
Vickers microhardness measurements were performed on a Vickers hardness tester (SHIMADZU HMV-31ST, Japan) under a lead of 0.2 kg and a dwell time of 10 s. The Vickers hardness values were obtained from five distinct positions on each sample and averaged to minimize experimental error.
3. RESULTS
3.1. Microstructure
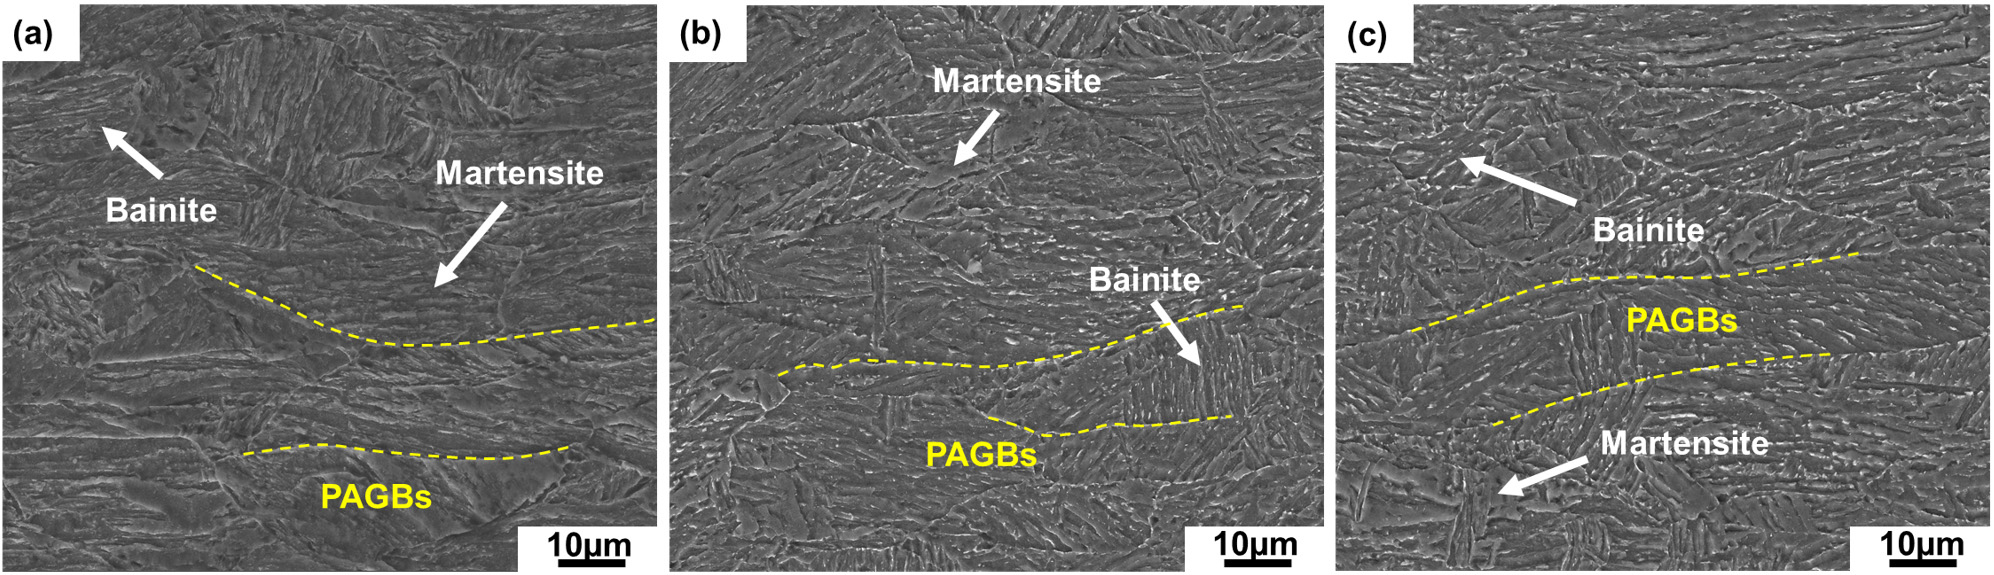
Figure 3 presents SEM micrographs of the experimental steel processed by TMCP at different thickness positions (surface, 1/4t and 1/2t). The prior austenite grain boundaries (PAGBs, marked by yellow dotted lines) are clearly visible, and the microstructure throughout the thickness is mainly composed flattened martensite and bainite.
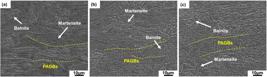
SEM micrographs of the experimental steel under TMCP at surface (a), 1/4t (b) and 1/2t (c).
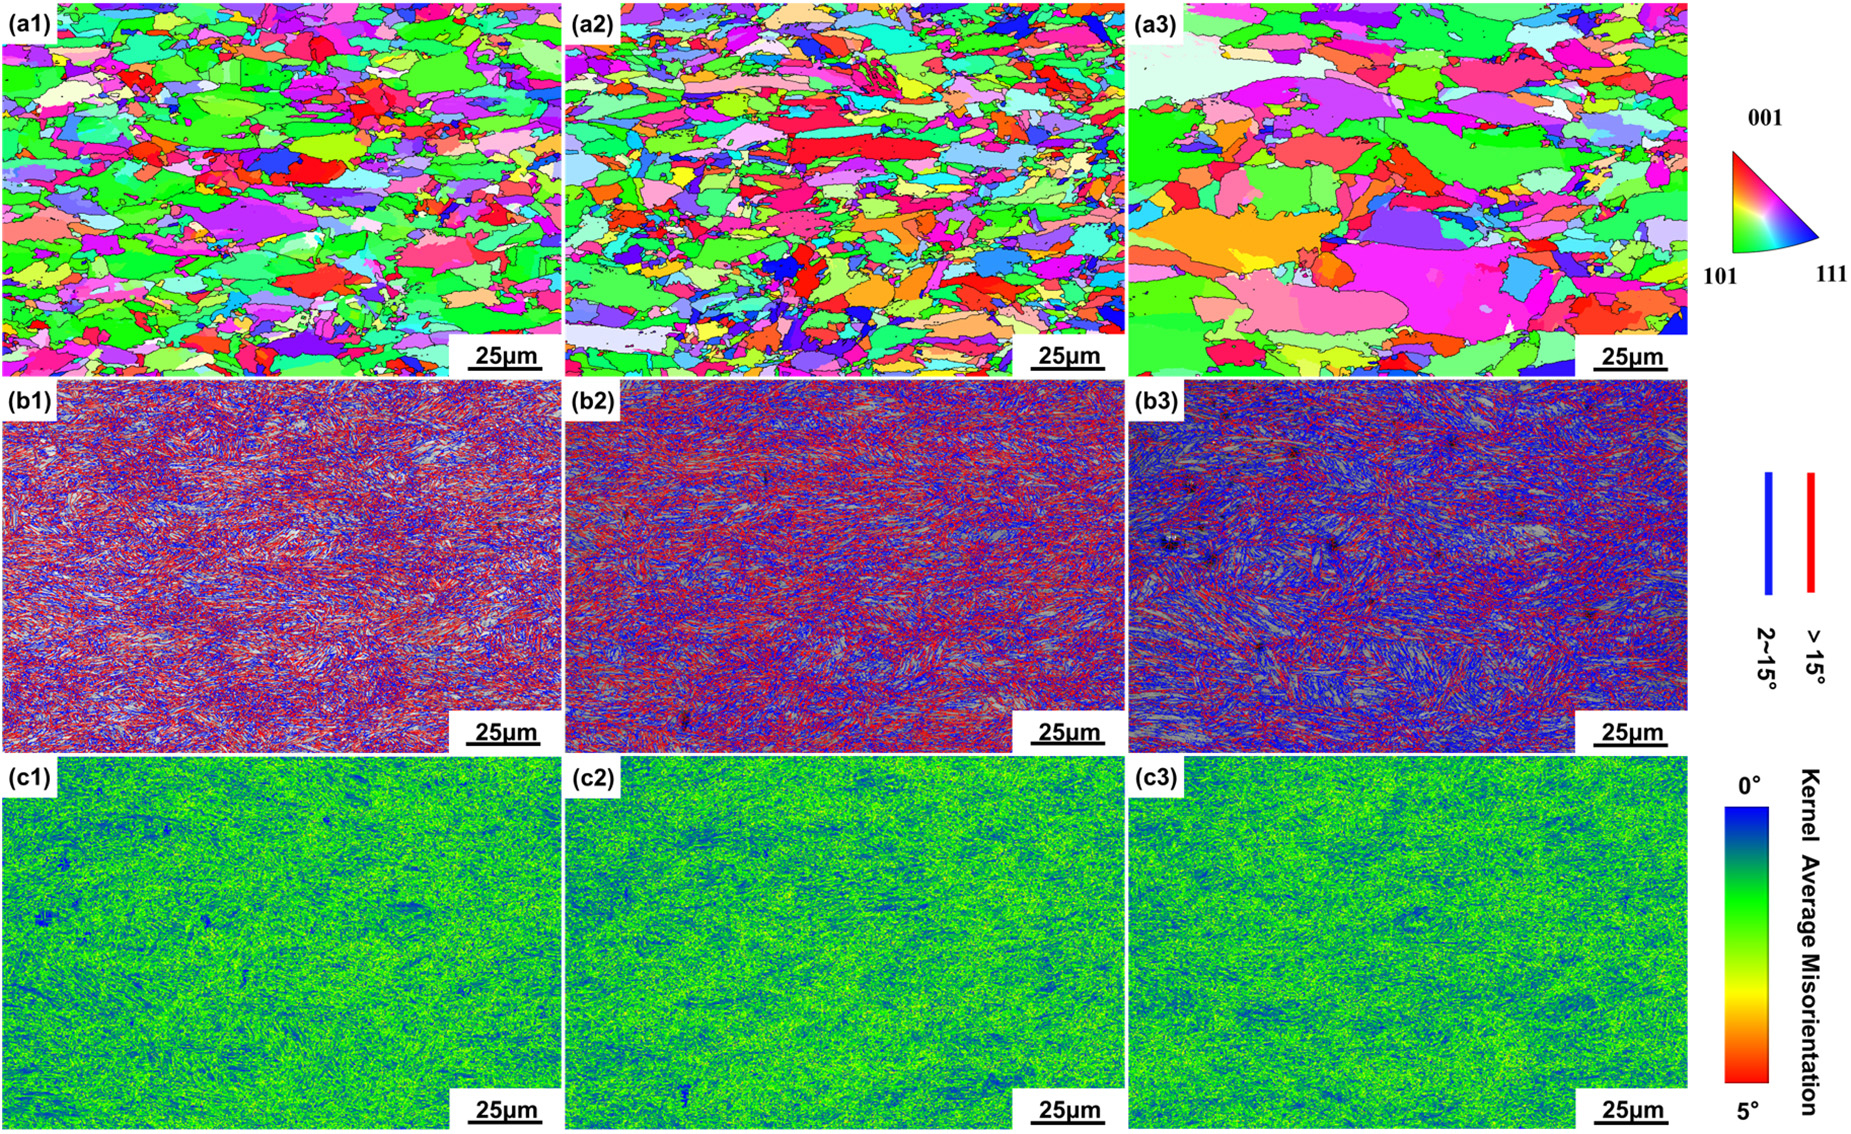
Figure 4 illustrates the reconstruction of prior austenite grain boundaries (PAGBs) using an open-source reconstruction algorithm implemented in the MTEX toolbox, band contrast (BC) maps with grain boundary misorientation distributions and kernel average misorientation (KAM) maps obtained at different thickness positions (surface, 1/4t, and 1/2t) under TMCP. The EGS at the surface, 1/4t, and 1/2t is 2.74 μm, 2.61 μm, and 3.18 μm, respectively, which is consistent with the variation in PAGB size along the thickness direction, as shown in Figure 4a1–a3. In this work, grain boundaries with misorientation angles greater than 15° were used to determine the effective grain size, following Ref. [17]. In the grain boundary misorientation maps, red lines denote high-angle grain boundaries (HAGBs) with misorientation angels greater than 15°, whereas blue lines represent low-angle grain boundaries (LAGBs) with misorientation angels between 2° and 15°. In general, martensite exhibits a three-level hierarchical structure consisting of packets, blocks, and laths within prior austenite grains [18, 19]. Lath boundaries typically exhibit misorientation angles below 15°, whereas packet and block boundaries often exceed 15°. Furthermore, the martensite fractions at the surface, 1/4t, and 1/2t are 73.6%, 63.5%, and 61.7%, respectively, as determined by the EBSD band contrast peak method. The decreasing martensite fraction from the surface to 1/2t is attributed to the reduced cooling rate along the thickness direction.
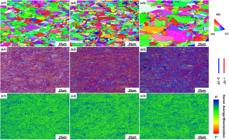
PAGBs reconstruction by the open-source algorithm within the MTEX toolbox (a1~a3), EBSD BC maps with grain boundary misorientation distributions (b1~b3) and KAM maps (c1~c3) of the experimental steel under TMCP at surface (a1~c1), 1/4t (a2~c2) and 1/2t (a3~c3).
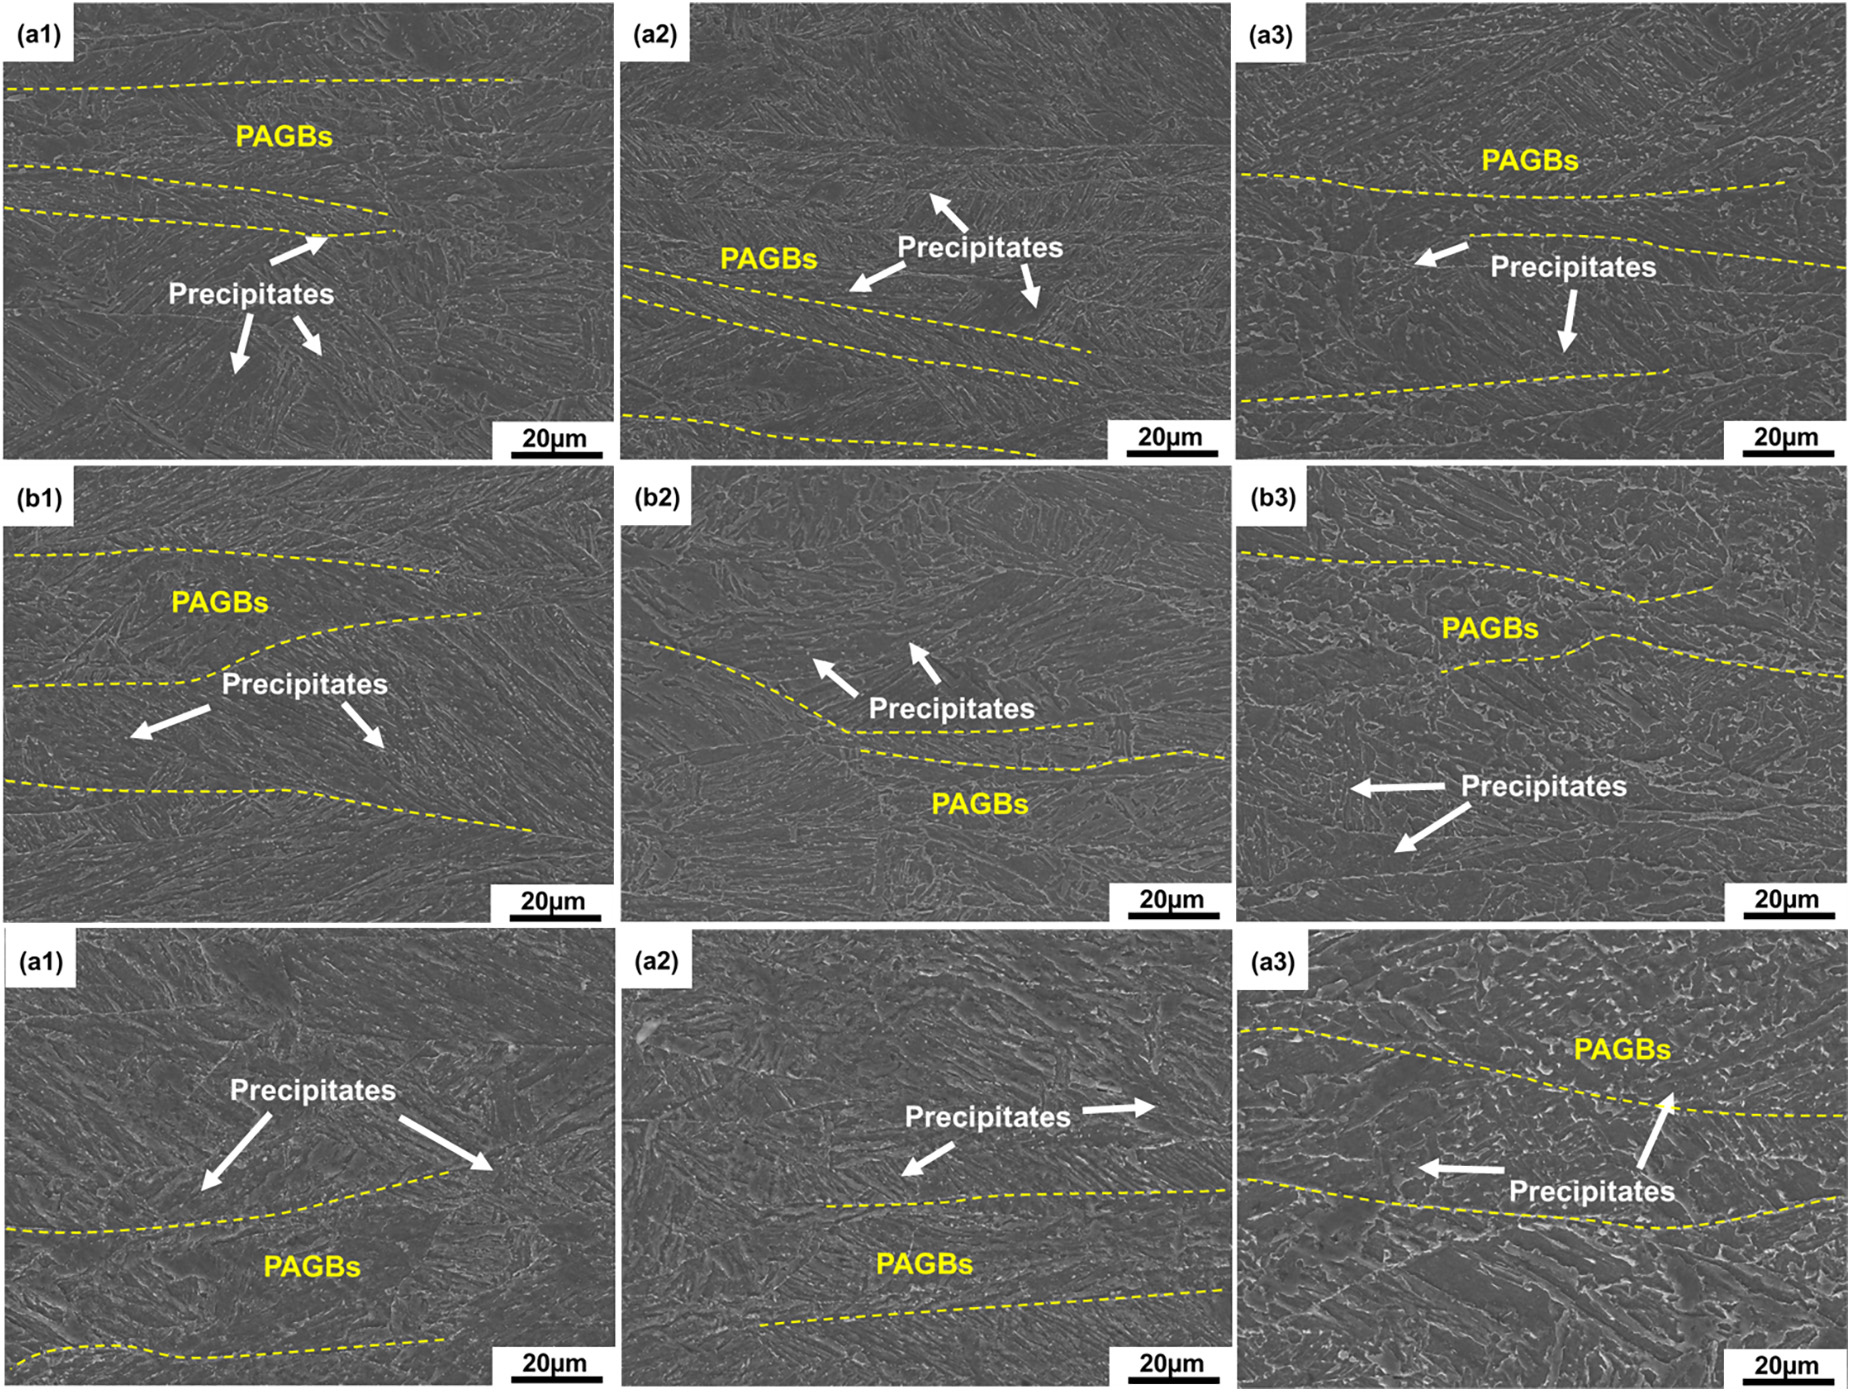
Figure 5 presents SEM micrographs of the experimental steel tempered at 300 °C, 450 °C, and 600 °C after TMCP, obtained at various thickness positions (surface, 1/4t, and 1/2t). At 300 °C, as a result of martensite decomposition, the prior austenite grain boundaries are clearly visible, and numerous fine needle-like and film-like carbides are uniformly dispersed both within the prior austenite grains and along the martensitic laths. As the tempering temperature increases to 450 °C, the prior austenite grain boundaries become increasingly indistinct. The number of carbides decreases, and some of them coarsen and transform into a spheroidized morphology, mainly located at prior austenite grain boundaries, lath boundaries and within the matrix. After tempering at 600 °C, the prior austenite grain boundaries become markedly blurred, and the carbide population decreases further. Most carbides evolve into coarse, spheroidized particles distributed along the prior austenite grain boundaries, lath boundaries and within the matrix.
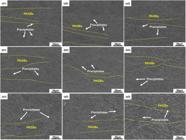
SEM micrographs of the experimental steel under TMCP and tempering process (a1~a3) 300 °C, (b1~b3) 450 °C and (c1~c3) 600 °C at different thickness: (a1~c1) surface, (a2~c2) 1/4t and (a3~c3) 1/2t.
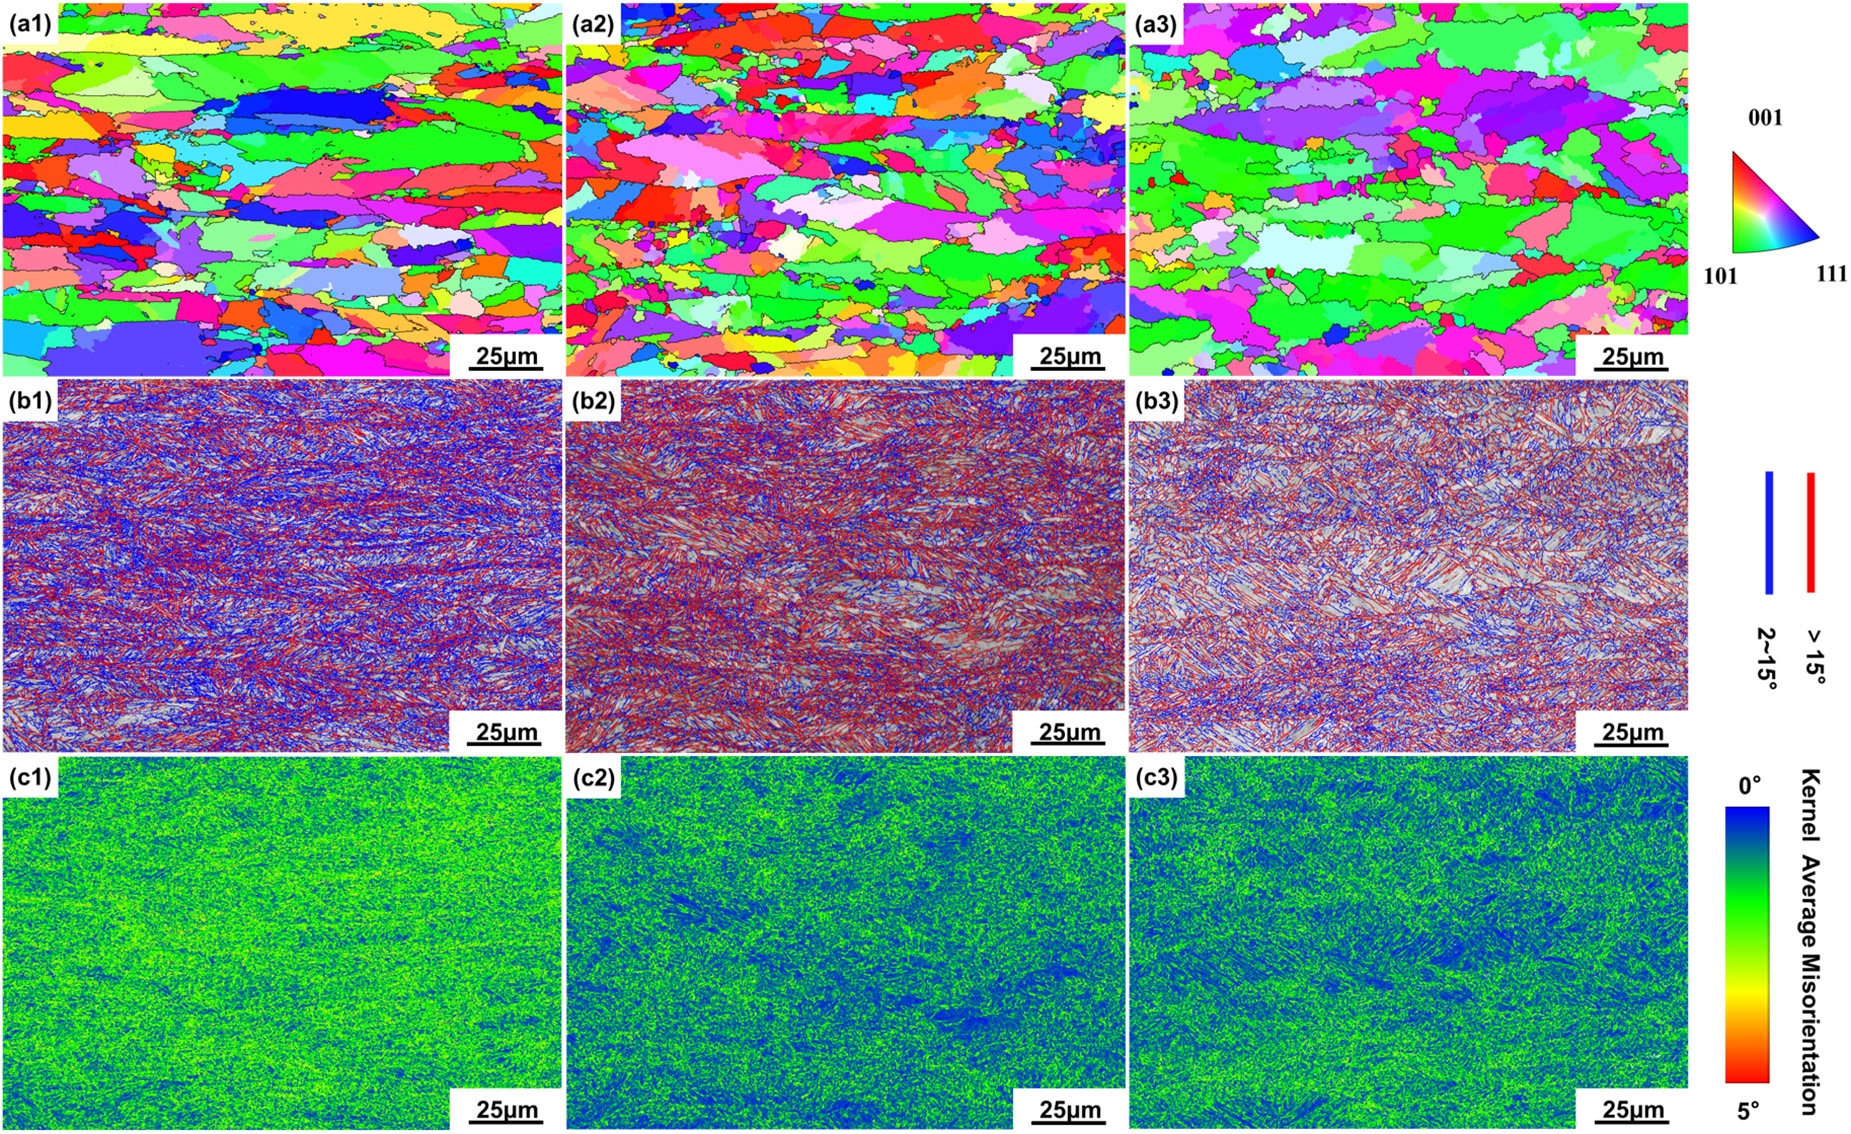
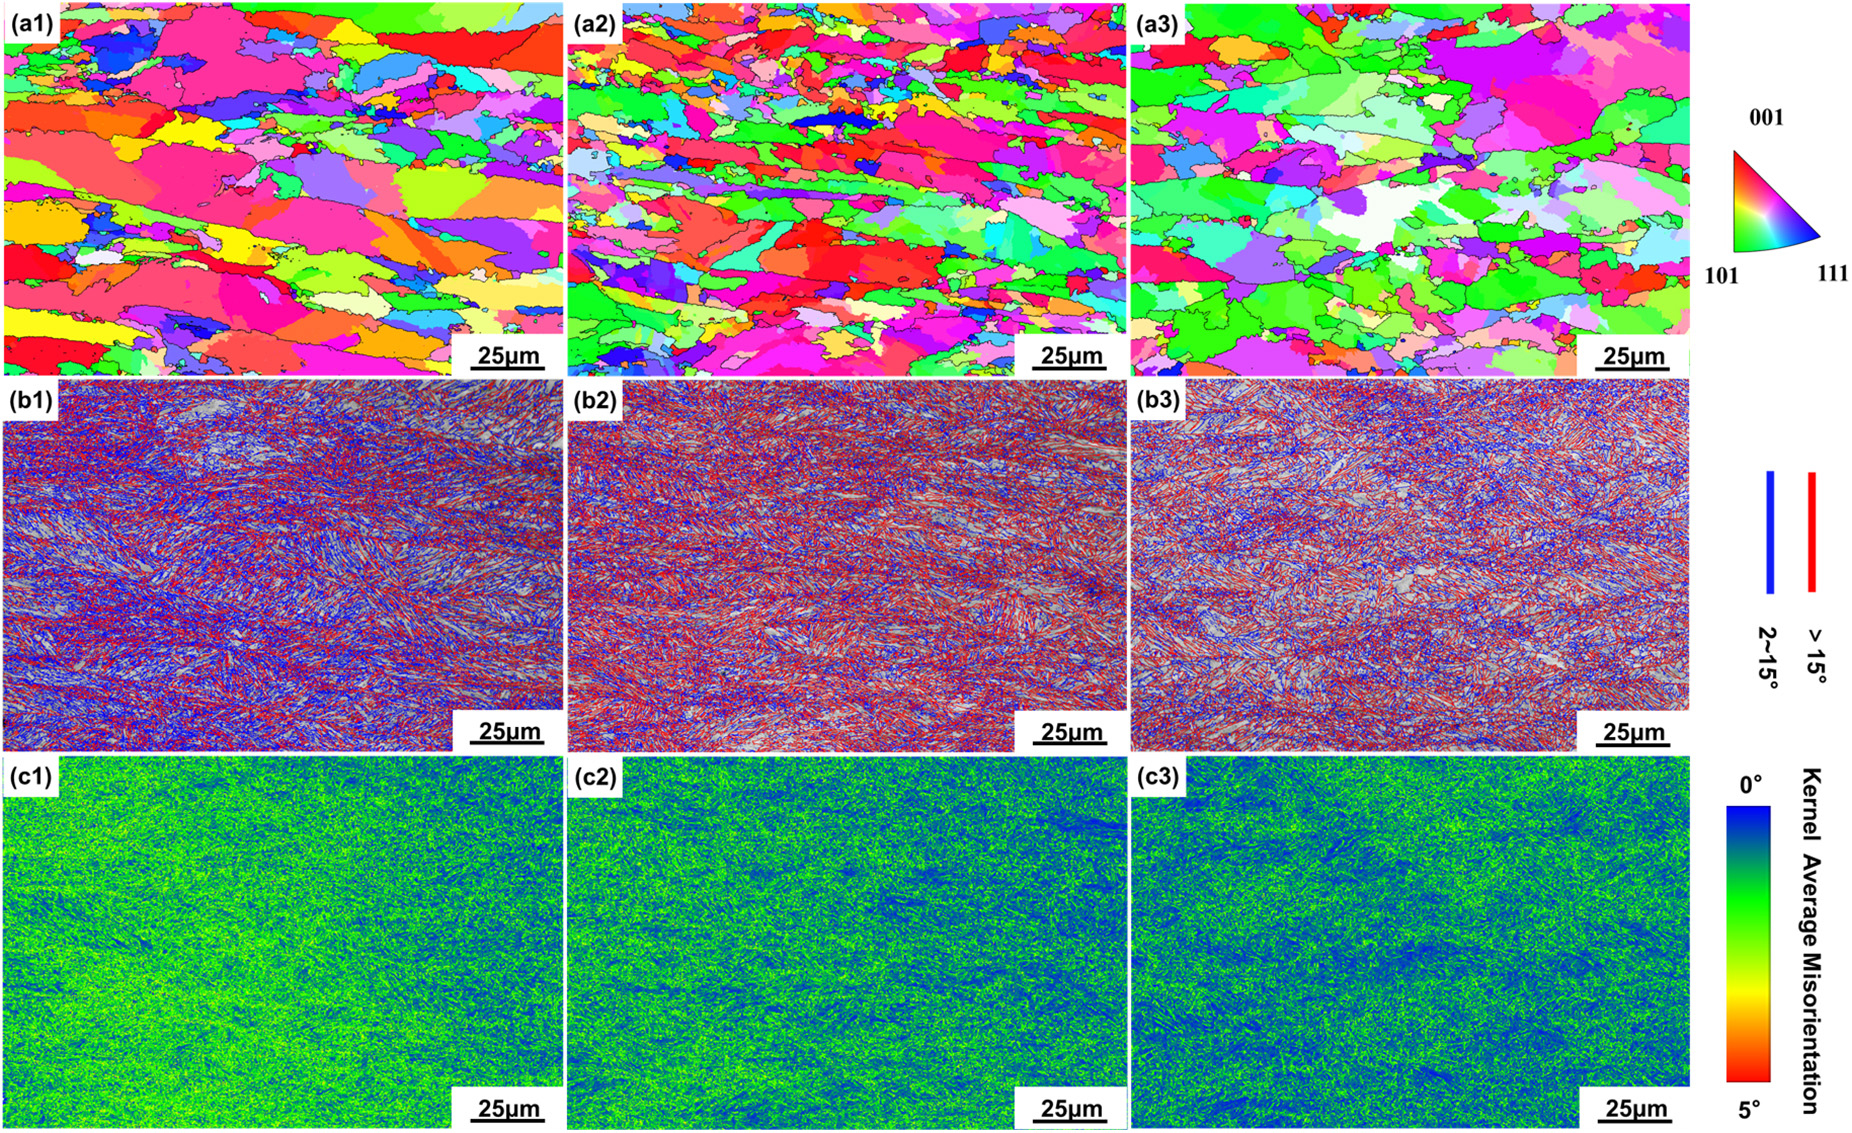
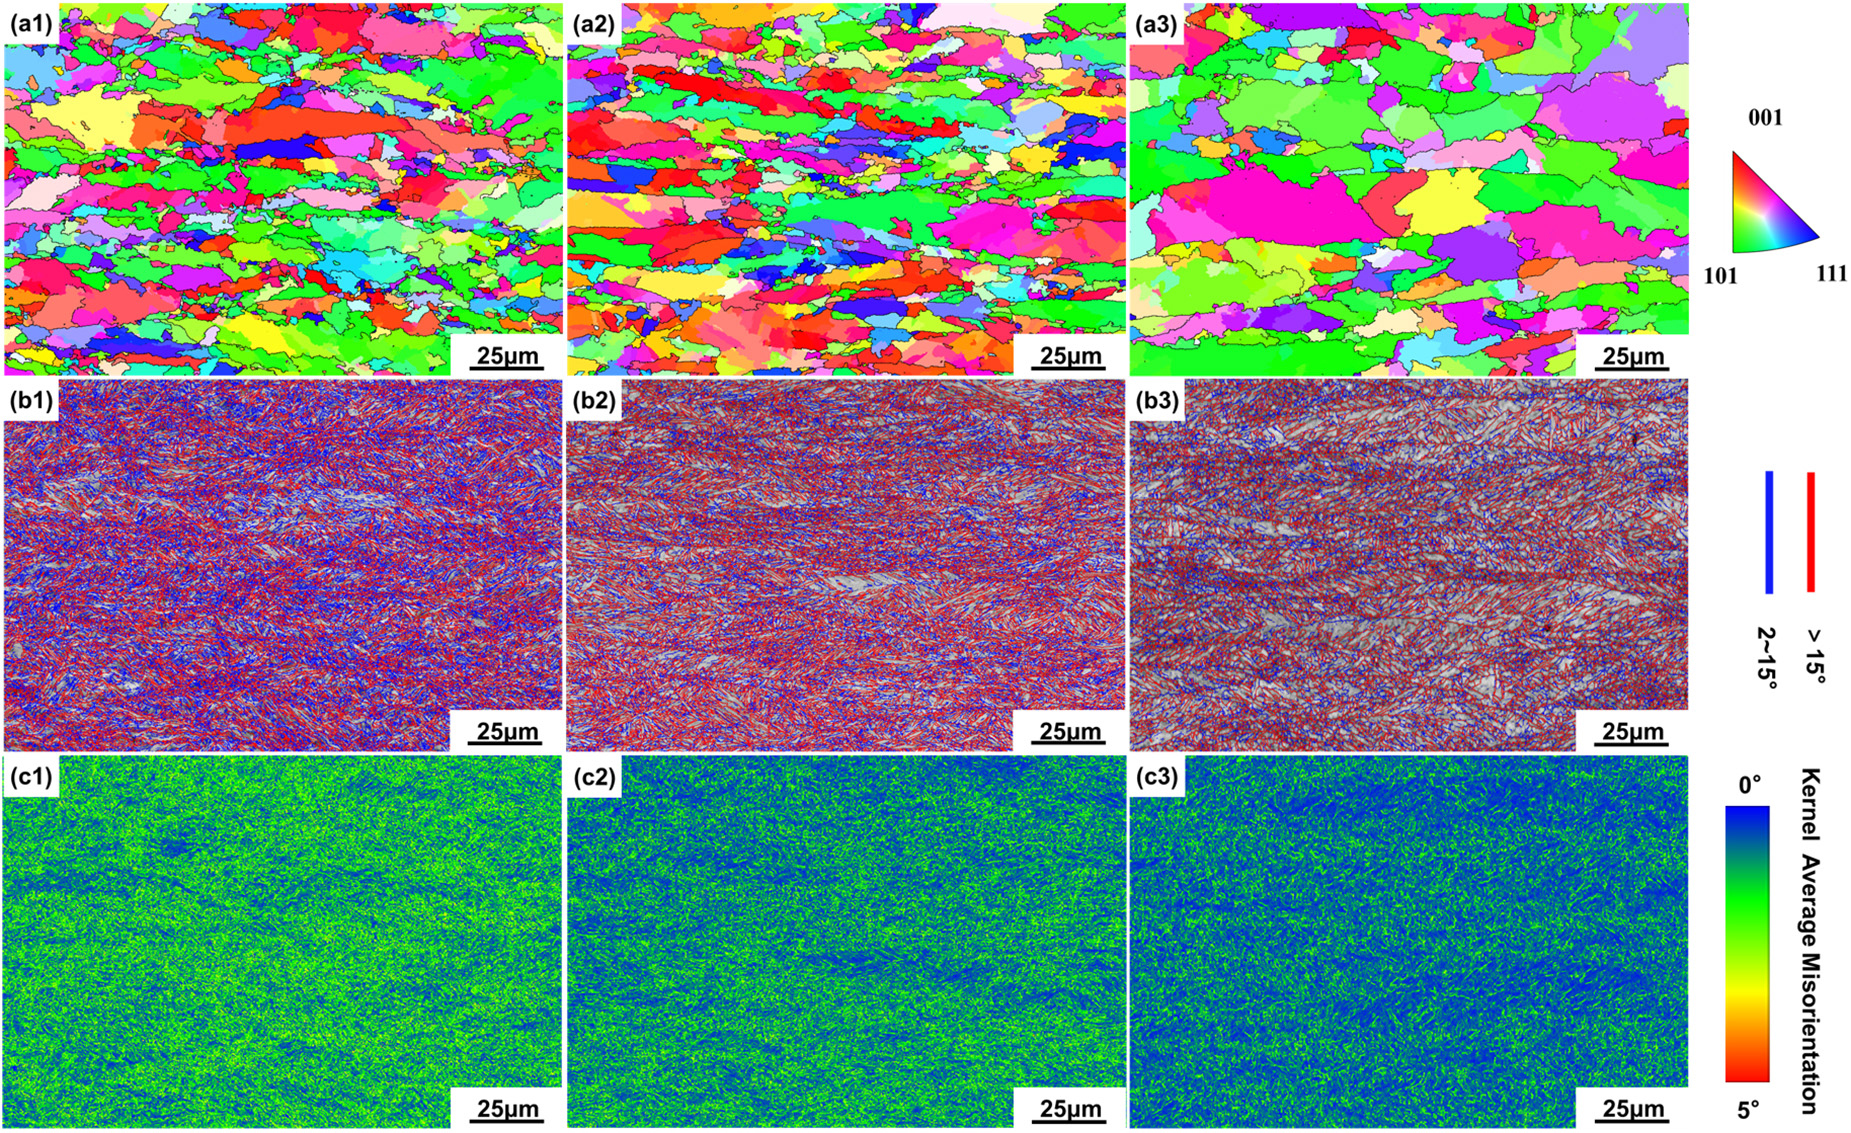
Figure 6 to Figure 8 respectively present the PAGB reconstructions obtained using open-source algorithm within the MTEX toolbox, the BC maps with grain boundary misorientation distributions and the KAM maps measured at different thickness positions (surface, 1/4t and 1/2t) after TMCP and tempering at 300 °C, 450 °C and 600 °C. Under tempering at 300 °C, the EGS on the surface, 1/4t and 1/2t are 2.87 μm, 2.74 μm and 3.34 μm, respectively. After tempering at 450 °C, these values increase slightly to 2.91 μm, 2.81 μm, 3.46 μm, and further to 3.12 μm, 2.88 μm and 3.54 μm after tempering at 600 °C. As shown in Fig6a1~a3, Fig7a1~a3 and Fig8a1~a3, the size of the PAGBs decreases from the surface to 1/4t and then increases toward 1/2t, reaching the largest value at the 1/2t. This trend is consistent with the variation in EGS along the thickness direction.
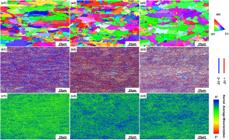
PAGBs reconstruction by the open-source algorithm within the MTEX toolbox (a1~a3), EBSD BC maps with grain boundary misorientation distributions (b1~b3) and KAM maps (c1~c3) of the experimental steel under TMCP and tempering at 300 °C at surface (a1~c1), 1/4t (a2~c2) and 1/2t (a3~c3).
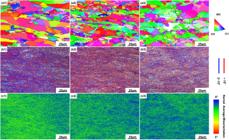
PAGBs reconstruction by the open-source algorithm within the MTEX toolbox (a1~a3), EBSD BC maps with grain boundary misorientation distributions (b1~b3) and KAM maps (c1~c3) of the experimental steel under TMCP and tempering at 450 °C at surface (a1~c1), 1/4t (a2~c2) and 1/2t (a3~c3).
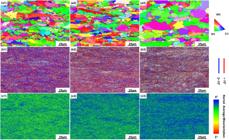
PAGBs reconstruction by the open-source algorithm within the MTEX toolbox (a1~a3), EBSD BC maps with grain boundary misorientation distributions (b1~b3) and KAM maps (c1~c3) of the experimental steel under TMCP and tempering at 600 °C at surface (a1~c1), 1/4t (a2~c2) and 1/2t (a3~c3).
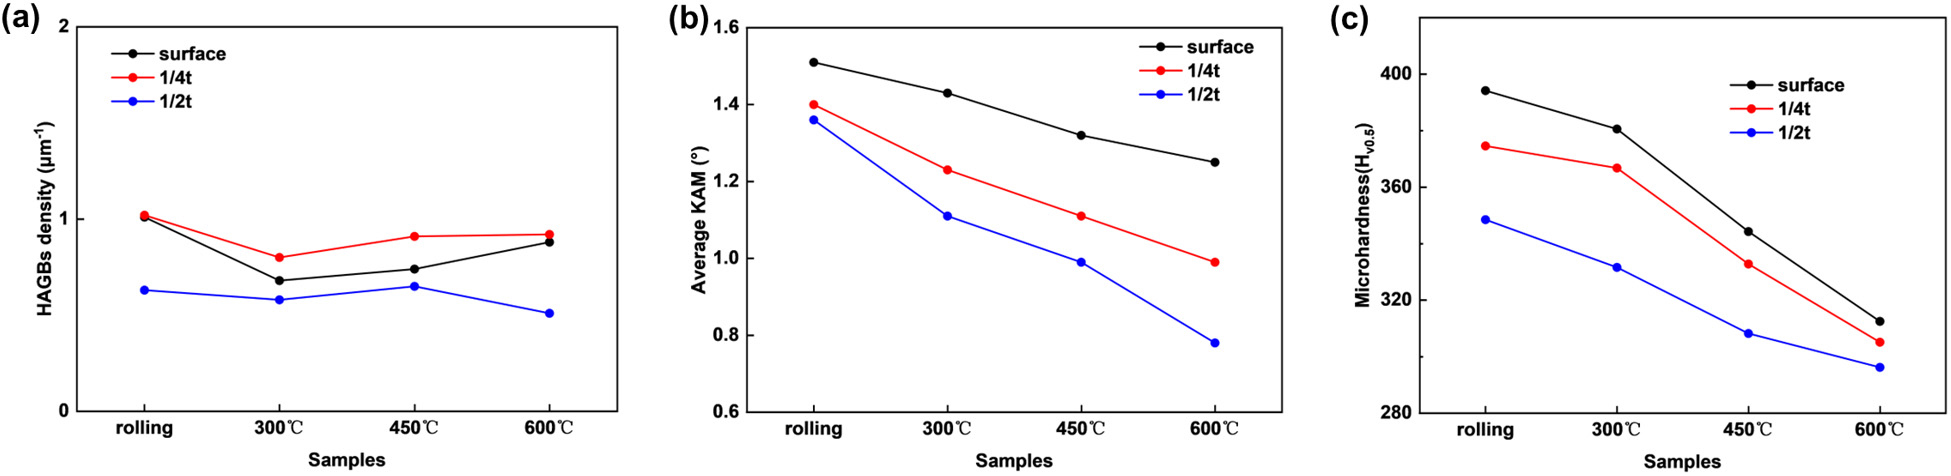
Figure 9a presents the HAGBs density of the specimens at different thicknesses under TMCP and tempering at 300 °C, 450 °C and 600 °C after TMCP, respectively. Under TMCP, the HAGBs density at the surface, 1/4t and 1/2t are 1.01 μm–1, 1.05 μm–1 and 0.63 μm–1, respectively. The HAGBs density at the surface, 1/4t and 1/2t are 0.68 μm–1, 0.80 μm–1 and 0.58 μm–1 after tempering at 300 °C, 0.74 μm–1, 0.91 μm–1 and 0.65 μm–1 after tempering at 450 °C and 0.88 μm–1, 0.92 μm–1 and 0.51 μm–1 after tempering at 600 °C, respectively. Figure 9b illustrates the average KAM of the samples at different thickness under TMCP and tempering at 300 °C, 450 °C and 600 °C after TMCP, respectively. The average KAM at the surface, 1/4t and 1/2t are 1.51°, 1.4°, 1.36° under TMCP, 1.43°, 1.23° and 1.11° under tempering at 300 °C, 1.32°, 1.11° and 0.99° under tempering at 450 °C and 1.25°, 0.99° and 0.78° under tempering at 600 °C, respectively. Figure 9c presents the microhardness of the samples at different thicknesses under TMCP and tempering at 300 °C, 450 °C and 600 °C after TMCP, respectively. Under TMCP, the microhardness at the surface, 1/4t and 1/2t are 394.2 Hv, 374.6 Hv and 348.5 Hv, respectively. After tempering at 300 °C, these values decrease to 380.6 Hv, 366.8 Hv and 331.6 Hv, at 450 °C to 344.3 Hv, 332.8 Hv and 308.2 Hv, and 600 °C to 312.5 Hv, 305.1 Hv and 296.2 Hv, respectively.
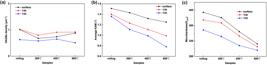
(a) The HAGBs density, (b) average KAM, (c) microhardness of the experimental steel at different thicknesses under TMCP and tempering at 300 °C, 450 °C and 600 °C after TMCP.
As mentioned above, the average KAM and microhardness gradually decrease from surface to 1/2t under the same treatment process, resulting from the steady reduction in the volume of martensite from surface to 1/2t, and the average KAM and microhardness gradually decrease with tempering temperature at the same thickness, aligning with a reduction in dislocation density. It is interesting to notice that the HAGBs density exhibits a more complex variation compared with that of the average KAM and microhardness. Under the same treatment condition, the HAGBs density increases from surface to 1/4t and then decreases to 1/2t. Moreover, the HAGBs density does not change monotonically with tempering temperature. Under TMCP process, the specimens exhibit the highest HAGBs density at all thickness (surface, 1/4t, and 1/2t). As the tempering temperature increases, the HAGBs density first significantly decreases from the 300 °C (rolling) to 300 °C, and then gradually increases to 600 °C.
3.2. Dislocation density
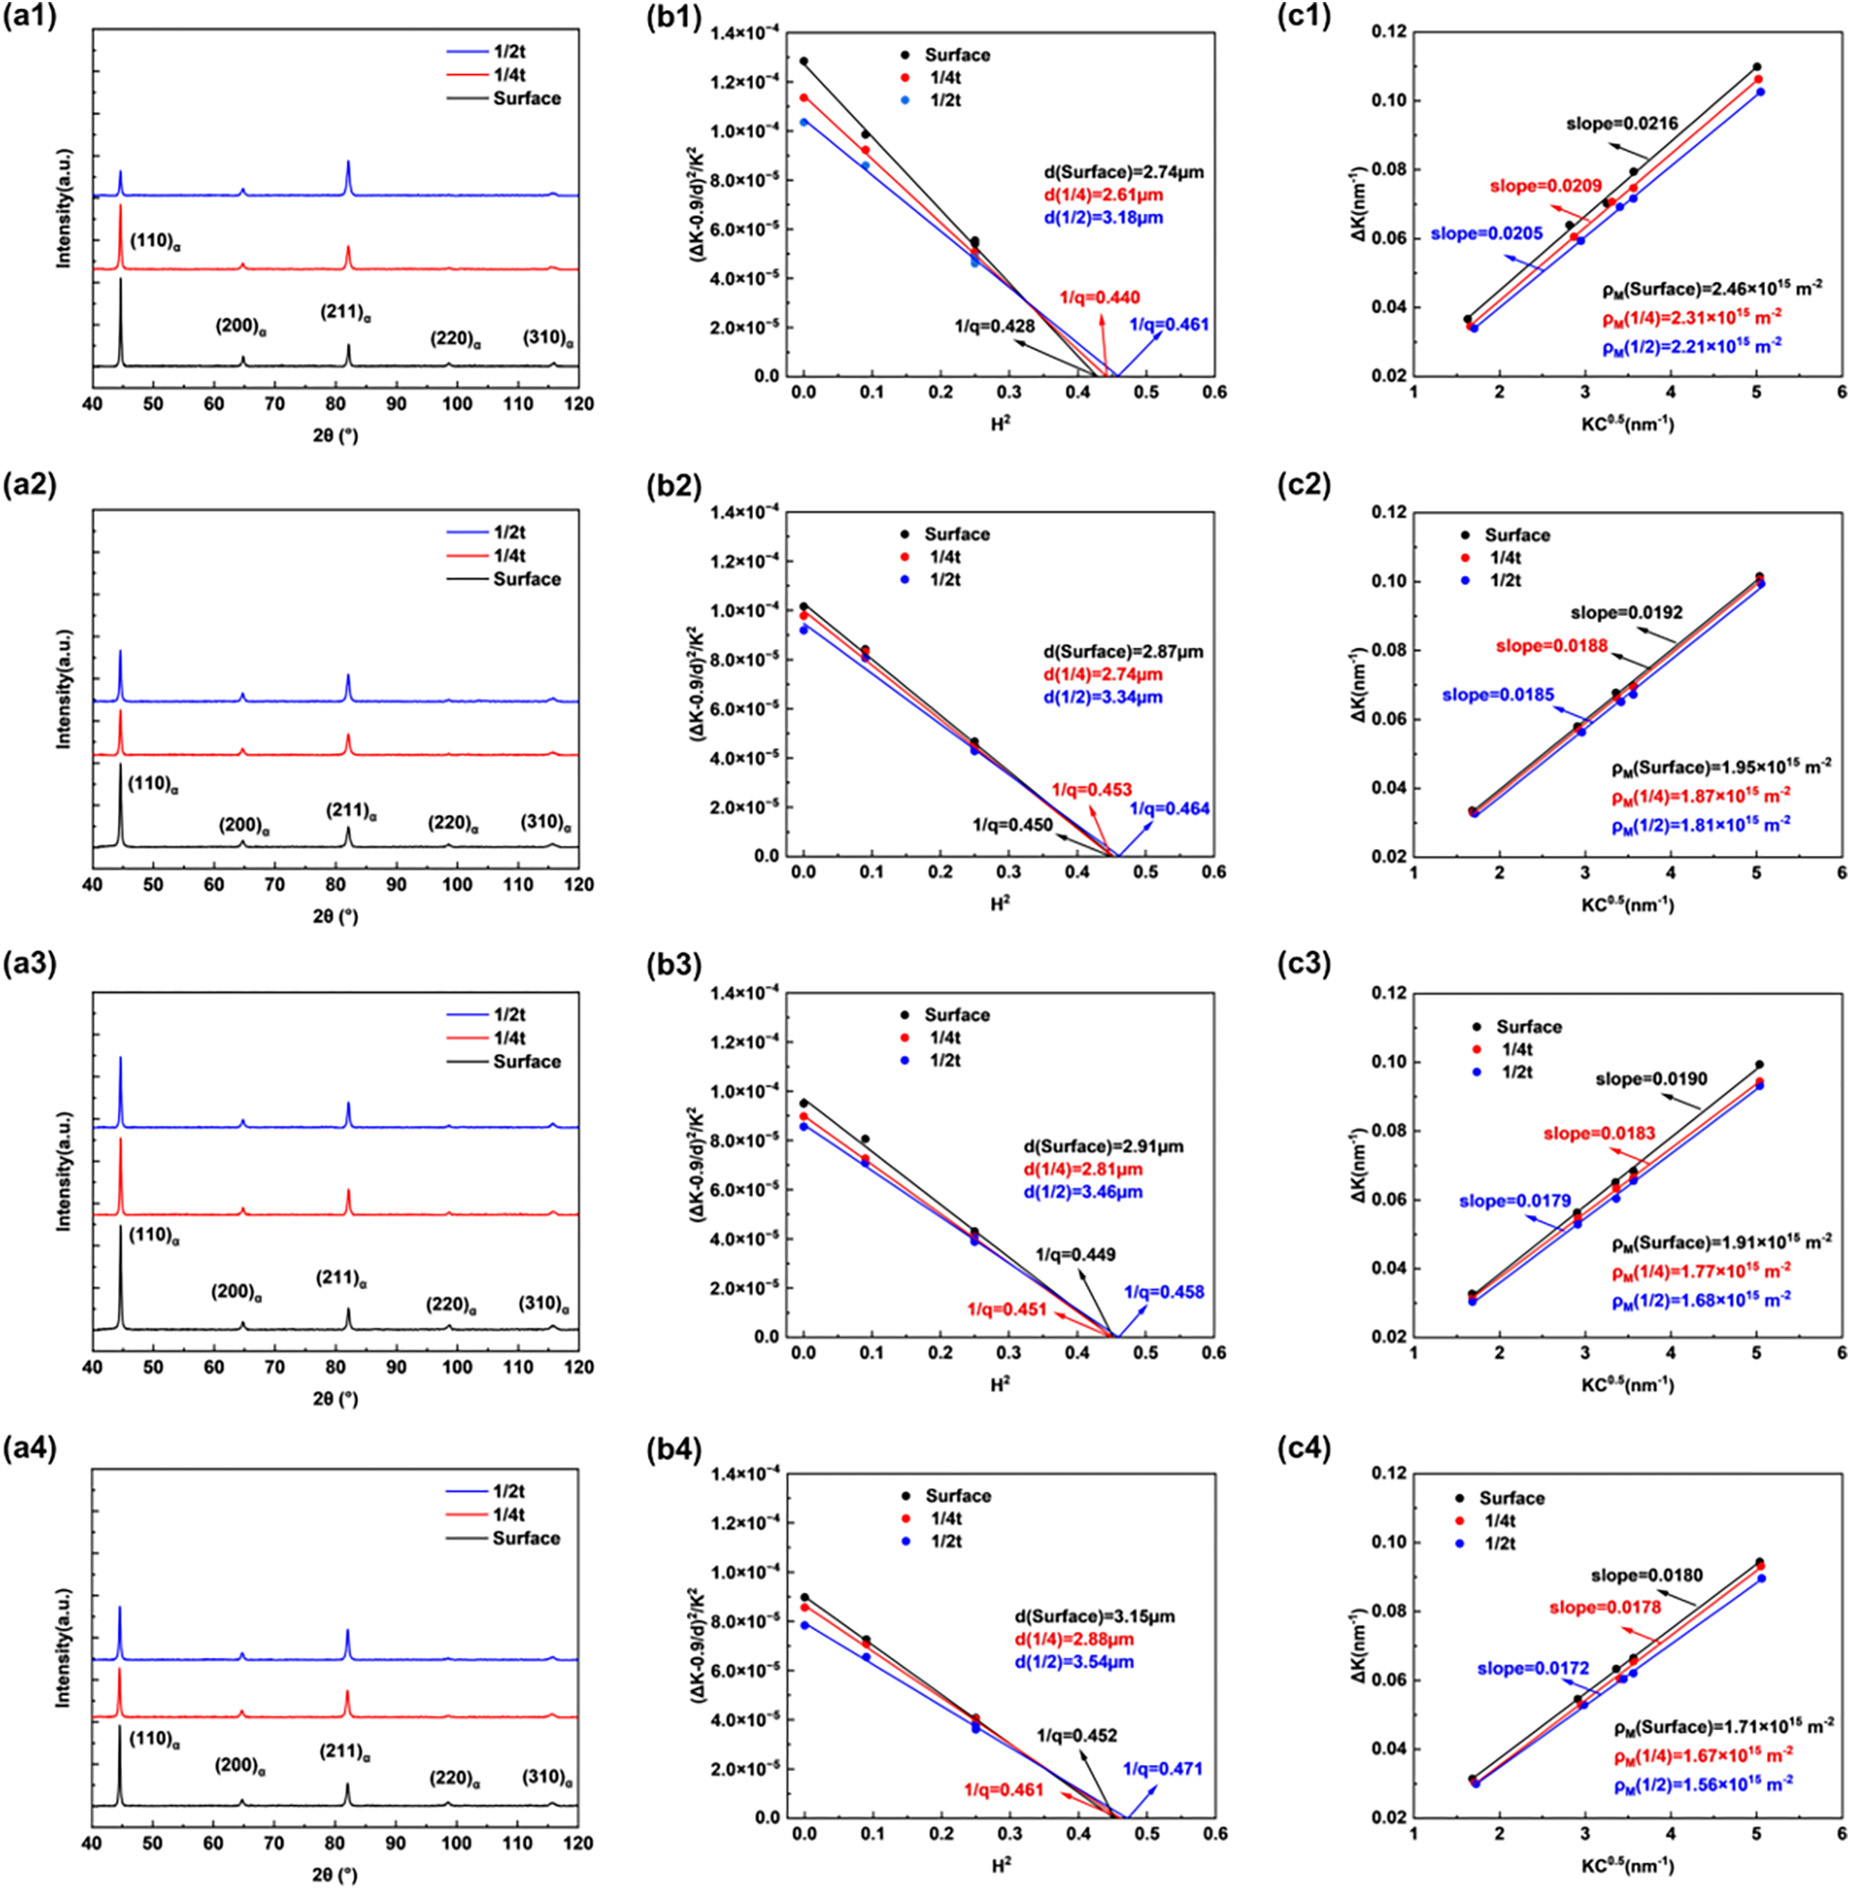
Figure 10 show the XRD patterns, dislocation density and the full width at half maximum (FWHM) values obtained from the XRD analysis of the experimental steel under TMCP and subsequent tempering at different thickness. The dislocation density was estimated using the Williamson-Hall (MWH) modified method, as expressed by equations (1) and (2) [20, 21]:
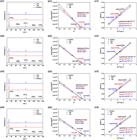
(a1~a4) XRD patterns, (b1~b4) (ΔK−0.9/d)2/K2 versus H2 and (c1~c4) MWH plots of the experimental steel at different thickness under TMCP: (a1~c1) rolling, (a2~c2) tempering at 300 °C, (a3~c3) tempering at 450 °C and (a4~c4) tempering at 600 °C.
where C̄K represents the FWHM of a line profile eliminating the effect of the instrumental broadening, d and b denote the mean particle size and the Burger’s vector (0.248 nm for bcc), respectively [22]. A is the dislocation distribution parameter (1.4 for bcc). ρM is the dislocation density of matrix. K, θ and λ are the diffraction vector, half of diffraction angle and the wavelength (0.154 nm for Cu), is the average of the geometrical factors determined by the relative positions between the Burgers and the line vectors of dislocations and the K, and O is a higher order term of K0.5.
is written as equation (3):
in which hoo is the average dislocation contrast factor for the {h00} reflections and is determined by the dislocation contrast factor of pure screw (Ch00s) and edge (Ch00e) dislocations as well as their fractions (fscrew and fedge), q is a parameter and can be used to calculate the fscrew and fedge, and H2 = (h2l2 + h2k2 + k2l2)/(h + k + l)2. Ch00s and Ch00e can be obtained according to the reference. q can be calculated by combining equations (1)–(3) and choosing an optimal value d. The q and d can be obtained by the XRD refinement results [23, 24].
As illustrated in Figure 10, the dislocation density of the experimental steel under TMCP at the surface, 1/4t and 1/2t are 2.46 × 10¹⁵ m–2, 2.31 × 10¹⁵ m–2 and 2.21 × 10¹⁵ m–2, respectively. After tempering at 300 °C, these values decrease to 1.95 × 10¹⁵ m–2, 1.87 × 10¹⁵ m–2 and 1.81 × 10¹⁵ m–2, after tempering at 450 °C, they further decline, they further decline to 1.91 × 10¹⁵ m–2, 1.77 × 10¹⁵ m–2 and 1.68 × 10¹⁵ m–2, and after tempering at 600 °C, they decrease to 1.71 × 10¹⁵ m–2, 1.67 × 10¹⁵ m–2 and 1.56 × 10¹⁵ m–2, respectively. The result indicate that the dislocation density gradually decreases from surface to 1/2t under the identical processing. Moreover, the dislocation density consistently decreases with tempering temperature at the same thickness, which can be attributed to carbon dissolution and the recovery of martensite.
3.3. Tensile property
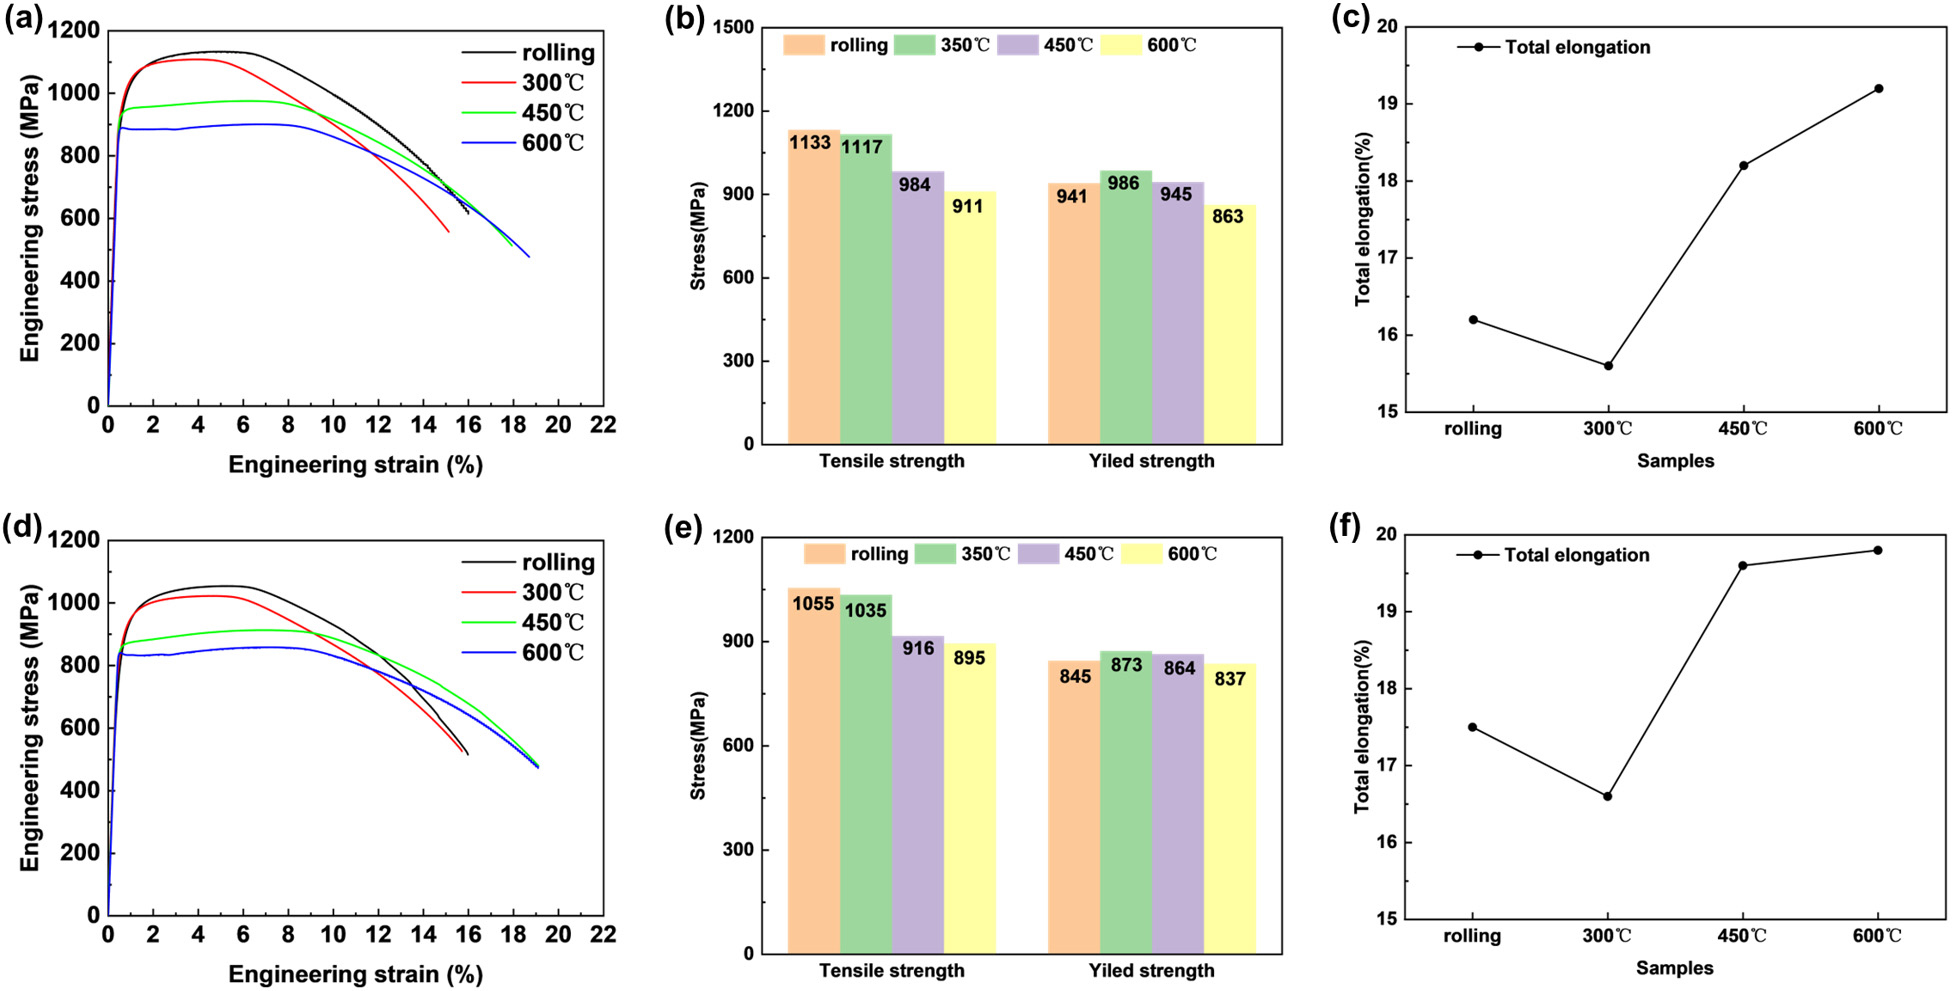
The tensile properties of the experimental steel plates at different thickness positions under TMCP, as well as after tempering at 300 °C, 450 °C, and 600 °C, are summarized in Figure 11 and Table 1. Figure 11a and Figure 11d present the engineering strain and engineering stress curves at 1/4t and 1/2t under different processing conditions, while the corresponding tensile properties are shown in Figure 11b–c and Figure 11e–f.
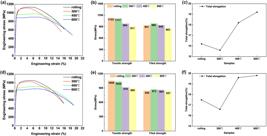
Tensile properties of the experimental steel at different thicknesses under TMCP and tempering at 300 °C, 450 °C and 600 °C after TMCP (a) engineering strain and engineering stress curves at 1/4t, (b) yield strength and tensile strength at 1/4t (c) total elongation at 1/4t, (d) engineering strain and engineering stress curves at 1/2t, (e) yield strength and tensile strength at 1/2t and (f) total elongation at 1/2t of the tensile samples.
In the TMCP condition, the steel exhibits an excellent combination of strength and ductility, with a TS of 1133 MPa and YS of 941 MPa at 1/4t, and 1055 MPa (TS) and 845 MPa (YS) at 1/2t. The TE reaches 16.2% and 17.5% at 1/4t and 1/2t, respectively. When the tempering temperature increases from 0 °C (as-rolled) to 300 °C, both TS and TE slightly decrease, whereas YS shows a moderate increase at both 1/4t and 1/2t (TS: 1117 MPa at 1/4t and 1035 MPa at 1/2t; YS: 986 MPa at 1/4t and 873 MPa at 1/2t; TE: 15.6% at 1/4t and 16.6% at 1/2t). As the tempering temperature further rises from 300 °C to 600 °C, TS and YS exhibit a gradual decline, while TE increases noticeably (TS: 911 MPa at 1/4t and 895 MPa at 1/2t; YS: 863 MPa at 1/4t and 837 MPa at 1/2t; TE: 19.2% at 1/4t and 19.8% at 1/2t).
Overall, at both 1/4t and 1/2t, the TS and gradually decrease with tempering temperature increases from 0 °C (rolled) to 600 °C, the YS initially increases from 0 °C to 300 °C and then decreases beyond 300 °C, conversely, the total elongation firstly decreases from 0 °C to 300 °C and then increases from 300 °C to 600 °C
3.4. Impact toughness
The impact toughness of the experimental steel plates at different thickness after TMCP and subsequent tempering at 300 °C, 450 °C, and 600 °C is summarized in Table 2. As the tempering temperature increases from the 0 °C (rolled) to 600 °C, the impact toughness at −40 °C initially decreases from 45 J in the rolled state to 37 J after tempering at 300 °C, and subsequently increases to 92 J after tempering at 600 °C at the 1/4t. A similar variation trend is observed at the 1/2t position, where the impact toughness at 40 °C decreases from 104 J in the rolled condition to 52 J after tempering at 300 °C, followed by a pronounced increase to 131 J after tempering at 600 °C. Overall, tempering at 450 °C after TMCP provides an optimal balance of high strength, good ductility, and excellent toughness at both 1/4t and 1/2t positions.
4. DICUSSION
4.1. Effect of tempering temperature on microstructure
Under the TMCP process, the microstructure across the entire thickness predominantly consists of flattened martensite and bainite. The fraction of martensite gradually decreases from the surface to the 1/2t due to the reduced cooling rate. In addition, the size of the PAGBs decrease from surface to 1/4t and then increases to 1/2t. This variation is mainly attributed to the nonuniform deformation and temperature distribution through the plate thickness during hot rolling. Near the surface, the material experiences high strain rates, but also rapid cooling, which can suppress complete recrystallization and result in relatively coarse or irregular austenite grains. At approximately 1/4t, the combination of sufficient deformation and favorable temperature conditions promotes the most effective dynamic and static recrystallization, leading to the finest PAGBs. Toward the 1/2t, the deformation is significantly lower and the temperature remains high for longer periods, causing incomplete recrystallization and subsequent grain growth, which coarsens the PAGBs again.
During tempering, several concurrent processes occur, including carbon diffusion, microstructural recovery, the evolution of dislocation density, and the nucleation and growth of precipitates. When tempered between 300 °C and 600 °C, the martensitic and bainitic structures progressively recover, merge, and decompose. This evolution originates from the high dislocation density within these metastable phase and supersaturated solid solution. As the tempering temperature increases from 300 °C to 600 °C, the dislocation density gradually decreases both at the surface, 1/4t and 1/2t. This reduction is attributed to the enhanced thermal activation of dislocations at elevated temperatures, which promotes their rearrangement, merging, and mutual annihilation, thereby reducing the dislocation density [25]. The increase in tempering temperature provided energy for atomic diffusion, and the further diffusion of carbon atoms made the prior austenite grain boundaries and martensitic lath boundaries become the main carbon atom segregation areas [26]. In addition, carbon atoms tended to migrate toward dislocations and interact with them, thereby reducing lattice distortion, lowering the system energy, and enhancing the overall stability of the tempered microstructure. With the increase in tempering temperature from 300 °C to 600 °C, enhanced atomic mobility promotes substantial diffusion, causing laths to merge and sub-grains to grow. As a result, sub-grain boundaries gradually transform into HAGBs, while the coalescence of laths results in a progressive reduction in the fraction of LAGBs. Overall, elevated tempering temperature accelerates atomic diffusion and grain boundary migration, and the merging of laths further promotes boundary migration.
The evolution of precipitates also plays a crucial role in determining the mechanical properties. As illustrated in Figure 5, tempering at 300 °C results in the decomposition of martensite and bainite, leading to carbon segregation at dislocations and grain boundaries. Needle-like and film-like carbides are dispersed along the lath boundaries and prior austenite grain boundaries. As the tempering temperature increases to 450 °C and 600 °C, the carbides decrease in number and coarsen into a spheroidized morphology distributed along the prior austenite grain boundaries, lath boundaries and inside the matrix.
4.2. Effect of tempering temperature on tensile property
Different tempering temperatures led to varying degrees of recovery and atomic diffusion, which mainly influence the decomposition of martensite/bainite, the evolution of carbide precipitation and the dislocation density. These microstructural changes subsequently affect precipitation strengthening and dislocation strengthening, etc., resulting in different mechanical properties. It is well known that tensile strength is generally positively correlated with microhardness. As shown in Figure 9c and Figure 11b and e, both the tensile strength and microhardness decrease from 1/4t to 1/2t, primarily due to the reduced fraction of martensite. With increasing tempering temperature, the tensile strength and microhardness gradually decline, which is mainly attributed to the progressive reduction in dislocation density during the recovery and decomposition of martensite and bainite.
The yield strength initially increases as the tempering temperature rises from 0 °C (rolling) to 300 °C, and then decreases as the temperature further increases to 600 °C at both 1/4t and 1/2t. During the TMCP process, a large number of mobile dislocations exist in the microstructure. Because carbon atoms are trapped within the martensitic/bainitic matrix, these dislocations can move easily under lower stress, leading to a relatively low yield strength [27, 28]. Moreover, the continuous yielding behaviour observed in the true stress–true strain curves (Figure 11a and d) further confirm the presence of abundant mobile dislocations.
When tempered at 300 °C, the supersaturated carbon in the martensitic/bainitic matrix precipitates to form fine needle-like and film-like carbides. the dislocation density decreases and the dislocations are pinned by the segregated carbides, increasing the stress required for dislocation motion and thereby enhancing the yield strength. As the tempering temperature further increases to 450 °C and 550 °C, most of the residual stresses are relieved due to the rearrangement of dislocations within the martensite/bainite structure. Meanwhile, the carbides become coarser and more spheroidal as a result of the decomposition of martensite and bainite, leading to a reduction in their pinning effect on dislocations [29, 30]. Consequently, the matrix undergoes significant softening, and the yield strength gradually decreases. In addition, the yield strength at 1/4t remains consistently higher than that at 1/2t, which can be attributed to the higher dislocation density and finer effective grain size at 1/4t.
4.3. Effect of tempering temperature on impact toughness
Numerous studies have demonstrated that microstructural constituents and effective grain size play crucial roles in determining the impact toughness of high-strength low-alloy (HSLA) steels. Previous research has identified EGS, HAGBs density, average KAM value, dislocation density and martensite/austenite (M/A) size as key factors governing impact toughness. In particular, large MA within blocky microstructures tend to act as preferential crack nucleation sites, thereby deteriorating impact toughness. Accordingly, reducing the effective grain size and increasing the HAGBs density are generally considered effective strategies for improving the impact toughness of HSLA steels. However, in the present study, the MA size gradually larger from 1/4t to 1/2t. Except for the initial condition, the EGS at 1/4t is smaller than that at 1/2t, while the HAGBs density at 1/4t is higher. Despite these microstructural advantages, the impact toughness at 1/4t is lower than that at 1/2t. This inconsistency suggests that EGS and HAGBs density are not the dominant factors controlling the impact toughness variations through the thickness. Instead, the average KAM value, dislocation density is likely the primary factor responsible for the observed differences in impact toughness. The higher KAM value, dislocation density at the 1/4t position indicates a higher dislocation density and greater local lattice distortion [31]. During impact loading, these regions are prone to severe local stress concentration, which promotes the nucleation of microcracks and reduces the ability for materials to accommodate plastic deformation. Consequently, the impact toughness at 1/4t is lower than that at 1/2t. In addition, the impact toughness decreases from 0 °C (rolling) to 300 °C and then increases with further increase of tempering temperature from 300 °C to 600 °C for the both 1/4t and 1/2t. The increase in impact toughness is primarily attributed to the recovery of martensite and bainite, particularly after tempering at higher temperatures, as described above. In contrast, the decrease in impact toughness observed at 300 °C was associated with the formation of film-like carbides along grain boundaries. Therefore, from the perspective of toughness, tempering at 300 °C should be avoided during heat treatment, which degrades the − 40 °C impact toughness.
5. CONCLUSIONS
-
(1)
The HSLA steel plate processed by TMCP exhibited a mixed microstructure of martensite and bainite, with decreasing martensite fraction, dislocation density, and hardness from the surface to the 1/2t. However, the size of the PAGBs and the effective grain size decreases from the surface to 1/4t and then increases toward 1/2t, correlating with the difference in strain rates and temperatures.
-
(2)
Tempering at 300–600 °C led to progressive recovery of martensite and bainite, accompanied by carbide precipitation, coarsening, and spheroidization. The dislocation density decreased steadily with increasing tempering temperature. The tensile strength and microhardness decreased with tempering temperature, while the total elongation and impact toughness increased. The yield strength first increased at 300 °C due to precipitation hardening and then decreased beyond 300 °C as softening dominated. Meanwhile, the impact toughness reached its maximum after tempering at 600 °C, while tempering at 300 °C the impact toughness sharply decreased due to film-like carbide.
-
(3)
Tempering at 450 °C after TMCP provided the best overall combination of high strength, good ductility, and excellent toughness, significantly improving the uniformity of mechanical properties along the thickness direction.
6. ACKNOWLEDGMENTS
This work was supported by the Liaoning Academy of Materials, and the Hebei Province Natural Science Foundation - Iron and Steel Joint Research Foundation (No. E2022318003).
7. BIBLIOGRAPHY
-
[1] ZHU, W., CUI, J., FENG, Y., et al, “Achieving excellent strength‐ductility balance and lower yield ratio in a 690 Mpa‐Grade multiphase construction steel”, Steel Research International, v. 93, n. 7, pp. 2100750, 2022. doi: https://doi.org/10.1002/srin.202100750.
» https://doi.org/10.1002/srin.202100750 -
[2] XIAO, J., YAN, L., ZHANG, P., et al, “Effects of minor Ce doping on the microstructure and mechanical performances of a EH47 grade HSLA steel for ship and ocean engineering”, Materials Characterization, v. 201, pp. 112931, 2023. doi: https://doi.org/10.1016/j.matchar.2023.112931.
» https://doi.org/10.1016/j.matchar.2023.112931 -
[3] ZHANG, X., LI, G., ZHAO, H., et al, “Evolution of microstructure and mechanical properties along the thickness direction of 500 MPa HSLA steel heavy plates”, Materials Science and Engineering A, v. 913, pp. 147097, 2024. doi: https://doi.org/10.1016/j.msea.2024.147097.
» https://doi.org/10.1016/j.msea.2024.147097 -
[4] ZHU, W.-T., CUI, J.-J., CHEN, Z.-Y., et al, “Correlation of microstructure feature with impact fracture behavior in a TMCP processed high strength low alloy construction steel”, Acta Metallurgica Sinica, v. 35, n. 4, pp. 527–536, 2022. doi: https://doi.org/10.1007/s40195-021-01250-0.
» https://doi.org/10.1007/s40195-021-01250-0 -
[5] CHEN, Z., LIN, Z., QI, J., et al, “Microstructures and mechanical properties of a new multi-functional 460 MPa grade construction structural steel”, Acta Metallurgica Sinica, v. 35, n. 7, pp. 1131–1142, 2022. doi: https://doi.org/10.1007/s40195-021-01359-2.
» https://doi.org/10.1007/s40195-021-01359-2 -
[6] NISHIOKA, K., ICHIKAWA, K., “Progress in thermomechanical control of steel plates and their commercialization”, Science and Technology of Advanced Materials, v. 13, n. 2, pp. 023001, 2012. doi: https://doi.org/10.1088/1468-6996/13/2/023001. PubMed PMID: 27877477.
» https://doi.org/10.1088/1468-6996/13/2/023001 -
[7] OUCHI, C., “Development of steel plates by intensive use of TMCP and direct quenching processes”, ISIJ International, v. 41, n. 6, pp. 542–553, 2001. doi: https://doi.org/10.2355/isijinternational.41.542.
» https://doi.org/10.2355/isijinternational.41.542 -
[8] BRINKSMEIER, E., CAMMETT, J., KÖNIG, W., et al., “Residual stresses—measurement and causes in machining processes”, CIRP Annals, v. 31, n. 2, pp. 491–510, 1982. doi: https://doi.org/10.1016/S0007-8506(07)60172-3.
» https://doi.org/10.1016/S0007-8506(07)60172-3 -
[9] EL-KHABEERY, M., FATTOUH, M., “Residual stress distribution caused by milling”, International Journal of Machine Tools & Manufacture, v. 29, n. 3, pp. 391–401, 1989. doi: https://doi.org/10.1016/0890-6955(89)90008-4.
» https://doi.org/10.1016/0890-6955(89)90008-4 -
[10] CUI, S., GU, G., SHI, C., et al, “Variations in microstructure and mechanical properties along thickness direction in a heavy high strength low alloy steel plate”, Journal of Materials Research and Technology, v. 26, pp. 9190–9202, 2023. doi: https://doi.org/10.1016/j.jmrt.2023.09.207.
» https://doi.org/10.1016/j.jmrt.2023.09.207 -
[11] WANG, Q., YE, Q., WANG, Z., et al, “Thickness effect on microstructure, strength, and toughness of a quenched and tempered 178 mm thickness steel plate”, Metals, v. 10, n. 5, pp. 572, 2020. doi: https://doi.org/10.3390/met10050572.
» https://doi.org/10.3390/met10050572 -
[12] LI, W., KE, J., XU, Y., et al, “Study of the impact properties and microstructure evolution in a high-strength low-alloy heavy steel”, Materials Science and Engineering A, v. 819, pp. 141404, 2021. doi: https://doi.org/10.1016/j.msea.2021.141464.
» https://doi.org/10.1016/j.msea.2021.141464 -
[13] VILLALOBOS, J.C., DEL-POZO, A., MAYEN, J., et al, “Hydrogen embrittlement suscetibility on X-120 microalloyed steel as function of tempering temperature”, International Journal of Hydrogen Energy, v. 45, n. 15, pp. 9137–9148, 2020. doi: https://doi.org/10.1016/j.ijhydene.2020.01.094.
» https://doi.org/10.1016/j.ijhydene.2020.01.094 -
[14] CHEN, Z., ZHAO, X., QI, J., et al, “Effect of tempering on the microstructure and properties of a new multi-functional 460 MPa Grade construction structural steel”, Journal of Materials Research and Technology, v. 18, pp. 1092–1104, 2022. doi: https://doi.org/10.1016/j.jmrt.2022.03.037.
» https://doi.org/10.1016/j.jmrt.2022.03.037 -
[15] WANG, K., GUI, X., BAI, B., et al, “Effect of tempering on the stability of retained austenite in carbide-free bainitic steel”, Materials Science and Engineering A, v. 850, pp. 143525, 2022. doi: https://doi.org/10.1016/j.msea.2022.143525.
» https://doi.org/10.1016/j.msea.2022.143525 -
[16] SAVAGE, D.J., MCCABE, R.J., KNEZEVIC, M., “An automated procedure built on MTEX for reconstructing deformation twin hierarchies from electron backscattered diffraction datasets of heavily twinned microstructures”, Materials Characterization, v. 171, pp. 110808, 2021. doi: https://doi.org/10.1016/j.matchar.2020.110808.
» https://doi.org/10.1016/j.matchar.2020.110808 -
[17] XU, S., WANG, S., LI, S., et al, “Achieving high strength and large elongation in a strip casting microalloyed steel by ageing treatment”, Materials Science and Engineering A, v. 860, pp. 144217, 2022. doi: https://doi.org/10.1016/j.msea.2022.144217.
» https://doi.org/10.1016/j.msea.2022.144217 -
[18] GALINDO-NAVA, E., RIVERA-DÍAZ-DEL-CASTILLO, P., “A model for the microstructure behaviour and strength evolution in lath martensite”, Acta Materialia, v. 98, pp. 81–93, 2015. doi: https://doi.org/10.1016/j.actamat.2015.07.018.
» https://doi.org/10.1016/j.actamat.2015.07.018 -
[19] BACK, J.G., SURREDDI, K.B., “Microstructure analysis of martensitic low alloy carbon steel samples subjected to deformation dilatometry”, Materials Characterization, v. 157, pp. 109926, 2019. doi: https://doi.org/10.1016/j.matchar.2019.109926.
» https://doi.org/10.1016/j.matchar.2019.109926 -
[20] RÉVÉSZ, A., UNGÁR, T., BORBÉLY, A., et al, “Dislocations and grain size in ball-milled iron powder”, Nanostructured Materials, v. 7, n. 7, pp. 779–788, 1996. doi: https://doi.org/10.1016/S0965-9773(96)00048-7.
» https://doi.org/10.1016/S0965-9773(96)00048-7 -
[21] HAJYAKBARY, F., SIETSMA, J., BÖTTGER, A.J., et al, An improved X-ray diffraction analysis method to characterize dislocation density in lath martensitic structures”, Materials Science and Engineering A, v. 639, pp. 208–218, 2015. doi: https://doi.org/10.1016/j.msea.2015.05.003.
» https://doi.org/10.1016/j.msea.2015.05.003 -
[22] ZHOU, T., FALESKOG, J., BABU, R.P., et al, “Exploring the relationship between the microstructure and strength of fresh and tempered martensite in a maraging stainless steel Fe–15Cr–5Ni”, Materials Science and Engineering A, v. 745, pp. 420–428, 2019. doi: https://doi.org/10.1016/j.msea.2018.12.126.
» https://doi.org/10.1016/j.msea.2018.12.126 -
[23] UNGÁR, T., DRAGOMIR, I., RÉVÉSZ, Á., et al, “The contrast factors of dislocations in cubic crystals: the dislocation model of strain anisotropy in practice”, Journal of Applied Crystallography, v. 32, n. 5, pp. 992–1002, 1999. doi: https://doi.org/10.1107/S0021889899009334.
» https://doi.org/10.1107/S0021889899009334 -
[24] CONG, Z., MURATA, Y., “Dislocation density of lath martensite in 10Cr-5W heat-resistant steels”, Materials Transactions, v. 52, n. 12, pp. 2151–2154, 2011. doi: https://doi.org/10.2320/matertrans.M2011201.
» https://doi.org/10.2320/matertrans.M2011201 -
[25] ZHAO, L., WANG, Q., SHI, G., et al, “The impacts of M/A constituents decomposition and complex precipitation on mechanical properties of high-strength weathering steel subjected to tempering treatment”, Journal of Materials Research and Technology, v. 23, pp. 2504–2526, 2023. doi: https://doi.org/10.1016/j.jmrt.2023.01.136.
» https://doi.org/10.1016/j.jmrt.2023.01.136 - [26] SPEICH, G., LESLIE, W., “Tempering of steel”, Metallurgical and Materials Transactions. A, Physical Metallurgy and Materials Science, v. 3, pp. 1043–1054, 1972.
-
[27] WANG, S., YU, H., ZHOU, T., et al, “Effects of non-recrystallization zone reduction on microstructure and precipitation behavior of a ferrite-bainite dual phase steel”, Materials & Design, v. 88, pp. 847–853, 2015. doi: https://doi.org/10.1016/j.matdes.2015.09.060.
» https://doi.org/10.1016/j.matdes.2015.09.060 -
[28] WANG, S., YU, H., GU, H., et al, “Effect of trace ferrite on mechanical properties of a tempered HSLA steel”, Materials Science and Engineering A, v. 744, pp. 299–304, 2019. doi: https://doi.org/10.1016/j.msea.2018.12.006.
» https://doi.org/10.1016/j.msea.2018.12.006 -
[29] KRAUSS, G., “Tempering of lath martensite in low and medium carbon steels: assessment and challenges”, Steel Research International, v. 88, n. 10, pp. 1700038, 2017. doi: https://doi.org/10.1002/srin.201700038.
» https://doi.org/10.1002/srin.201700038 -
[30] KRAUSS, G., “Tempering of martensite in carbon steels”, In: Pereloma, E., Edmonds, D. V. (eds), Phase Transformations in Steels: Diffusionless Transformations, High Strength Steels, Modelling and Advanced Analytical Techniques , Sawston, Woodhead Publishing, 2012, pp. 126–150. doi: https://doi.org/10.1533/9780857096111.1.126.
» https://doi.org/10.1533/9780857096111.1.126 -
[31] ZHENG, K., ZHANG, L., HU, C., et al, “Effect of cross-section on low-temperature fracture toughness of marine engineering steel thick plate”, Materials (Basel), v. 18, n. 5, pp. 1015, 2025. doi: https://doi.org/10.3390/ma18051015. PubMed PMID: 40077239.
» https://doi.org/10.3390/ma18051015