
 Yellow fever mortality in Brazil: an age-period-cohort study
OBJECTIVE To analyze yellow fever mortality trends in Brazil, focusing on sexes differences and using an age-period-cohort model.
METHODS This ecological study analyzed yellow fever mortality data in Brazil from 1980 to 2019 sourced from Datasus. Population estimates were retrieved from the Instituto Brasileiro de Geografia e Estatística (Brazilian Institute of Geography and Statistics). Mortality data, including age, year of death, and cause (ICD-9: 060; ICD-10: A95), were analyzed using an age period cohort model. A Poisson distribution was assumed for mortality counts, and analyses were conducted using Holford’s method and its adaptations on R.
RESULTS The results show that the incidence rate peaked at younger ages, such as 30 years (0.010/100,000 individuals, 95%CI: 0.008/100,000 to 0.013/100,000), followed by a gradual declining trend with increasing age, reaching 0.007/100,000 individuals (95%CI: 0.005/100,000 to 0.010/100,000) at 50 years onward. Regarding period, a substantial increase in the adjusted hazard ratio occurred over time, especially in 2015 (13.923 [95%CI: 11.095 to 17.471]), suggesting a significant elevation when compared with previous periods. Cohort analysis showed a trend of increasing risk until 1960 (RR = 1.000), followed by a marked reduction for more recent cohorts, such as 2010: RR = 0.056 (95%CI: 0.028 to 0.112). Vaccination analysis showed alternating periods of significant increases and decreases in vaccination rates.
CONCLUSIONS Younger individuals showed higher mortality rates, with a gradual decline with advancing age. Period effects highlighted a pronounced resurgence in recent years, particularly during the 2015 epidemic, underscoring the influence of temporal factors such as outbreaks and vaccination campaigns. Cohort analysis showed a progressive decline in mortality risk among more recent birth cohorts, likely reflecting the impact of expanded immunization programs and improved public health measures. The proposed yellow fever vaccination trends in Brazil may explain some of the observed patterns.
DESCRIPTORS
Yellow Fever; Mortality; Brazil
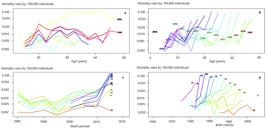 Thumbnail
 Thumbnail
 Thumbnail
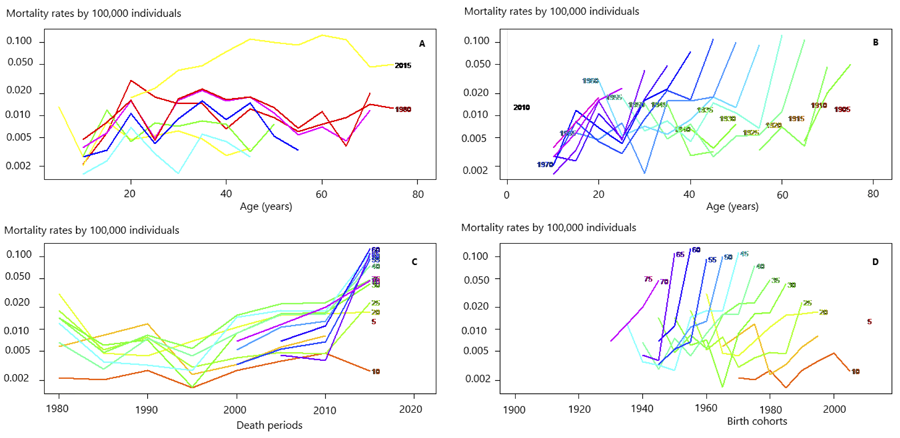 YF: yelow fever. Source: Departamento de Informação e Informática do Sistema Único de Saúde (Datasus).Note: in
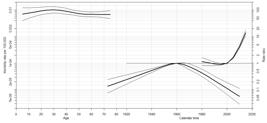
 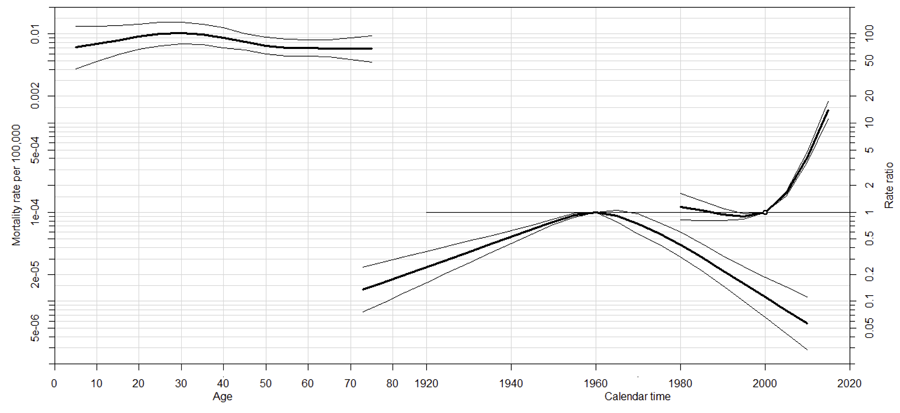 Source: Departamento de Informação e Informática do Sistema Único de Saúde (Datasus). Note: the figure shows, in the upper and left corner, the mortality rates by 100,000 individuals, expressed in the left y-axis for each age group represented in the x-axis. The right lower corner shows the rate ratio in the right y-axis (which expresses a specie of relative risk for birth cohorts) and the x-axis represents periods. The biggest parable represents the births cohorts and the smallest, the period.
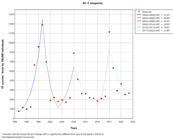
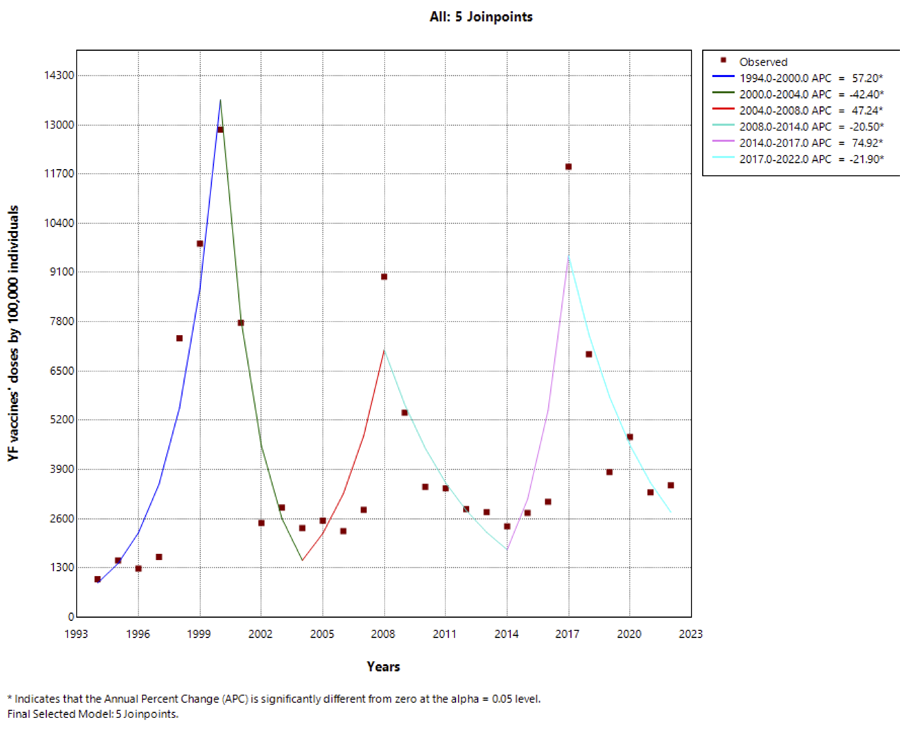 APC: annual percentage change; YF: yellow fever. Source: Departamento de Informação e Informática do Sistema Único de Saúde (Datasus). Note: The figure represents the samples of YF vaccines that were applied for each 100,000 Brazilian individuals in the y-axis for each year in the x-axis. Each square represents a graph point and the lines indicate the observed trends throughout the period.