 Enhancing small-object detection in vineyards: a YOLOv8-based approach for grape maturity classification
ABSTRACT:
‘Kyoho’ grapes are renowned worldwide for their excellent fresh food quality. Determining the optimal time to pick grape bunches based on maturity is an important factor in ensuring their quality. However, the maturity of grape bunches in complex grape garden environments is easily affected by many factors. This paper proposes a grape maturity detection method based on You Only Look Once version (YOLOv) 8. The model's performance was improved by introducing a small object detection layer and replacing the faster implementation of the cross-stage partial bottleneck with 2 convolutions (C2f) module and the re-parameterized visual geometry group (RepVGG) module in the YOLOv8 network. A total of 1581 ‘Kyoho’ grape images were taken on-site with a mobile phone and divided into four maturity levels. Through ablation experiments, YOLOv8, adding a small object detection layer (YOLOv8-Head), replacing the C2f module with the RepVGG module (YOLOv8-Rep), and adding a small object detection layer and replacing the RepVGG module (YOLOv8-Rep-Head) were used for model training. The experimental results showed that the mean average precision 0.5 (mAP0.5) of the YOLOv8-Rep-Head model reaches 0.927, which is higher than 0.870 of YOLOv8, 0.880 of YOLOv8-Head, and 0.917 of YOLOv8-Rep. The precision (P) and recall (R) rates reached a high level, 0.902 and 0.861, respectively, and the balanced F (F1) score also increased to 0.88, registering the best performance of all the models. The experimental results show that the YOLOv8-Rep-Head model can accurately detect the maturity of ‘Kyoho’ grape bunches, provide reference significance for the intelligent picking of ‘Kyoho’ grape bunches, and have a positive impact on improving the commercial rate of ‘Kyoho’ grapes.
Keywords:
computer vision; deep learning; precision agriculture
Introduction
In agriculture, grapes hold an important position in the fruit market. The determination of grape maturity mainly includes manual observation and mechanical device judgment (Li et al., 2011; Pathange et al., 2006), chemical composition analysis (Al-Kaisy et al., 1981; Le Moigne et al., 2008; Perestrelo et al., 2018), spectral analysis (Muncan et al., 2022; Shah et al., 2020), and traditional machine learning (Galal et al., 2022; Armstrong et al., 2023; Knott et al., 2023; Benelli et al., 2021; Bazinas et al., 2022), etc.
In recent years, convolutional neural networks (CNN) have gradually been applied to determine the maturity of grapes. A novel multi-input multi-output CNN model that uses a multi-head attention mechanism to identify the spectral region of interest was proposed by Kalopesa et al. (2023). The maturity of Assyrtiko grapes was studied by Badeka et al. (2023). A Sunshine Rose grape maturity detection model based on an improved You Only Look Once version (YOLOv) 3 was proposed by Wei et al. (2023). In the backbone network of YOLOv5 small (s), a dynamic snake convolution was used, and a dual-channel feature-extraction attention module was added by Wang et al. (2024).
To broaden our research perspective, we referred to several cutting-edge studies in computer vision. The cycle generative adversarial networks (GAN) model was improved by Wu et al. (2024), significantly enhancing accuracy and balanced F (F1)-score under YOLOv7 testing. YOLOv5s was optimized by Gao et al. (2024), achieving 92.08 % precision (P) and 92.75 % mean average precision (mAP) in tomato detection. MobileViT-Large selective kernel-GSConv-YOLO, a model based on YOLOv8 nano (n) that integrates mobile vision transformer (MobileViT) and red-green-blue-depth (RGB-D) for 3D winter jujube localization, was proposed by Yu et al. (2024). Adaptive multi-scale YOLO was developed by Yuan et al. (2024) with a multi-grained adaptive feature enhancement module and refined bidirectional feature pyramid network modules, which boosted multi-scale ship segmentation performance.
In our previous research (Li et al., 2023), we improved mask region-CNN (R-CNN) for segmenting ‘Kyoho’ grapes and detecting maturity. However, it struggled with small, blurred, or distant targets. The existing literature lacks targeted improvements for small grape detection. Thus, this paper focused on relevant enhancements and experiments.
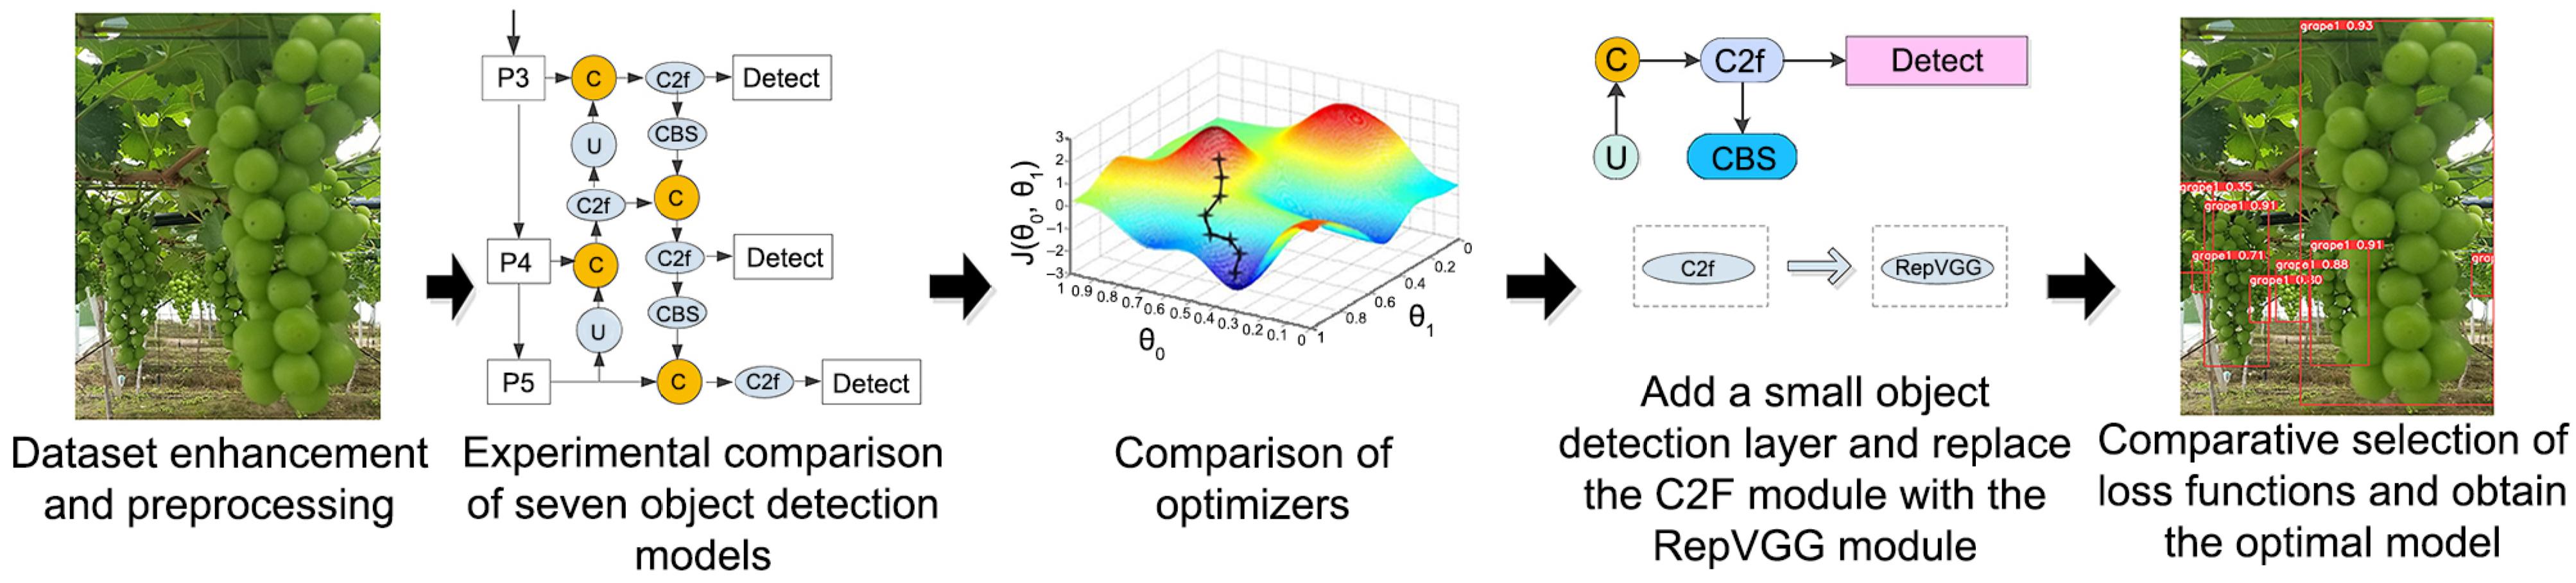
Innovatively, this study proposed the YOLOv8 adding a small object detection layer and replacing the RepVGG module (YOLOv8-Rep-Head) model to improve grape maturity detection under small targets and complex backgrounds. A small target detection layer enhances long-distance detection using high-resolution pyramid 2 (P2) features, while the re-parameterized visual geometry group (RepVGG) module strengthens feature extraction. Compared with YOLOv8, the model significantly boosts P, recall (R), and mAP. It offers a robust solution for detecting orchard grape maturity. The overall framework is shown in Figure 1.
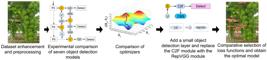
Overall framework for the method we propose in this paper. P3 = pyramid 3; P4 = pyramid 4; P5 = pyramid 5; C = concat; U = upsample; C2f = faster implementation of the cross stage partial bottleneck with 2 convolutions; CBS = convolution, batch normalization, and sigmoid linear unit; RepVGG = re-parameterized visual geometry group.
Materials and methods
Experimental dataset
In this experimental study, we conducted in-depth discussions with grape planting experts and fruit farmers on maturity classification standards. We also referred to the research on ‘Kyoho’ grape maturity by Qiu et al. (2022). ‘Kyoho’ grapes are categorized into maturity levels based on bunch appearance and color characteristics.
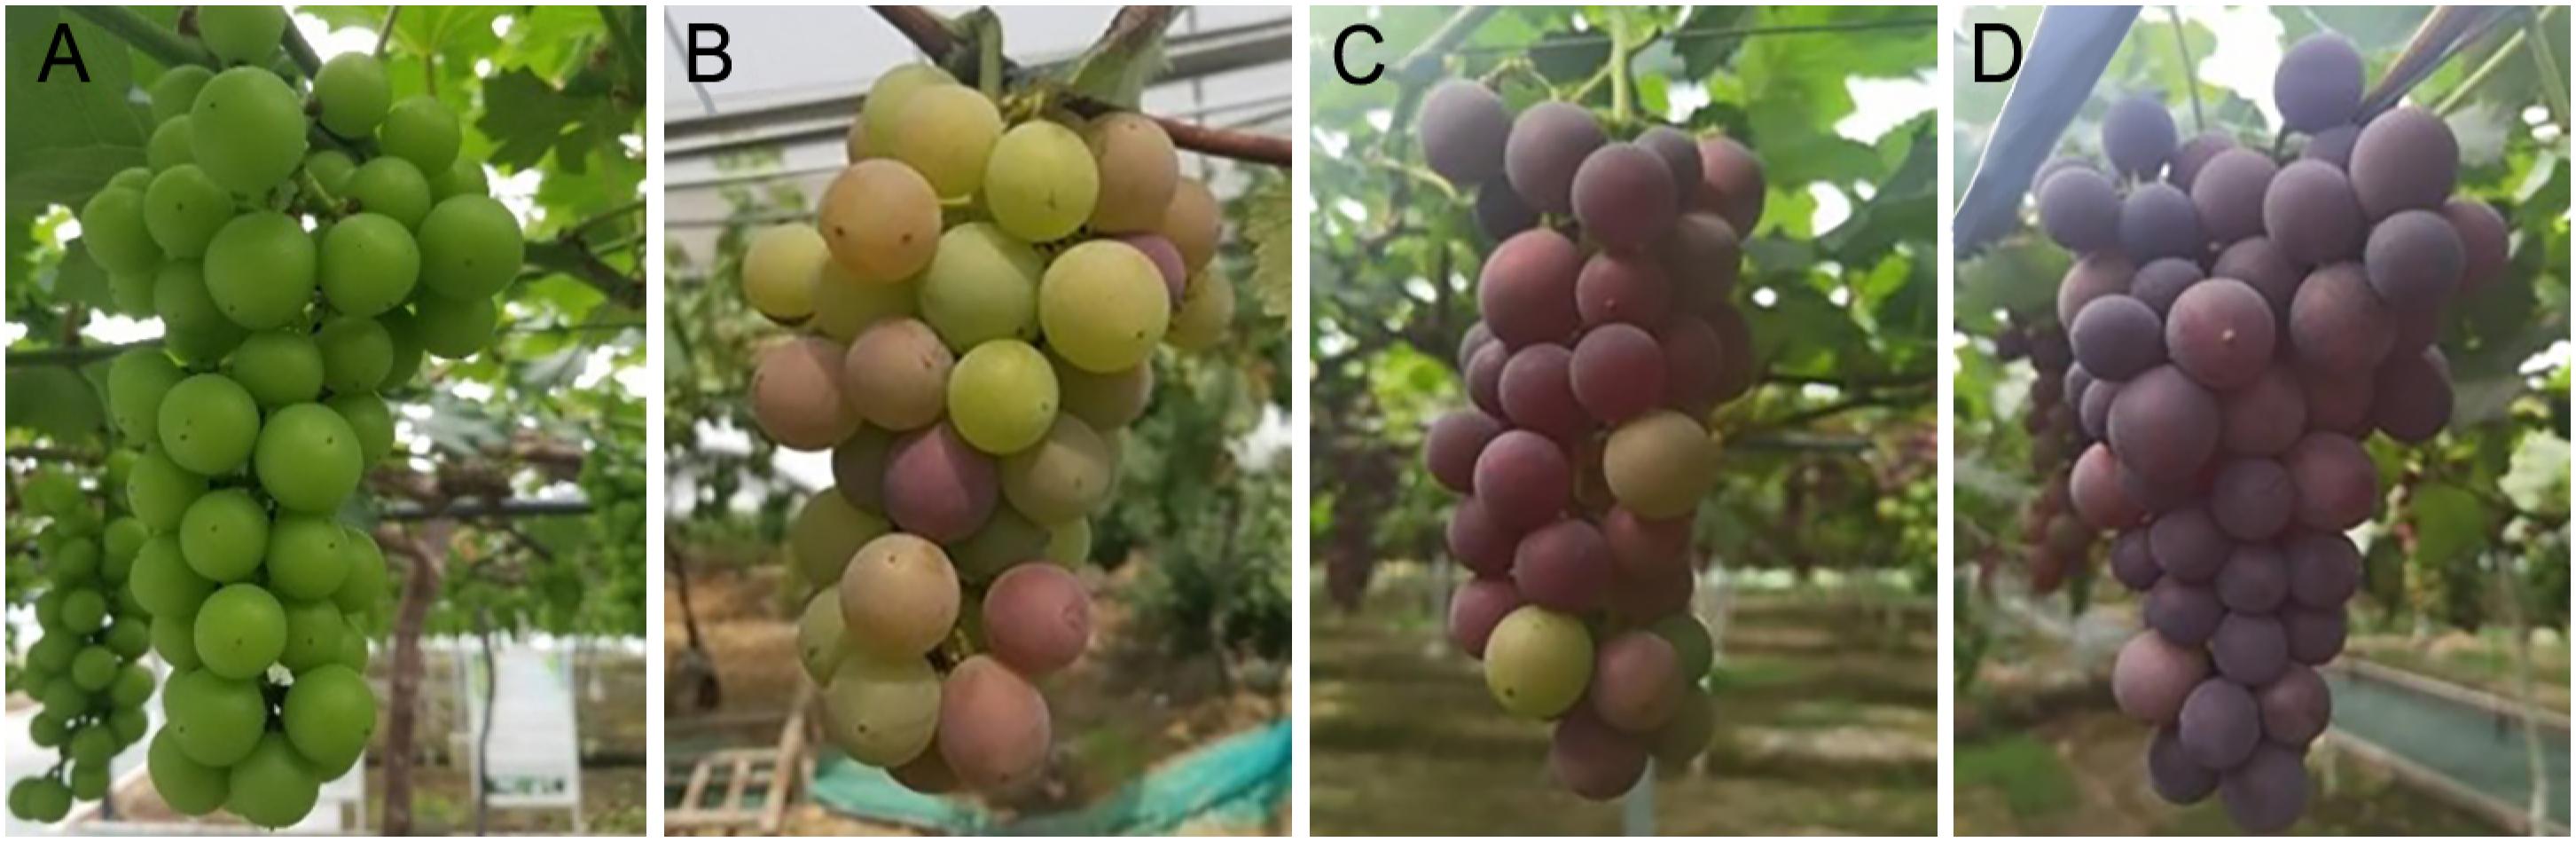
After discussion and analysis, the maturity of the ‘Kyoho’ grape bunches was divided into four levels, namely: maturity I, II, III, and IV. Maturity I is the unripe stage, and all ‘Kyoho’ grape berries are green; maturity II is the transition stage, in which a small part of the grape berries begins to change from green to purple, but most of them are green; maturity III is the stage of maturity in which most of the grape berries are purple, and a small part is green; maturity IV is the mature stage when the ‘Kyoho’ grape berries have completely turned purple, as shown in Figure 2.
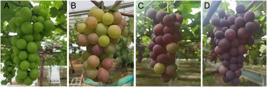
Mature morphology of ‘Kyoho’ grape at different periods. Scale bars (image data: real grape bunches) 1:6, A) Maturity level I, B) Maturity level II, C) Maturity level III, and D) Maturity level IV.
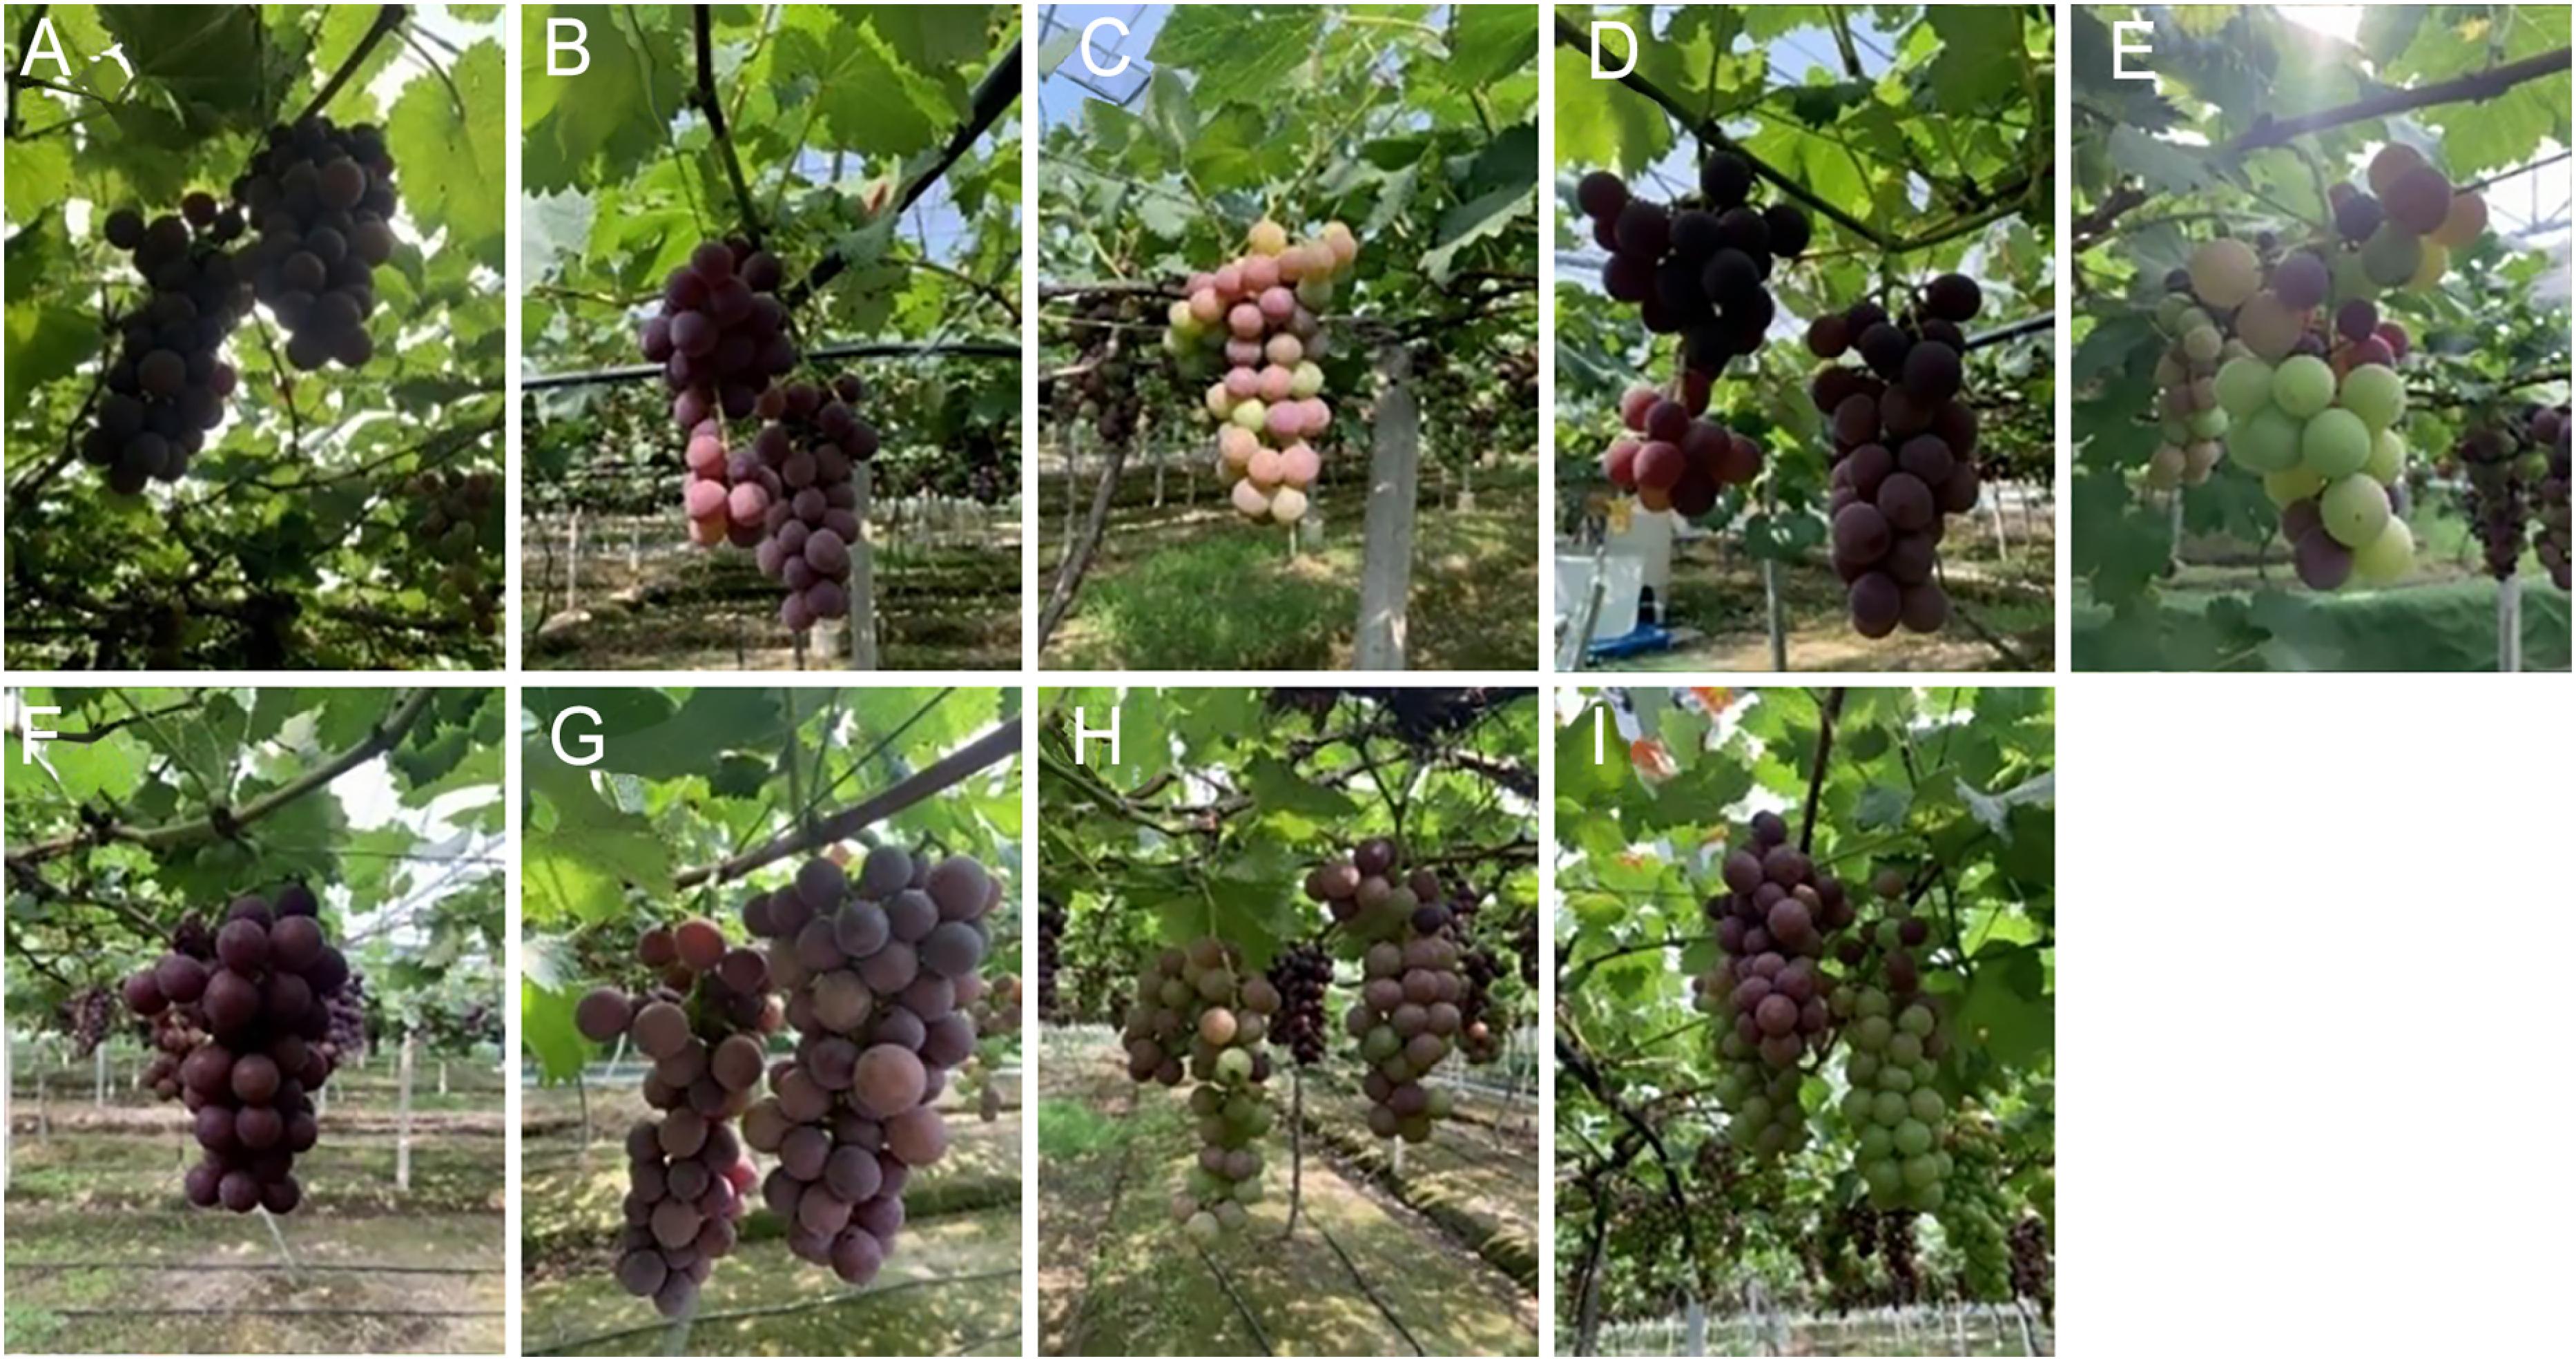
To ensure the dataset fully covers the various situations encountered in real orchards, we carefully classified the images. Specifically, we considered three key factors: lighting conditions, degree of obstruction, and grape cluster density. Regarding lighting conditions, the dataset includes images across various scenarios, including backlighting, side lighting, and natural lighting. Image under backlight conditions simulate the situation where grapes are located behind the light source, and light shines from behind; images under lateral lighting conditions reflect the scene where light shines on grapes from the side; images under natural light conditions show the appearance characteristics of grapes under normal lighting conditions. For the occlusion degree, we collected images with no occlusion, mild occlusion, and severe occlusion. The unobstructed image shows the ideal situation where the grapes are completely visible; the lightly occluded image reflects the situation where the grape is partially obscured by a small number of branches and leaves; the heavily occluded image reflects the actual situation where grapes are obstructed by more branches and leaves in complex orchard environments. This classification method can effectively capture grape features under different degrees of occlusion, helping the model learn better and adapt to diverse scenes in real orchards. Regarding grape cluster density, the dataset includes images with low, medium, and high densities. The low-density image shows sparse grape clusters, with clear intervals between fruits; the medium-density image reflects a relatively uniform, moderately dense distribution of grape clusters and fruits; the high-density image displays a dense, tightly arranged arrangement of grape clusters and fruits. This classification method can comprehensively capture the characteristics of grape clusters across different densities, helping the model learn visual features under different densities and improving its recognition ability in real orchard environments. The classification situation is shown in Figure 3.
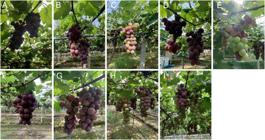
Lighting conditions, occlusions, and grape bunch densities found in real orchards. A) Backlighting, B) Side lighting, C) Natural lighting, D) No occlusion, E) Mild occlusion, F) Severe occlusion, G) Low grape cluster densities, H) Medium grape cluster densities, and I) High grape cluster densities.
By including images with different lighting conditions, occlusion levels, and grape cluster densities, we believe this dataset can, to some extent, reflect the diverse scenes in real orchards. This helps the model learn grape features across different conditions during training, thereby improving its generalization ability and robustness in practical applications. Of course, in future studies, we will continue to strive to expand the dataset's size and diversity further enhance the model's performance and adaptability.
The dataset used in this paper contains 1581 images. All the ‘Kyoho’ grape images are from the ‘Kyoho’ grape base in Pujiang, Jinhua, Zhejiang Province, China (29°26’25" N, 119°54’51" E, altitude 62 m). The images show grape clusters at different shooting distances, which are more in line with the grape growth conditions in natural environments. In the experiment, a mobile phone camera was used to obtain the RGB image of the ‘Kyoho’ grape cluster, with a pixel resolution of 3072 × 4096 (3:4).
Image preprocessing is used for data enhancement. Given the complex environmental conditions, the position of the grape cluster may significantly affect the results. Therefore, this study used image flipping to enhance the data. The dataset was preprocessed using vertical and horizontal flipping. It can more comprehensively display the characteristics of the ‘Kyoho’ grape dataset, thereby enhancing the network's feature learning and improving image quality, thereby increasing the accuracy of maturity discrimination.
The size of the dataset has significant effects on neural network training (Lu et al., 2021). To make the model more robust, in addition to horizontal and vertical flipping of the original grape images, the mosaic data enhancement method from YOLOv8 is also used to further improve performance and robustness. The dataset used in this study is divided into a training set, a test set, and a validation set at a ratio of 6:3:1. The images contain ‘Kyoho’ grape bunches at four maturity levels (I-IV).
YOLOv8 Network
Let's briefly review the development history of the YOLO series of algorithms. YOLOv1 is the starting point of single-stage detection. For the first time, target detection is treated as a regression problem, directly predicting bounding-box coordinates and category probabilities (Redmon et al., 2016). YOLOv2 (Redmon and Farhadi, 2017) introduces Anchor Boxes and BatchNorm to enhance detection capabilities. YOLOv3 (Redmon and Farhadi, 2018) uses the Darknet-53 backbone network, combines a feature pyramid network to use multi-scale features to improve detection results, introduces logistic regression to replace Softmax, and supports multi-label classification. YOLOv4 (Bochkovskiy et al., 2020) introduces cross stage partial darknet (CSPDarknet), mish activation, path aggregation network (PANet), and mosaic enhancement. CSPDarknet reduces computational costs while maintaining performance, Mish activation improves gradient flow, PANet enhances feature fusion, and Mosaic enhancement increases data diversity. YOLOv5 provides pre-trained models nano/small/medium/large/xlarge (n/s/m/l/x), introduces PyTorch implementation, and supports one-click training and deployment. YOLOv6 (Li et al., 2022) uses the EfficientRep backbone network and a RepBlock-PANet neck structure, introduces the Similarity Intersection over Union loss function, and optimizes the bounding box regression accuracy. YOLOv7 further improves efficiency by expanding the efficient layer aggregation network (ELAN) and re-parameterizing convolution (Wang et al., 2023). YOLOv8 adopts a new backbone, replacing the cross-stage partial network with 3 convolutions (C3) in YOLOv5 with a faster implementation of the cross-stage partial bottleneck with 2 convolutions (C2f), and achieves further lightweight performance, using Anchor-Free for the first time, thereby simplifying the detection process. YOLOv8 is faster and more accurate, and supports multiple tasks, including target detection, instance segmentation, and posture estimation. It has real-time detection ability while maintaining high accuracy and can process high-resolution images. YOLOv8 introduces Anchor-Free point detection, which is better suited for detecting small grape targets. In addition, through comparative experiments, we found that YOLOv8 had the best overall performance. Thus, we chose YOLOv8 as the basic model.
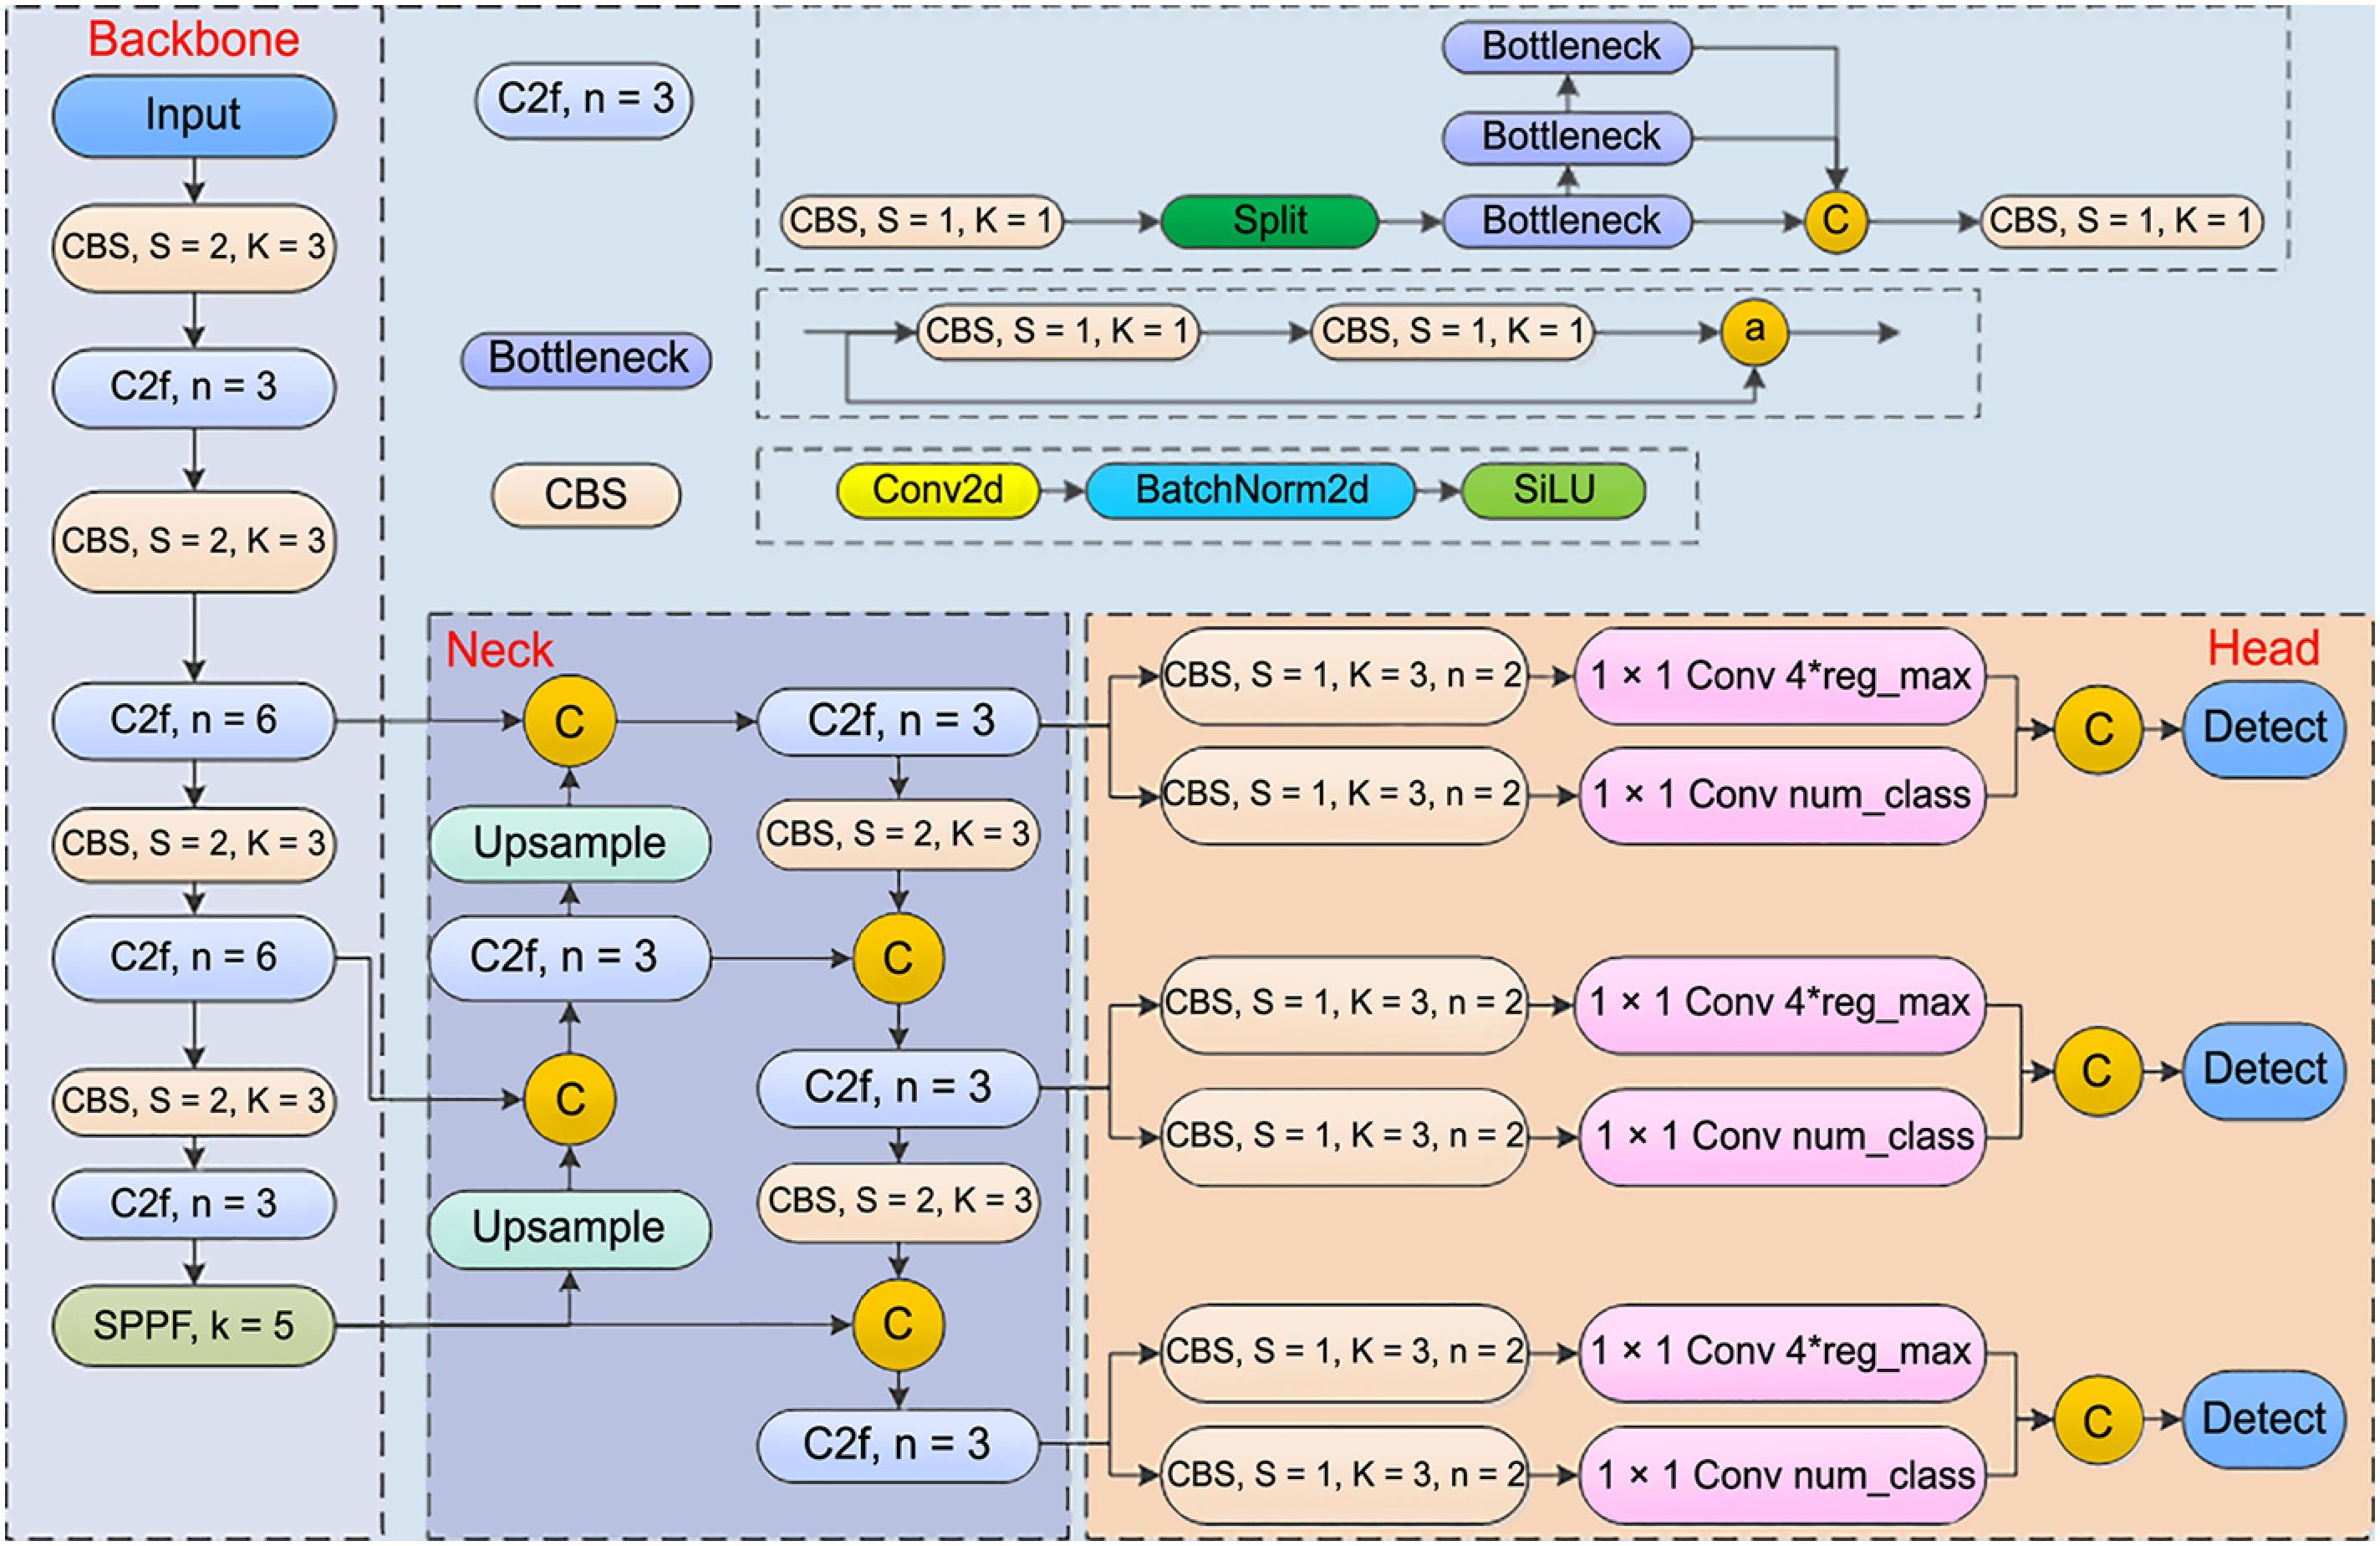
You Only Look Once version 8 not only inherits the excellent performance of its predecessors but also achieves revolutionary breakthroughs in speed and computing cost (Lou et al., 2023). It consists of a backbone, neck, and head, as shown in Figure 4. Considering the requirements for real-time performance and stability in practical applications, this paper selected YOLOv8n for target detection.
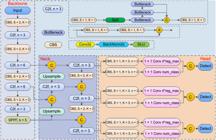
You Only Look Once version 8 network structure diagram. CBS = convolution, batch normalization, and sigmoid linear unit; C2f = faster implementation of the cross stage partial bottleneck with 2 convolutions; S = stride; K = kernel; n = number; SPPF = spatial pyramid pooling - fast; C = concat, a = addition; Conv2d = 2D convolutional layer; BatchNorm2d = 2D batch normalization; SiLU = sigmoid linear unit; Conv = convolution; reg_max = regression maximum; num_class = number of classes.
The backbone consists of convolution-batch normalization-sigmoid linear unit modules, C2f, and spatial pyramid pooling-fast modules. The C2f module combines the C3 structure of YOLOv5 and the ELAN structure of YOLOv7, maintaining the module's lightweight nature while providing richer gradient flow information, thereby achieving higher accuracy.
YOLOv8 Network Improvements
Small object detection layer
Small-target detection is an important technology in image recognition and computer vision. It can identify small targets in images, such as faces, gestures, and crop production. This is very important for security monitoring, unmanned driving, agricultural intelligence, and other fields.
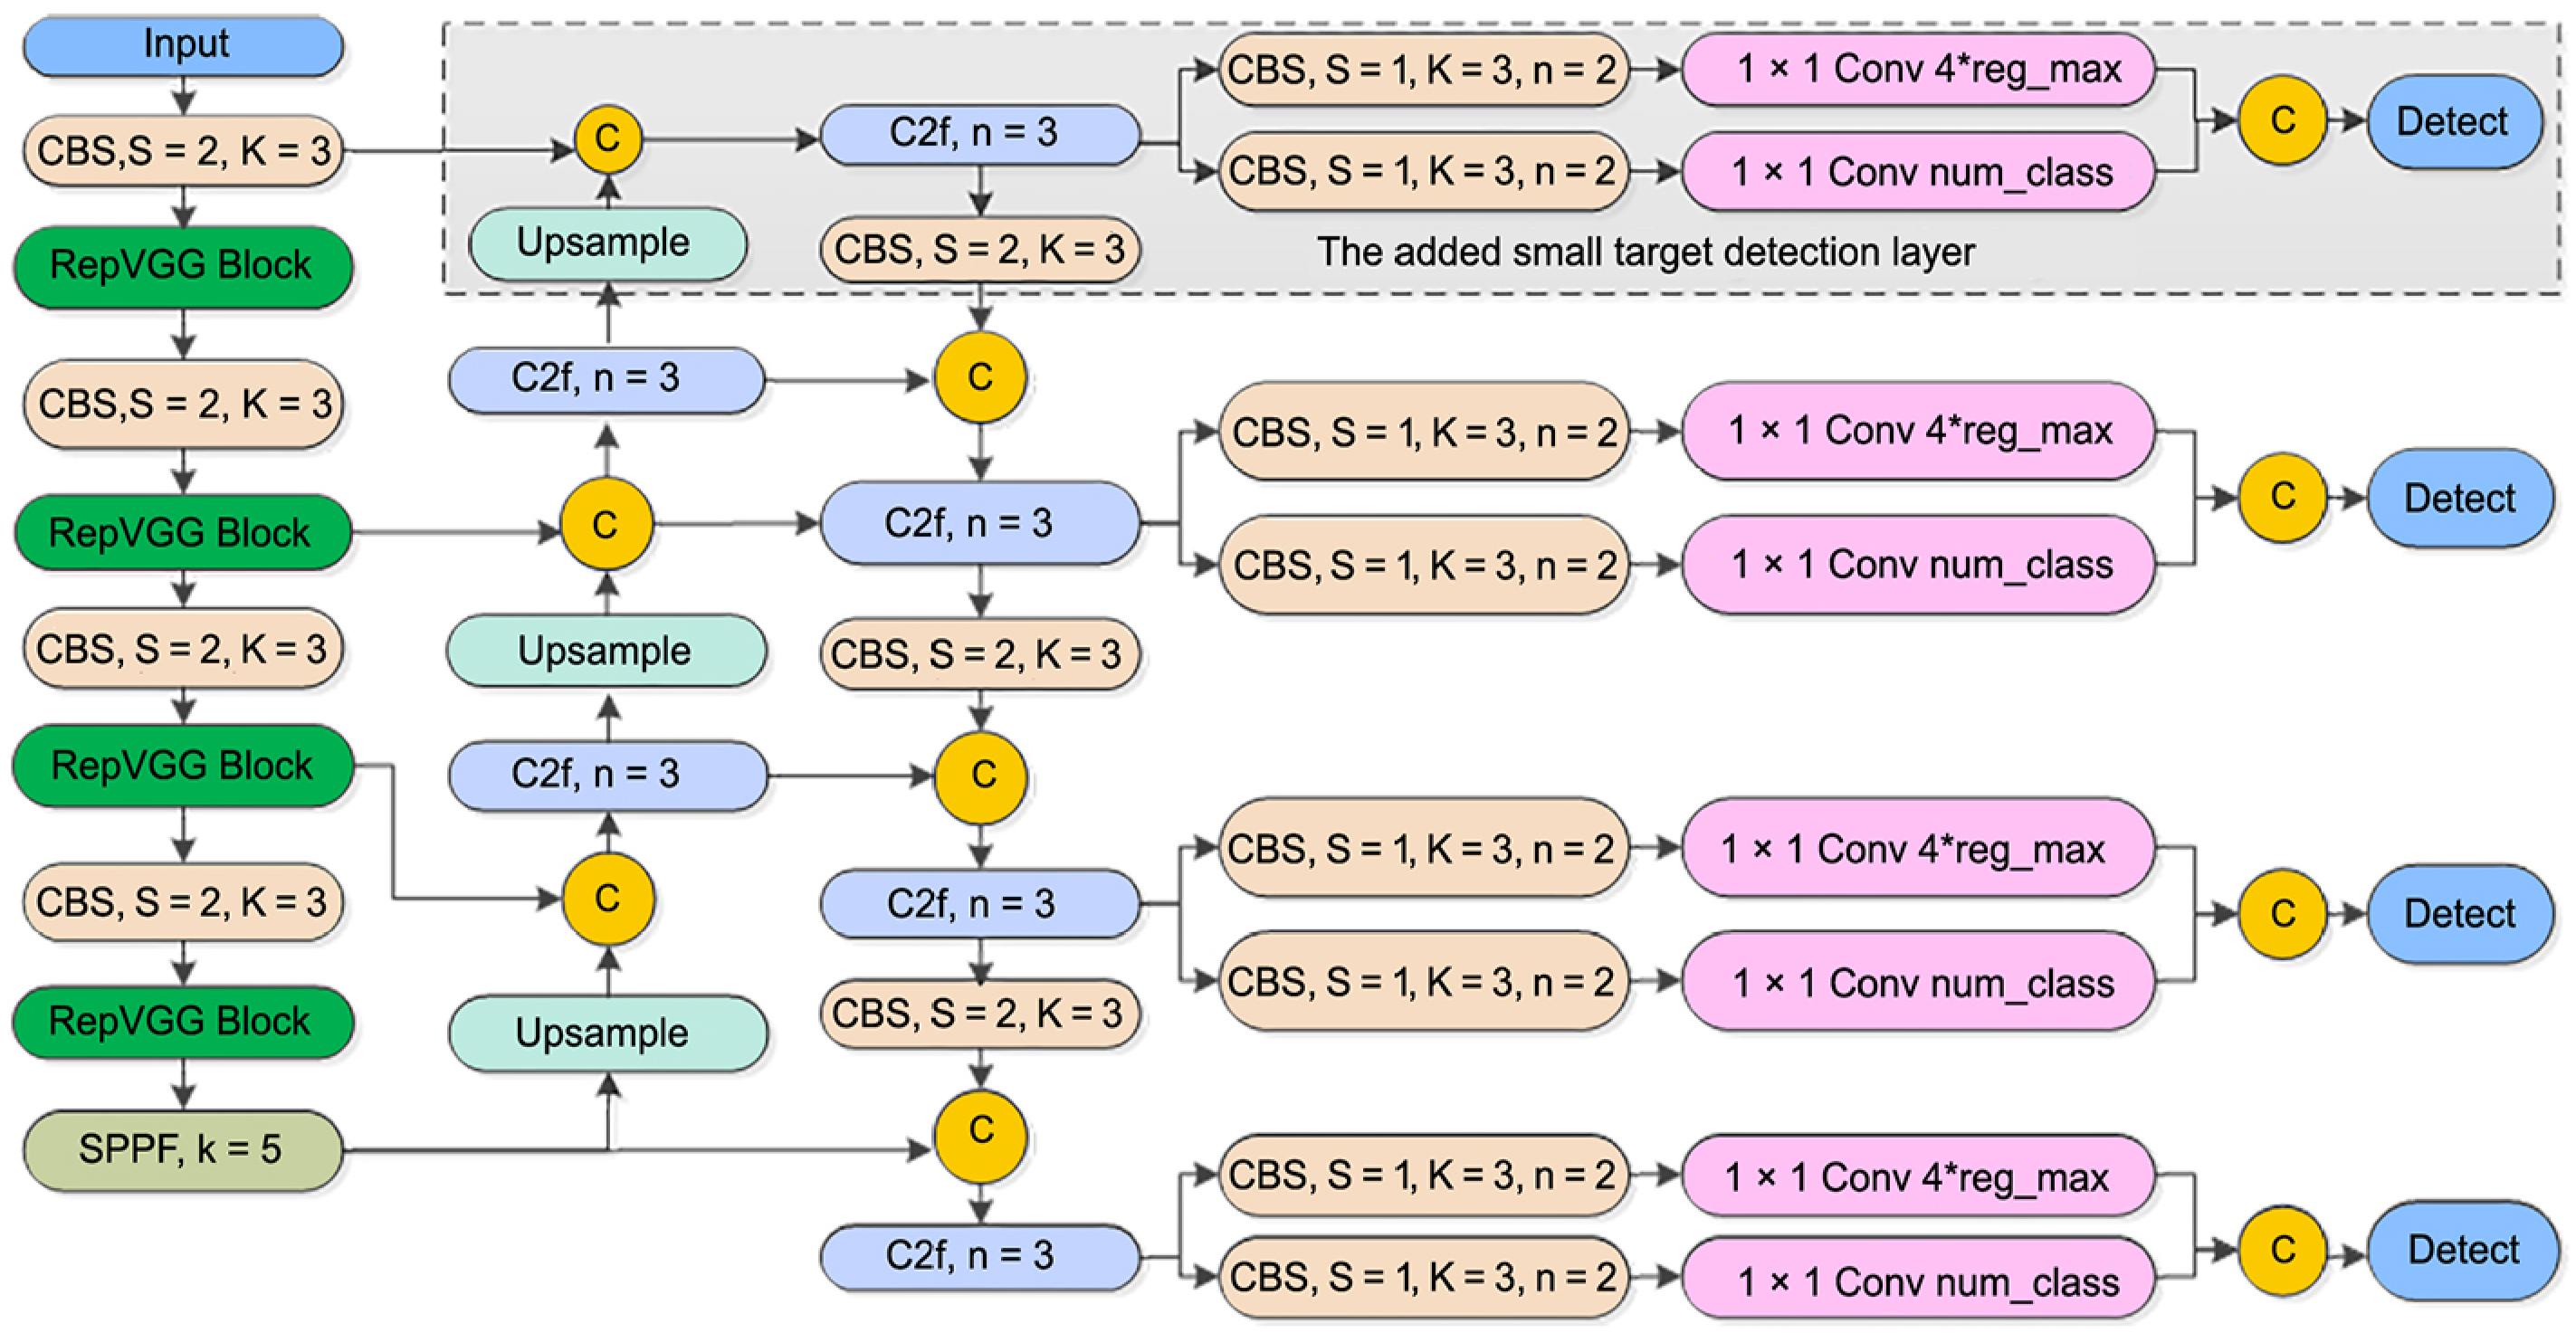
In the traditional YOLOv8 algorithm, owing to the small size of small target samples and the large down-sampling factor, it is difficult for the deeper feature map to learn the feature information of small targets, and their detection performance is poor, especially for targets with blurred backgrounds. To improve the detection of small targets, this experiment introduces a new detection head using P2-layer features in the YOLOv8 model. The P2-layer is located at the front end of the network, and its output feature map has a higher resolution, enabling it to capture more detailed information. The principle of the small target detection layer is that some coarse-grained information can be retained in the current image, and adding a small target detection layer to the P2-layer enriches the underlying feature information of the target. Moreover, the two P2-layer features obtained from top to bottom and bottom to top in the neck network are fused with the same-scale features in the backbone network, and the output features are the fusion results of the three input features. Consequently, the P2-layer detection head can detect small targets quickly and effectively and, the YOLOv8 algorithm is thus improved.
RepVGG module
The RepVGG network structure was proposed by Ding et al. (2021). The 3 × 3 convolution of the VGG network was reconstructed, and an additional 1 × 1 convolution and a residual branch were added. The training and inference structures were decoupled via reparameterization. A complex multibranch topology was used during training, and it was transformed into a feedforward network structure similar to VGG during inference. It combines the strong feature-extraction capability of the residual network (ResNet) architecture with the low memory usage of the VGG architecture, which can better extract target features and thereby improve detection accuracy. The RepVGG module enhances the model's representation capability by learning convolution kernel size and step size, enabling the network to better adapt to different input sizes and data distributions and thereby improving generalization. The RepVGG module uses a lightweight residual connection method, that effectively alleviates gradient vanishing and training difficulties, thereby improving the model's performance and stability. The RepVGG module also offers higher computational efficiency and fewer parameters, making the model lighter and more efficient.
Improvement strategies
To address the specific needs of ‘Kyoho’ grape detection in the natural environment of a grape orchard, this study further optimized YOLOv8. The improved structure is shown in Figure 5.
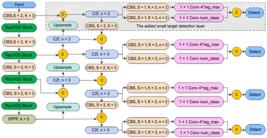
Part of the improved network structure. CBS = convolution, batch normalization, and sigmoid linear unit; C2f = faster implementation of the cross stage partial bottleneck with 2 convolutions; S = stride; K = kernel; n = number; SPPF = spatial pyramid pooling - fast; C = concat; Conv = convolution; reg_max = regression maximum; num_class = number of classes.
In a complex orchard environment, the shooting distance of grapefruits is far, resulting in a small size of a single grape bunch in the image and a blurred background, which increases detection difficulty. The traditional YOLOv8 algorithm uses a large down sampling factor for small targets, making it difficult for the deep feature map to learn their features and leading to poor small target detection. The small-target detection layer introduces P2-layer features and uses its high-resolution output feature map to capture more detailed information, thereby effectively improving the detection of small targets. By fusing top-to-bottom and bottom-to-top P2-layer features in the neck network with the same-scale features in the backbone network, the model's detection performance for small targets is further enhanced. Although the C2f module of YOLOv8 performs well at feature extraction, it still has room for improvement when handling complex backgrounds and variable target shapes. The RepVGG module combines the strong feature extraction capabilities of ResNet with the low memory usage of VGG, enabling better extraction of target features and thus improving detection accuracy. The RepVGG module enhances the model's feature expression capabilities by learning convolutional kernel sizes and strides, enabling it to better adapt to different input sizes and data distributions and to improve generalization and detection performance. The small object detection layer and the RepVGG module address two main challenges of YOLOv8: detecting small objects and handling blurred and occluded objects in an orchard environment. The small object detection layer improves the model's detection effect on small grape bunches photographed at a distance by enhancing its ability to capture small object features; while the RepVGG module improves the model's adaptability to complex backgrounds and variable object shapes by improving its feature extraction mechanism.
Experimental results show that combining these two modifications not only improves the model's detection accuracy and R rate but also significantly enhances its grape maturity detection performance in an orchard environment, making it more robust and reliable in practical applications.
Model evaluation metrics
This experiment uses the R, P, average precision (AP), mean average precision 0.5 (mAP0.5), F1 score, and precision-recall (PR) curve as indicators to evaluate the performance of different models, where the AP and mAP represent the average detection accuracy of a certain type of detection object and the average multicategory detection accuracy, respectively.
Recall is an evaluation indicator in classification problems, representing the proportion of correctly predicted positive samples among the actual positives. In Eq. (1), TP represents the number of correct categories predicted as correct categories, and FN represents the number of correct categories predicted as negative categories.
where P is an evaluation indicator in classification problems and represents the ratio of the number of samples correctly predicted as positive examples to the number of all samples predicted as positive examples. In Eq. (2), FP represents the number of negative categories predicted as correct categories.
where AP represents the average detection accuracy of a certain type of detected object. The specific calculation method is given in Eq. (3).
where mAP stands for the mean average precision, which represents the average mAP at different intersection over union (IoU) thresholds. The IoU is the intersection over union ratio between the result detection value and the true value of the labeled sample. When the intersection-over-union ratio is not less than the specified threshold, the object is considered a predicted target. mAP is the average accuracy of all categories. As shown in Eq. (4), n is the number of target categories in the dataset, and i represents a specific category.
where mAP0.5 is the average AP value when the IoU threshold is 0.5, n represents the number of target types, AP0.5i is the average accuracy of the i-th target when the IoU threshold is 0.5, and its calculation formula is shown in Eq. (5):
The F1 value, also known as the F1 score, is a comprehensive indicator used to evaluate the performance of a classification model. Its calculation method is given in Eq. (6). The F1 value comprehensively considers the P and R of the model and is calculated by multiplying these them and dividing the product by their sum.
Frames per second (FPS) is an important indicator of a model's inference speed, reflecting the number of images it can process per second. As shown in Eq. (7), N is the total number of images processed by the model, and T total is the total time taken to process them.
In addition, the PR curve is used to further evaluate the performance of target detection. The ordinate of the PR curve is P, and the abscissa is R. When the R and P values on the curve are equal, the balance point on the PR curve has been reached. At this time, the target detection model's performance is better, and the entire PR curve is closer to the upper-right corner.
Results
Performance comparison and analysis of commonly used target detection network models
First, the commonly used target detection networks Mask R-CNN, Faster R-CNN, exceeding YOLO (YOLOX) Series in 2021, YOLOv4, YOLOv7, YOLOv8, and YOLOv11 were experimentally compared.
This experiment ensures that all the models are trained on the same dataset and evaluated on the same test set. This ensures the objectivity and accuracy of the experimental results and avoids the influence of different datasets or experimental environments. After the experiment and evaluation, the target-detection results are compared in Table 1.
As shown in Table 1, the P of Faster R-CNN is 0.850, but the R rate is only 0.764, and the mAP0.5 is 0.815. Its FPS is 16.88, indicating it is relatively slow due to its complex structure. The P of Mask R-CNN is 0.872, the R rate is 0.774, and the mAP0.5 is 0.843. Its FPS is 17.74. Compared to Faster R-CNN, Mask R-CNN shows a certain improvement in mAP0.5. In the YOLO series, YOLOX has a P of 0.809, but its R rate is only 0.541, and its mAP0.5 is relatively low at 0.671. Its FPS is 125.80. The YOLOv4 network model has a P of 0.835, an R of 0.566, an mAP0.5 of 0.717, and an FPS of 83.02. Compared to YOLOX, YOLOv4 shows improvements in all indicators. YOLOv7 has a P of 0.752, an R of 0.828, an mAP0.5 of 0.848, and an FPS of 92.07. Its R rate stands out within the YOLO series. YOLOv8 achieves a P of 0.830, an R rate of 0.800, and an mAP0.5 of 0.870, with an FPS of 128.64. It demonstrates remarkable improvements in both P and R rate. YOLOv11 has a P of 0.832, an R of 0.805, an mAP0.5 of 0.881, and an FPS of 120.92, showing slight enhancements over YOLOv8. In summary, YOLOv8 and YOLOv11 exhibit the best balance of P, R rate, and speed in the YOLO series. Although YOLOv8 and YOLOv11 have similar overall performance, this study chose YOLOv8 as the baseline model, primarily due to its greater maturity and engineering feasibility. YOLOv8 has been widely applied and validated in multiple practical scenarios, with stable inference performance and good open-source community support. It has obvious advantages in document integrity, deployment tool chain, and third-party compatibility. In addition, the YOLOv8 model structure is clearer, with good scalability and controllability, which is helpful for subsequent module transformation and customized development.
Comparison and analysis of model performance with different optimizers
This experiment compares different optimizers: adaptive moment estimation (Adam), Adam with decoupled weight decay (AdamW), and stochastic gradient descent (SGD). Adam is suitable for situations where fast convergence is required, and a certain tolerance for memory consumption is acceptable. AdamW is better suited to scenarios involving large datasets. SGD is suitable for situations where computing resources are limited and data noise is insensitive.
When the other parameters are the same, the model with SGD as the optimizer has the best performance, with a P of 0.830, an R of 0.800, a mAP of 0.5 to 0.870, and an F1 value of 0.81, as shown in Table 2. The mAP0.5 is 0.031 and 0.073 higher than those of Adam and AdamW, respectively, and the F1 is 0.08 and 0.05 higher than those of Adam and AdamW, respectively. The Adam optimizer performs worse than AdamW and SGD across various evaluation metrics, which may be due to it having more hyperparameters than SGD; thus, its performance is also affected to a certain extent. The AdamW optimizer has higher evaluation indicators than the Adam for R, mAP0.5, and F1, and only P is slightly lower. It may be that AdamW has improved the weight decay based on Adam, which has a certain optimization effect.
The SGD optimizer outperforms Adam and AdamW across all evaluation metrics and significantly outperforms the other two optimizers on P, R, and F1. Although it is comparable to AdamW in terms of R, the SGD optimizer performs best across various evaluation indicators. The SGD optimizer was selected for subsequent experiments.
Ablation experiment
To better detect and reflect the robustness of the model, ablation experiments were conducted using YOLOv8, YOLOv8 with a small target detection layer (YOLOv8-Head), YOLOv8 with the C2f module replaced by the RepVGG module (YOLOv8-Rep), and YOLOv8 with a small target detection layer and replaced by the RepVGG module (YOLOv8-Rep-Head). A total of four groups of experiments were conducted to compare model performance.
The P of YOLOv8 in the experiment is 0.830, the R rate 0.800, the mAP0.5 0.870, and the F1 score 0.810, as shown in Table 3. These indicators serve as a baseline and provide a basis for comparison for subsequent improvements. First, the YOLOv8-Head model with only a small target detection layer added was analyzed. Compared with the original YOLOv8, the P of YOLOv8-Head improved to 0.841, whereas the R rate slightly decreased to 0.791. The main reasons include: although the small object detection layer enhances the small object detection ability, its ability to detect grape clusters with fuzzy boundaries or unclear features was slightly reduced, making the model more inclined to avoid false positives; optimizing the feature fusion mechanism has not only improved the accuracy of small object detection, but has made the detection standards for complex scenes more stringent. Extreme situations in the dataset, such as severe occlusion or low lighting, still pose challenges and affect the R model's performance in these scenarios. In addition, to improve confidence and non-maximum suppression (NMS) threshold for accuracy, it is also possible to misjudge some true examples as negative samples. Subsequent work will focus on further optimizing these aspects to achieve a better performance balance in practical applications. However, judging from the improvement in mAP0.5 and F1 scores, this improvement is generally beneficial, with mAP0.5 increasing to 0.880 and the F1 score also increasing to 0.82. Second, the P and R of YOLOv8-Rep are higher than those of the original YOLOv8, reaching 0.915 and 0.826, respectively. This improvement was mainly attributed to the RepVGG's powerful feature extraction, which enables the model to better capture the characteristics of grape clusters. Moreover, the mAP0.5 and F1 scores also increased to 0.917 and 0.87, respectively, further verifying the RepVGG's improvement in model performance. Finally, a comprehensive analysis of the improved YOLOv8-Rep-Head model was carried out. Compared with those of the original YOLOv8, the P and R of YOLOv8-Rep-Head reach higher levels of 0.902 and 0.861, respectively. This shows that introducing the small-target detection layer and the RepVGG structure can further improve the model's performance, enabling it to maintain a high R rate while maintaining a high P rate. Correspondingly, the mAP0.5 and F1 scores also increased to 0.927 and 0.88, respectively, achieving the best performance among all the models. The application of the small target detection layer to detect more small targets at longer shooting distances is a key improvement, increasing mAP0.5 by 1 %. In addition, the mAP0.5 of YOLOv8-Rep is 0.917, which is 4.7 % higher than YOLOv8. This is because applying RepVGG to the detection of ‘Kyoho’ grape bunches can improve the network's expressiveness and improve the model's detection accuracy, thereby improving the detection performance.
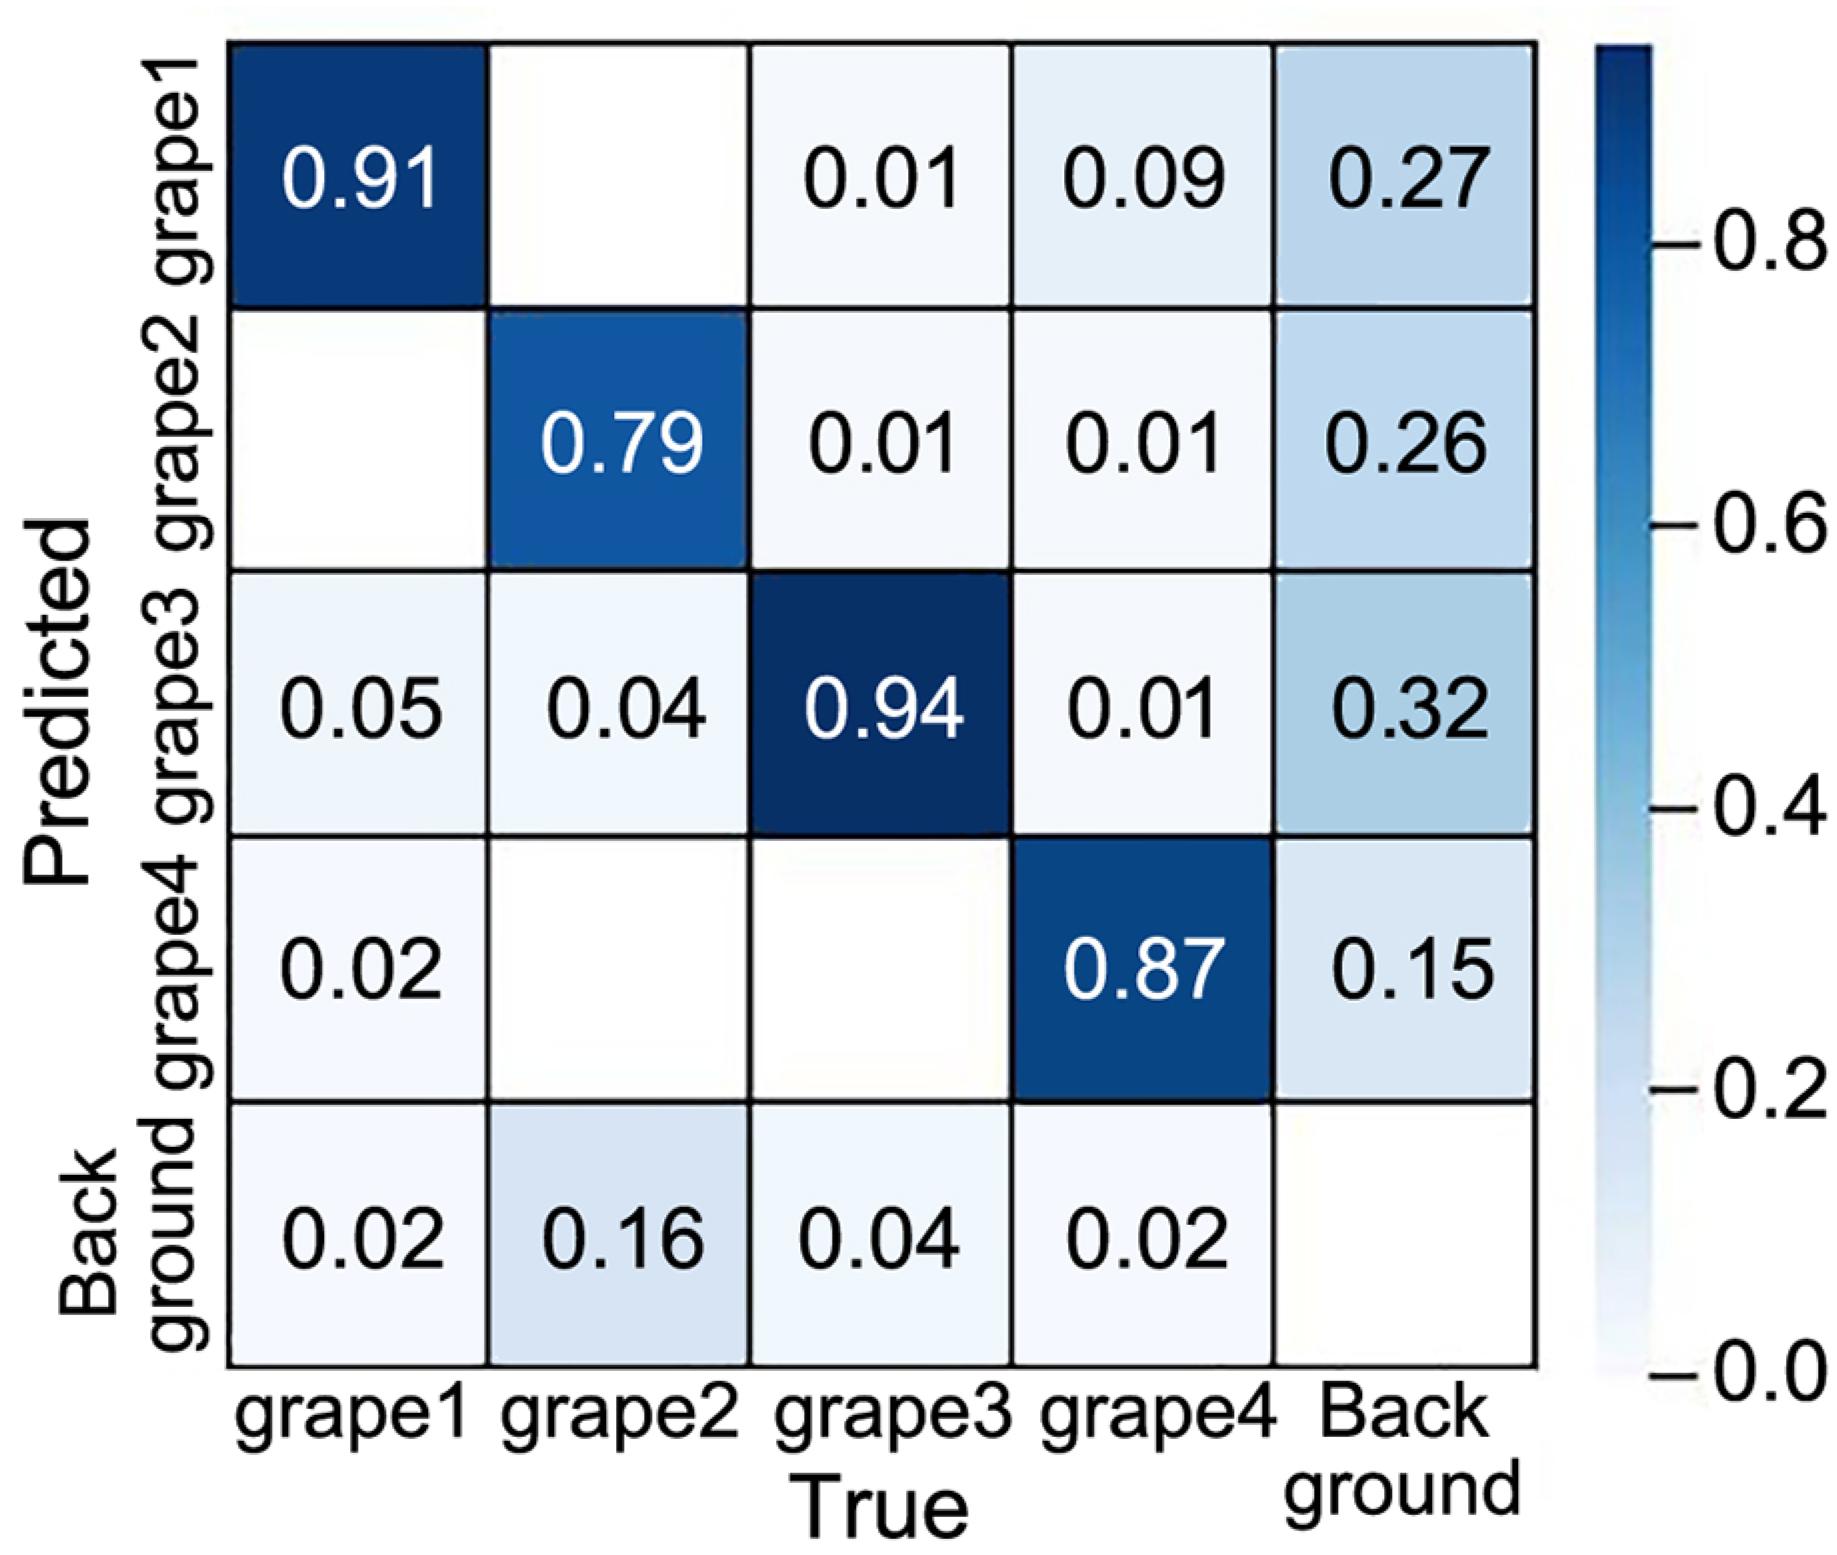
The confusion matrix corresponding to YOLOv8-Rep-Head is shown in Figure 6. These elements on the main diagonal represent the number of correctly classified categories; the greater the value, the greater the proportion of correctly identified categories. The nonmain diagonal elements represent the misclassification between categories. The greater the value, the more a category is mistakenly identified as another category. After comparison, the confusion matrix of YOLOv8-Rep-Head on the main diagonal is generally greater than that of YOLOv8, and the values on the nonmain diagonal are generally lower than those of YOLOv8, which means that YOLOv8-Rep-Head has improved performance, and confirms the effectiveness of the experimental improvement.
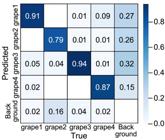
You Only Look Once version 8 adding a small object detection layer and replacing the re-parameterized visual geometry group module confusion matrix.
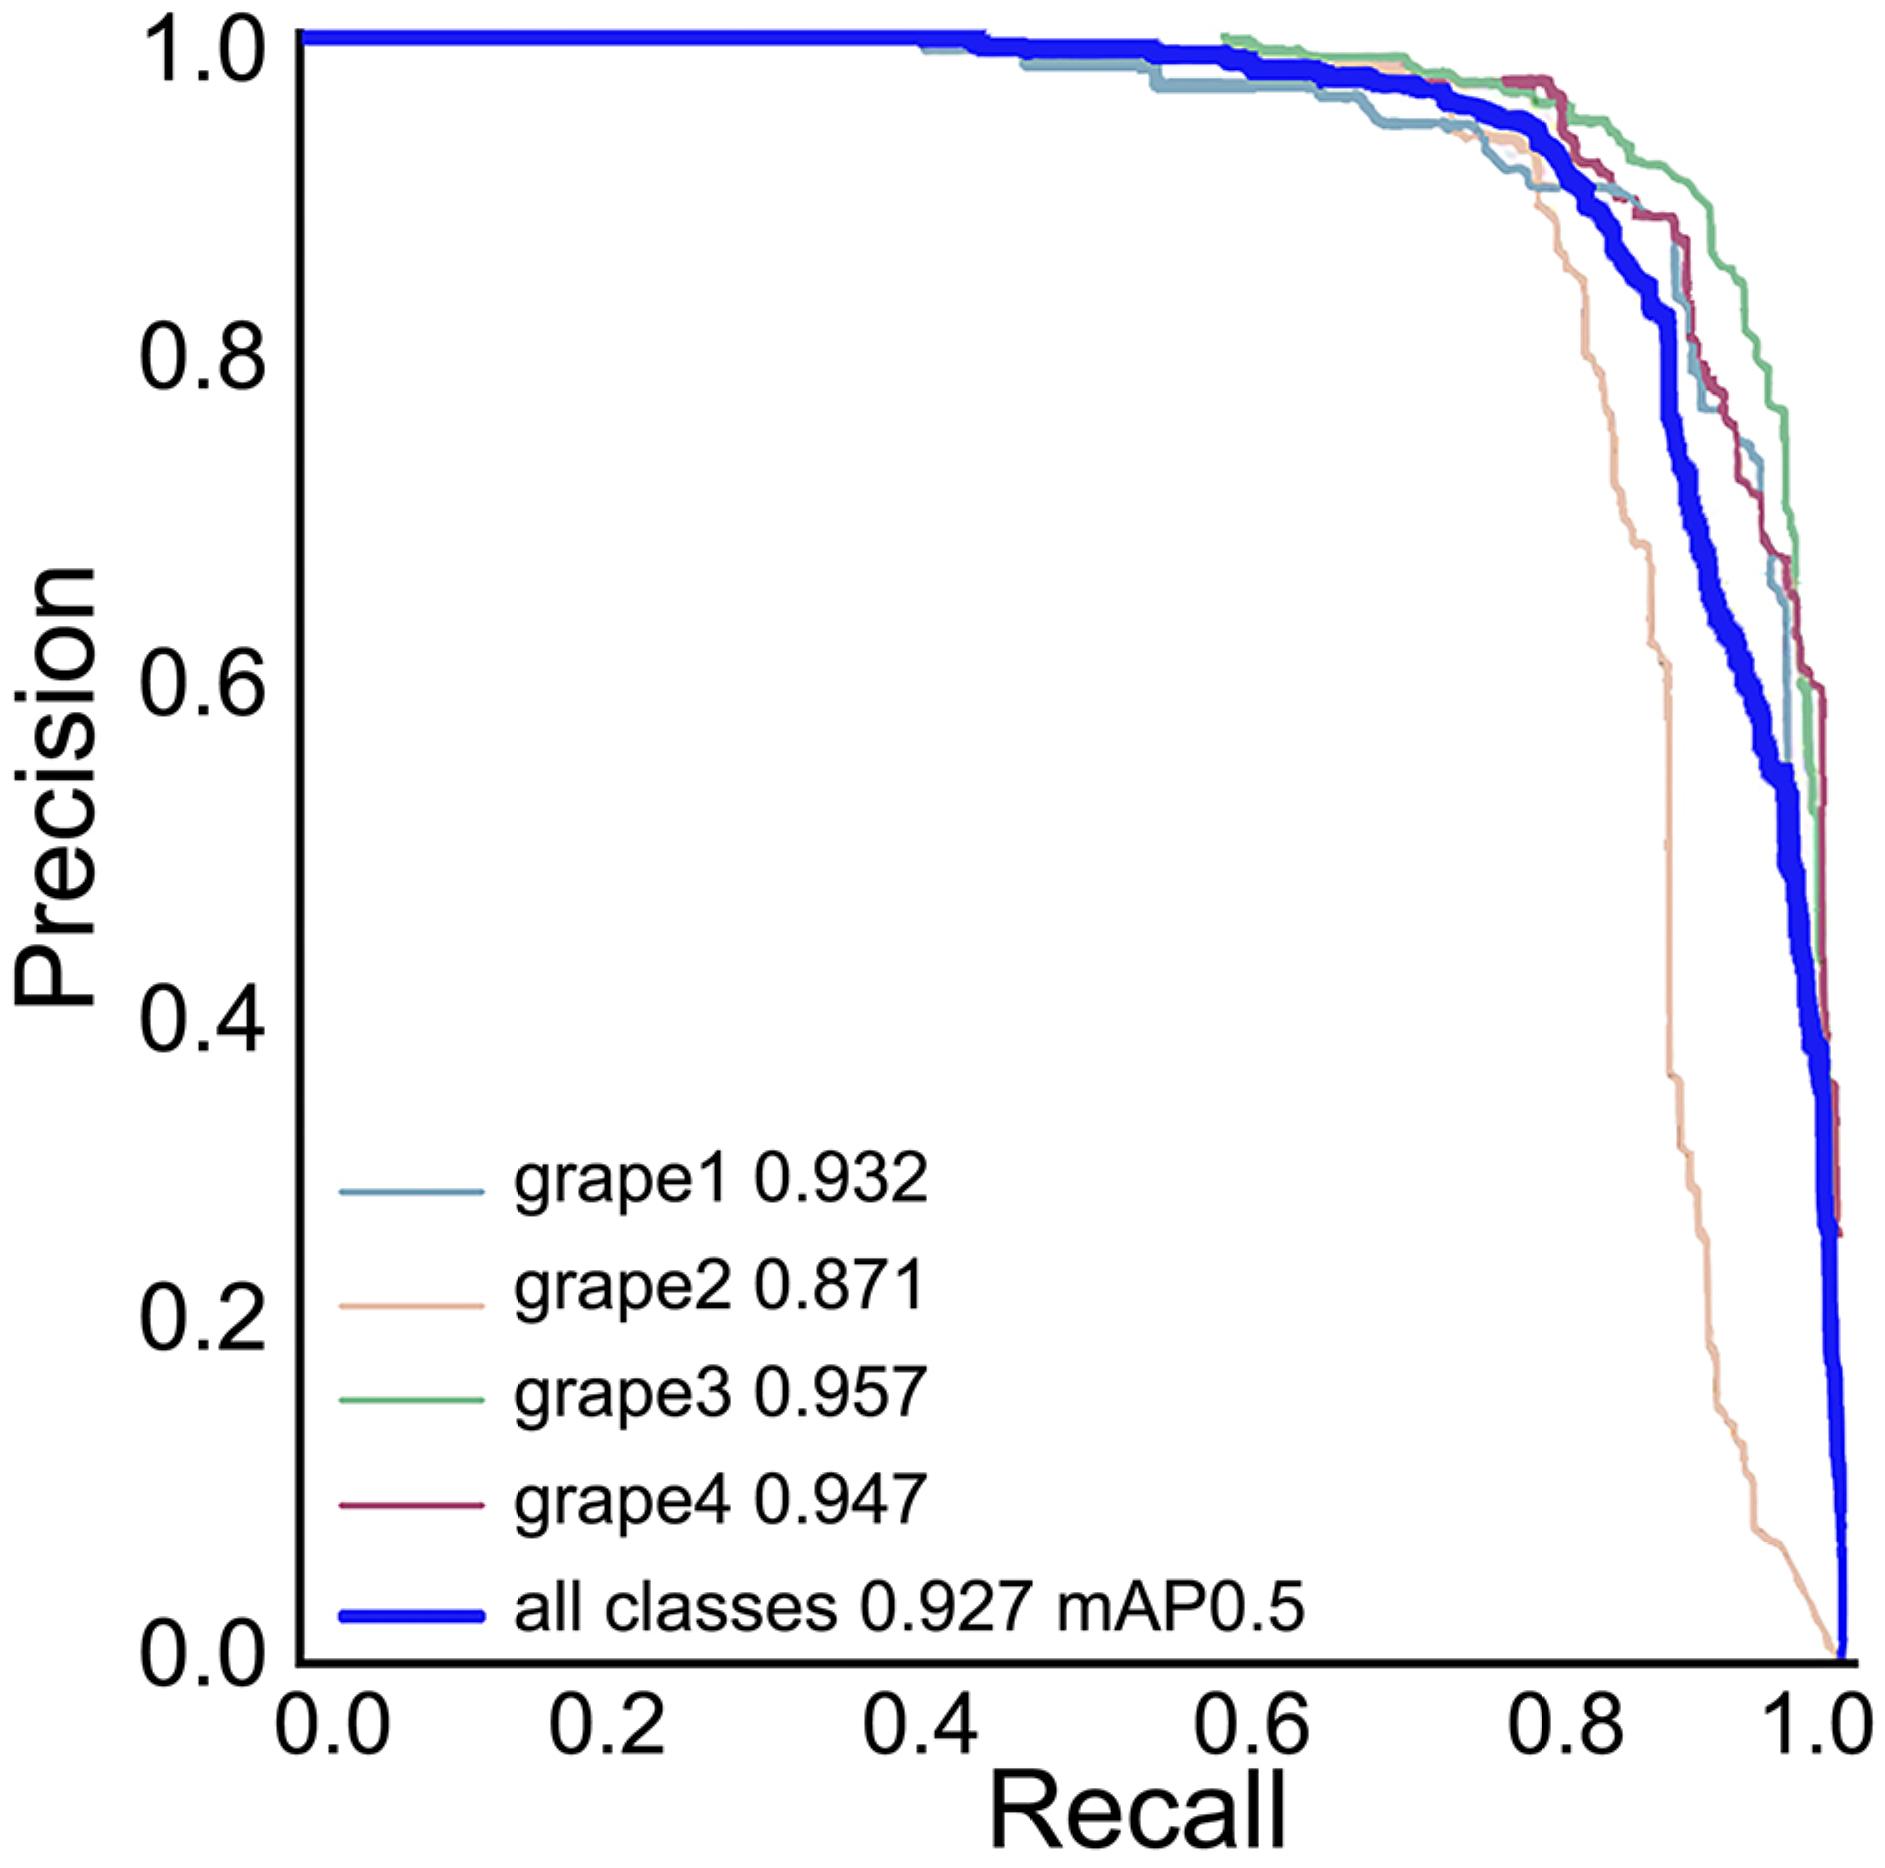
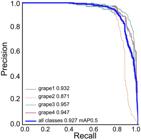
The PR curve is an important criterion for measuring the performance of target detection models. The PR curve intuitively reflects changes in the model's precision across different recall rates, thereby comprehensively evaluating its performance under different threshold settings. In this experiment, the YOLOv8-Rep-Head model was trained and tested on grape bunches at maturity levels I-IV.
The PR curve shows that the model performs excellently across all four maturity levels. The curve maintains a high P rate at different R rates, indicating that the model can accurately detect grape bunches of different maturities and effectively reduce both false and missed detection. The PR curve of the YOLOv8-Rep-Head model is shown in Figure 7.
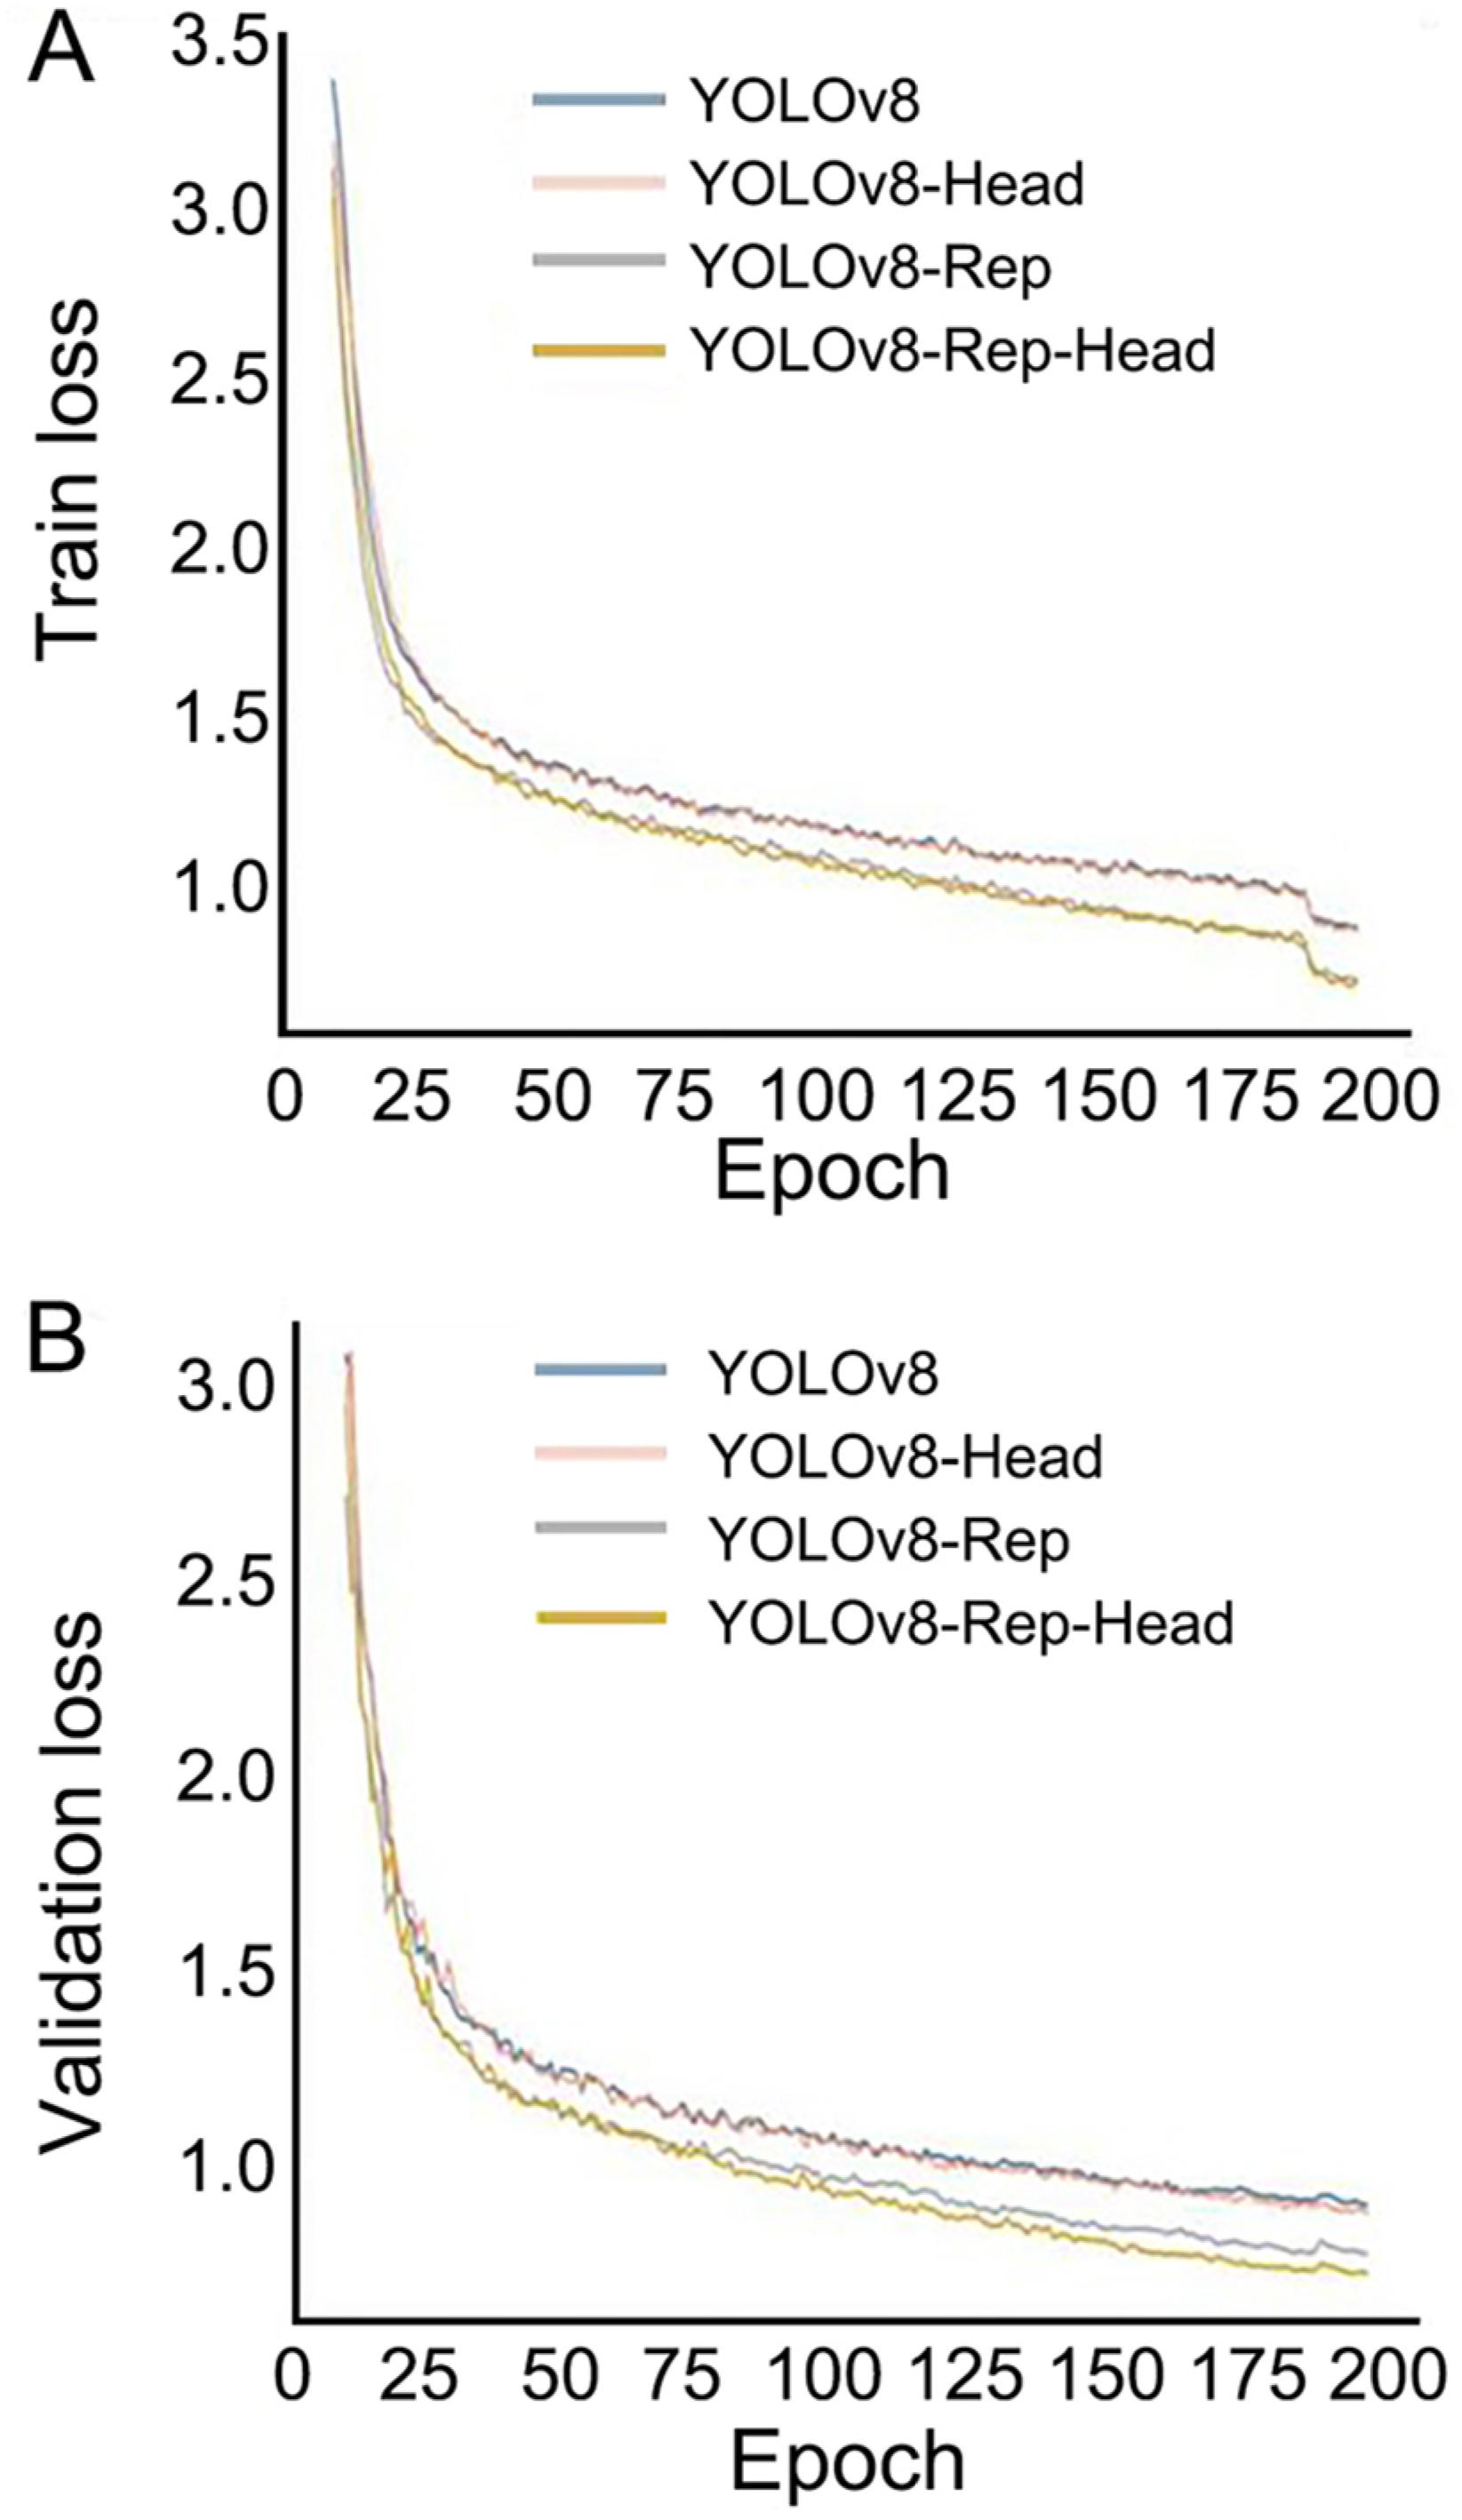
The loss function change curves of the four network models are shown in Figure 8. During training, the four models’ loss curves converge and tend to be flat, indicating that the models are gradually learning the relevant features of the data and that the optimizer is close to finding a parameter configuration that minimizes the loss function. The loss curve shows that the improved YOLOv8 converges relatively quickly, with small loss values, and better model performance. The loss curve tends to be flat and to converge, and the model's performance usually gradually stabilizes.
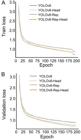
Loss plot A) is train loss curve and B) is validation (Val) loss curve. YOLOv8 = You Only Look Once version 8; YOLOv8-Head = YOLOv8 with a small target detection layer; YOLOv8-Rep = YOLOv8 replacing the faster implementation of the cross stage partial bottleneck with 2 convolutions module with the re-parameterized visual geometry group (RepVGG) module; YOLOv8-Rep-Head = YOLOv8 adding a small object detection layer and replacing the RepVGG module.
The validation loss curves demonstrate that all models experience a rapid decline in loss during the early training epochs, indicating effective initial learning. As training progresses, the loss continues to decrease more gradually, reflecting convergence. Among the compared models, YOLOv8-Rep-Head consistently achieves the lowest validation loss across epochs, suggesting superior generalization performance. Both YOLOv8-Rep and YOLOv8-Head also outperform the baseline YOLOv8, indicating that the introduction of re-parameterization and head modifications contribute positively to the model's learning capacity and stability. Overall, the results validate the effectiveness of the proposed architectural improvements.
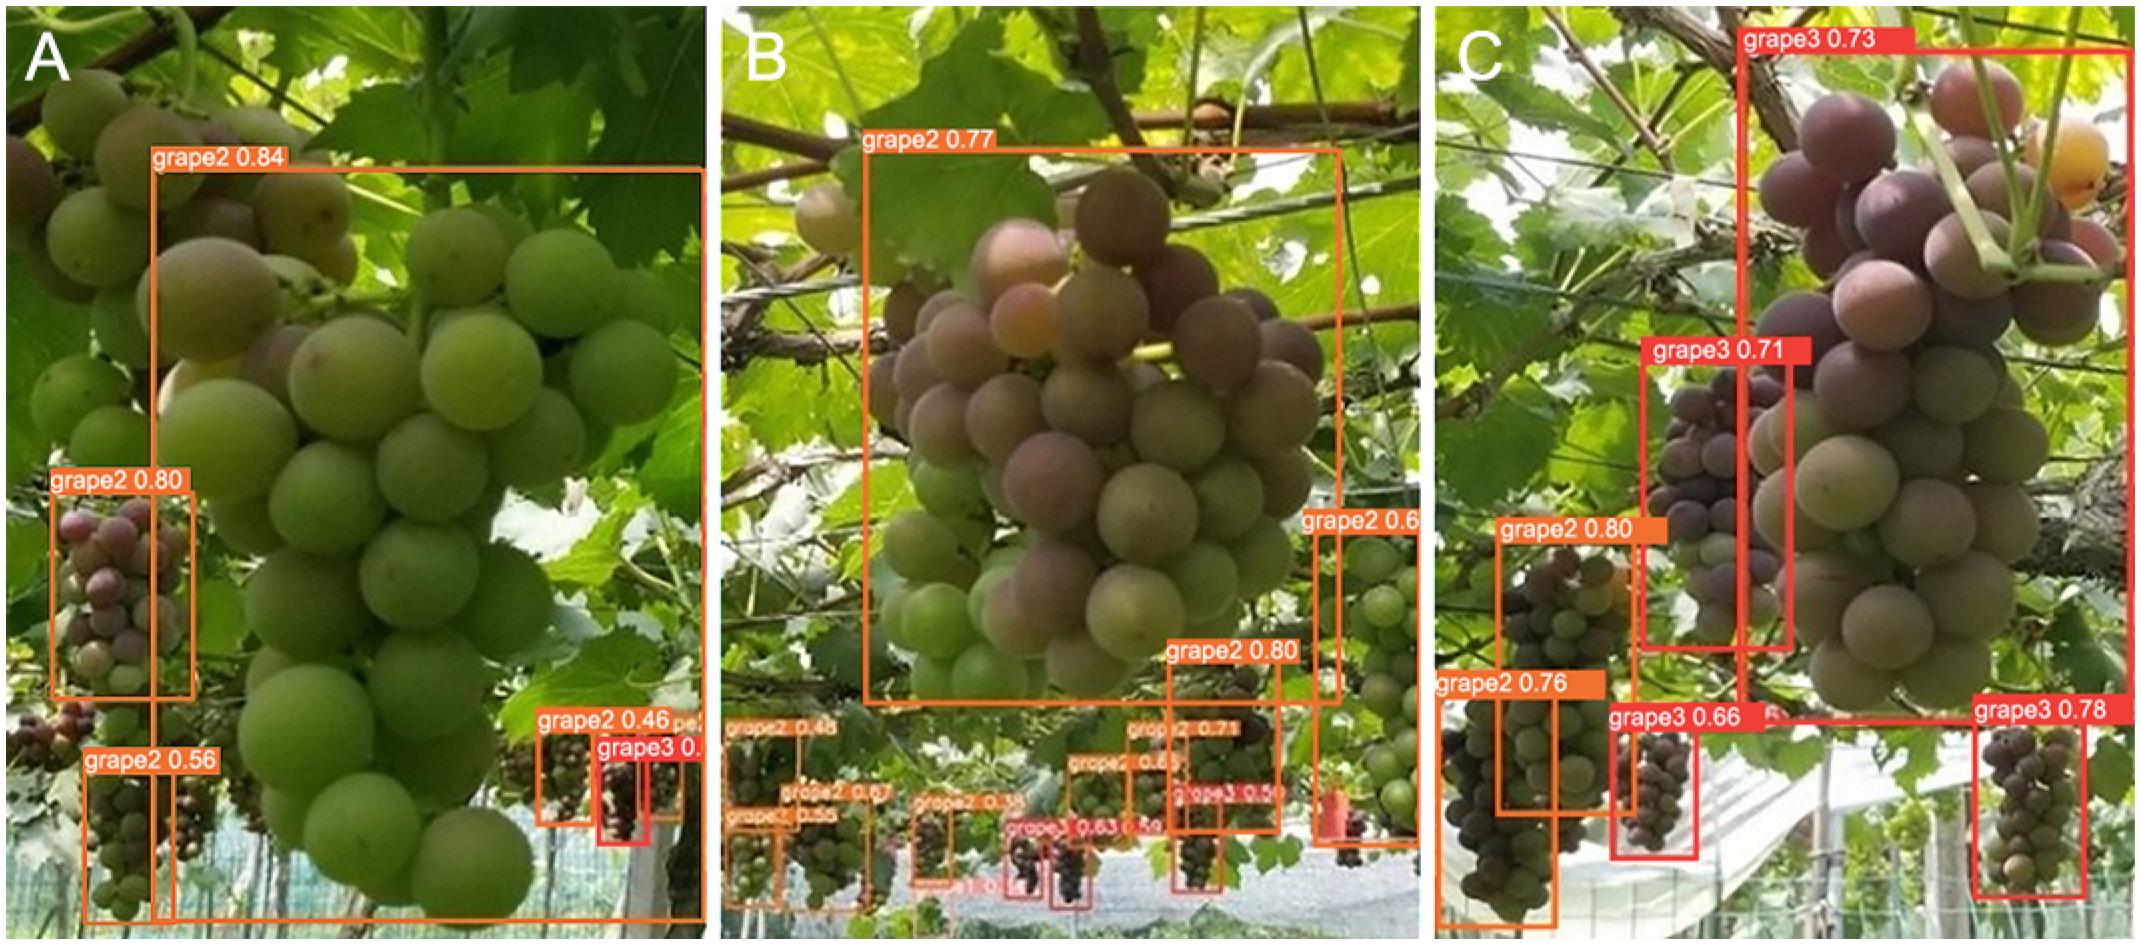
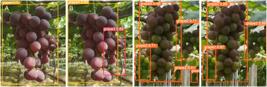
After testing YOLOv8 and the improved YOLOv8-Rep-Head model, several comparison graphs were obtained. A comparison of the maturity detection results for the ‘Kyoho’ cultivar is shown in Figure 9. Figure 9A and C are the detection effect graphs of the YOLOv8 model, and Figure 9B and D are the detection effect graphs of the YOLOv8-Rep-Head model.
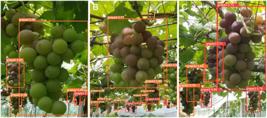
The remarkable capabilities of the YOLOv8-Rep-Head detection model in blurring, occlusion, and small targets are further clearly demonstrated in Figure 10. It cannot only accurately identify targets but also accurately assesses their maturity levels.
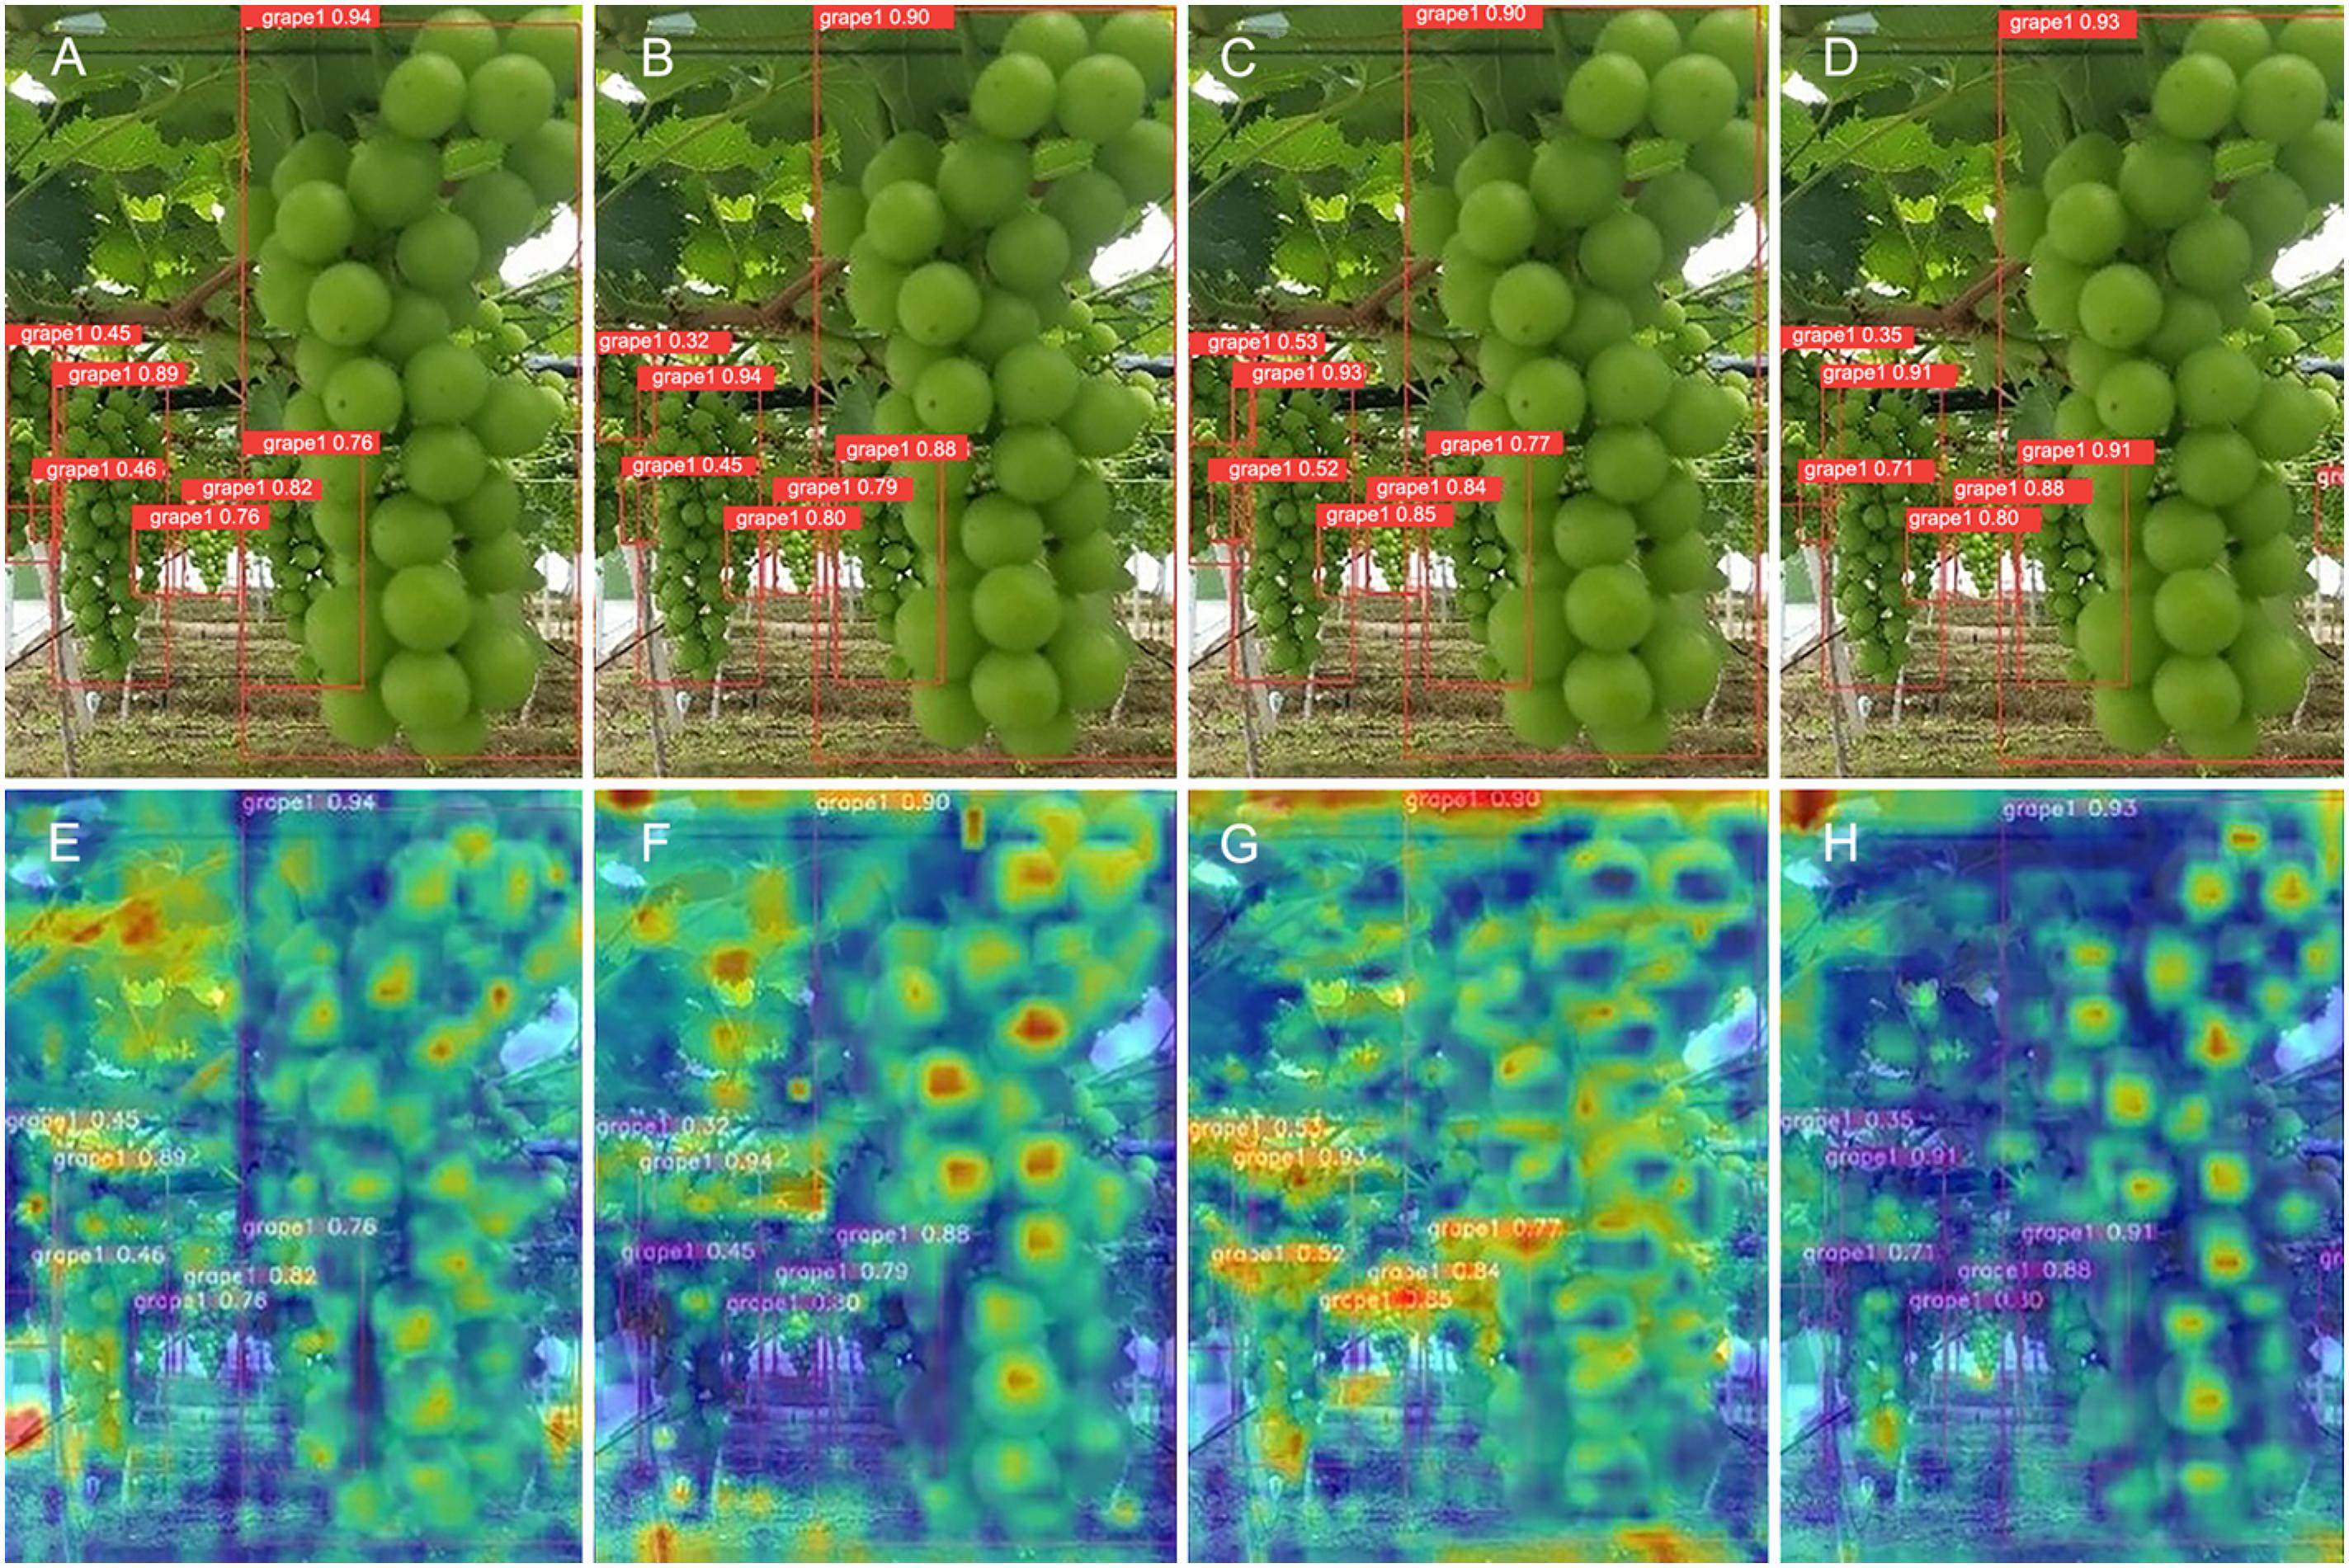
A heat map was added to the experimental results to more intuitively show the model's focus areas during the detection process and the effect of the improvements in Figure 11. The heat map clearly shows reflect the model's focus on different target areas, helping verify the effectiveness of our improvements. The heat map clearly shows that the improved model has a stronger response in the key target area and better ability to handle complex scenes. The heat map shows a gradual improvement. From YOLOv8 to YOLOv8-Rep-Head, the hot spots of the heat map gradually become more concentrated and prominent, and the colors are brighter, indicating that the model's attention and focus on the grape bunches are constantly increasing, and the ability to detect grape bunches is gradually enhanced.
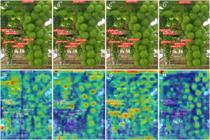
Experimental results and corresponding heat map A) You Only Look Once version 8 (YOLOv8), B) YOLOv8 with a small target detection layer (YOLOv8-Head), C) YOLOv8 replacing the C2f module with the RepVGG module (YOLOv8-Rep), D) adding a small object detection layer and replacing the RepVGG module (YOLOv8-Rep-Head), E) YOLOv8's heatmap, F) YOLOv8-Head's heatmap, G) YOLOv8-Rep's heatmap, H) YOLOv8-Rep-Head's heatmap.
The impact of different loss functions on the performance of detection models
This section analyzes the impact of different loss functions on model performance. The experiment compares the effects of different loss functions, including complete intersection over union (CIoU), distance intersection over union (DIoU), generalized intersection over union (GIoU), and weighted intersection over union (WIoU).
Generally, the CIoU is suitable for scenes that require careful consideration of overlapping areas, shapes, and center-point positions, such as complex backgrounds or multitarget tracking. The DIoU is suitable for tasks that require fast convergence and precise bounding box positioning, especially in scenes where bounding box accuracy is critical. GIoU is suitable for processing complex scenes with overlapping and non-overlapping areas, such as target detection in crowded scenes. The WIoU is suitable for situations where the loss focus needs to be adjusted dynamically, such as when targets are unevenly distributed or when targets are detected at different scales.
The improved methods proposed in this paper have good detection performance, with P rates above 0.88, R rates above 0.83, and mAP0.5 values above 0.91. When the CIoU loss function is used, the P, R, and mAP0.5 are 0.902, 0.861, and 0.927, respectively; the P, R, and mAP0.5 corresponding to the DIoU loss function are 0.897, 0.857, and 0.922, respectively; the P, R, and mAP0.5 corresponding to the GIoU loss function are 0.894, 0.832, and 0.917, respectively; and the P, R, and mAP0.5 corresponding to the WIoU loss function are 0.883, 0.835, and 0.916, respectively.
The experimental results comparing different loss functions are shown intuitively in Table 4. Compared with DIoU, CIoU is 0.005 higher in P, 0.004 higher in R, and 0.005 higher in mAP0.5. This shows that CIoU has greater advantages in comprehensively considering the overlapping area, shape, and center point position. Especially in the grape maturity detection task under a complex background, it can more accurately locate and identify the target. Compared with GIoU, CIoU is 0.008 higher in P, 0.029 higher in R, and 0.01 higher in mAP0.5. The advantage of CIoU lies in its optimization strategy for bounding box position, resulting in better performance in complex scenes. Compared with WIoU, CIoU is 0.019 higher in P, 0.026 higher in R, and 0.011 higher in mAP0.5. This shows that CIoU is better than WIoU at dynamically adjusting the loss weight and at better adapting to the detection needs of objects of different scales. The CIoU loss function combines the advantages of IoU, DIoU, and GIoU and accounts for the overlapping area, center point distance, and aspect ratio of bounding boxes, enabling the model to learn target features more comprehensively during optimization. CIoU has good robustness to objects of different scales and shapes and is particularly suitable for handling multi-scale and complex background issues in grape maturity detection. Experiments show that the CIoU loss function converges faster during training and can achieve lower loss values more quickly while maintaining higher detection accuracy. In summary, the CIoU loss function shows excellent performance in the grape maturity detection task and is superior to other loss functions in terms of P, R, and mAP0.5. Therefore, this study selects the CIoU loss function for model training to achieve better detection results.
Discussion
This paper introduces a small target detection layer and a RepVGG module into the YOLOv8 network to detect the maturity of ‘Kyoho’ grapes. The performance of the improved YOLOv8-Rep-Head model is significantly better than that of the other models.
First, through experimental comparisons of Mask R-CNN, Faster R-CNN, YOLOX, YOLOv4, YOLOv7, YOLOv8, and YOLOv11, YOLOv8, which has the best comprehensive performance, is selected as the backbone network for this study.
Second, the optimizers are compared and analyzed, and the SGD model with the best performance is selected, with a P rate of 0.830, an R rate of 0.800, an mAP0.5 of 0.870, and an F1 value of 0.81. SGD is suitable for situations where computing resources are limited and data noise is insensitive.
Third, ablation experiments were conducted via YOLOv8, YOLOv8-Head, YOLOv8-Rep, and YOLOv8-Rep-Head to train the models. Four sets of experiments were conducted to compare the model performance. The experimental results show that the introduction of the small target detection layer and the RepVGG structure can enable the model to maintain a high R rate while maintaining a high P rate. By comparing the confusion matrices of YOLOv8 and YOLOv8-Rep-Head, it was found that the values on the main diagonal of YOLOv8-Rep-Head are generally higher than those of YOLOv8, and the values on the nonmain diagonal are generally lower than those of YOLOv8, which means that the proportion of maturity categories correctly identified by the YOLOv8-Rep-Head model is greater.
Finally, the effects of different loss functions on the detection model's performance were experimentally analyzed. The P, R, and mAP0.5 for the CIoU loss function were 0.902, 0.861, and 0.927, respectively, achieving the best performance. Therefore, the CIoU loss function is better suited to experiments on this dataset.
Although the YOLOv8-Rep-Head model demonstrates strong performance in detecting maturity stages of ‘Kyoho’ grapes, its applicability is limited by the relatively narrow scope and small size of the training dataset. Our future work will focus on building a more comprehensive and diverse multi-variety grape dataset by partnering with agricultural research institutions and commercial vineyards to collect high-resolution images of cultivars such as ‘Cabernet Sauvignon’, ‘Merlot’, and ‘Chardonnay’. To enhance the model's adaptability to real-world agricultural scenarios, the dataset should encompass a range of illumination conditions, shooting angles, and growth stages. In parallel, advanced data augmentation techniques — such as GAN-based synthetic image generation and simulated modeling of grape development — can further enrich the training data while maintaining label fidelity.
On the algorithmic front, the model architecture should be refined to accommodate the morphological differences among grape varieties, including variations in berry size, color gradients, and cluster structure. Introducing a multi-task learning approach may enable the network to jointly perform maturity estimation and varietal classification, thereby enhancing both generalization and efficiency. Furthermore, leveraging the current model as a pre-trained baseline, transfer learning and domain adaptation techniques can enable rapid tuning for other grape types with minimal annotated data. To ensure robustness and interpretability, cross-variety evaluation protocols should be established to incorporate confusion matrices, per-class performance metrics, and visual explanations of model attention. These enhancements will not only improve technical performance but also promote real-world deployment in intelligent viticulture and precision agriculture applications.
This paper proposes an improved algorithm based on YOLOv8. By introducing a small target detection layer in the P2 layer of the YOLOv8 network and replacing the C2f module in the backbone network with the RepVGG module, the grape maturity segmentation detection algorithm proposed in previous studies and the original YOLOv8 algorithm have solved the problems of missed detection and false detection of blurred targets, occluded targets, and small targets. After many comparative experiments, the YOLOv8-Rep-Head model with the best performance was identified, achieving a model P of 0.902, an R rate of 0.861, an mAP0.5 of 0.927, and an F1 value of 0.88. The model accurately detects the maturity of ‘Kyoho’ grape bunches, achieving high detection accuracy and a low false detection rate, meeting the needs of grape maturity detection in natural environments and demonstrating better generalizability. This study has significant reference value for the maturity prediction of orchard grapes and for intelligent harvesting technology in agricultural applications. This research will help enhance the confidence of fruit farmers and the satisfaction of consumers, promote technological innovation in related fields, provide strong support for scientific research and teaching, and promote the healthy development and innovative upgrading of the grape industry.
-
Declaration of use of AI technologies
This study utilized Artificial Intelligence (AI) tools exclusively for image processing and analysis, as described in the Materials and Methods section. AI was not employed in the writing of the manuscript or the interpretation of data. The authors conducted all analyses, prepared the discussion, and wrote the manuscript.
Data availability statement
The authors confirm that the data supporting the findings of this study are available within the article and its supplementary materials.
Acknowledgments
The authors thank the Natural Science Foundation of Zhejiang Province of China (No. LMS26F030024) and the Research Development Foundation of Zhejiang A&F University (2019RF065) for the financial support.
References
-
Al-Kaisy AM, Sachde AG, Ghalib HA, Hamel SM. 1981. Physical and Chemical Changes During Ripening of Some Grape Varieties Grown in Basrah. American Journal of Enology and Viticulture 32: 268-271. https://doi.org/10.5344/ajev.1981.32.4.268
» https://doi.org/10.5344/ajev.1981.32.4.268 -
Armstrong CEJ, Gilmore AM, Boss PK, Pagay V, Jeffery DW. 2023. Machine learning for classifying and predicting grape maturity indices using absorbance and fluorescence spectra. Food Chemistry 403: 134321. https://doi.org/10.1016/j.foodchem.2022.134321
» https://doi.org/10.1016/j.foodchem.2022.134321 -
Badeka E, Karapatzak E, Karampatea A, Bouloumpasi E, Kalathas I, Lytridis C, et al. 2023. A Deep Learning Approach for Precision Viticulture, Assessing Grape Maturity via YOLOv7. Sensors 23: 8126. https://doi.org/10.3390/s23198126
» https://doi.org/10.3390/s23198126 -
Bazinas C, Vrochidou E, Kalampokas T, Karampatea A, Kaburlasos VG. 2022. A Non-Destructive Method for Grape Ripeness Estimation Using Intervals’ Numbers (INS) Techniques. Agronomy 12: 1564. https://doi.org/10.3390/agronomy12071564
» https://doi.org/10.3390/agronomy12071564 -
Benelli A, Cevoli C, Ragni L, Fabbri A. 2021. In-field and non-destructive monitoring of grapes maturity by hyperspectral imaging. Biosystems Engineering 207: 59-67. https://doi.org/10.1016/j.biosystemseng.2021.04.006
» https://doi.org/10.1016/j.biosystemseng.2021.04.006 -
Bochkovskiy A, Wang C-Y, Liao H-YM. 2020. YOLOv4: Optimal Speed and Accuracy of Object Detection. arXiv: arXiv:2004.10934. https://doi.org/10.48550/arXiv.2004.10934
» https://doi.org/10.48550/arXiv.2004.10934 -
Ding X, Zhang X, Ma N, Han J, Ding G, Sun J. 2021. RepVGG: Making VGG-style ConvNets Great Again. arXiv: arXiv:2101.03697. https://doi.org/10.48550/arXiv.2101.03697
» https://doi.org/10.48550/arXiv.2101.03697 -
Galal H, Elsayed S, Allam A, Farouk M. 2022. Indirect Quantitative Analysis of Biochemical Parameters in Banana Using Spectral Reflectance Indices Combined with Machine Learning Modeling. Horticulturae 8: 438. https://doi.org/10.3390/horticulturae8050438
» https://doi.org/10.3390/horticulturae8050438 -
Gao G, Shuai C, Wang S, Ding T. 2024. Using improved YOLO V5s to recognize tomatoes in a continuous working environment. Signal, Image and Video Processing 18: 4019-4028. https://doi.org/10.1007/s11760-024-03010-w
» https://doi.org/10.1007/s11760-024-03010-w -
Kalopesa E, Gkrimpizis T, Samarinas N, Tsakiridis NL, Zalidis GC. 2023. Rapid Determination of Wine Grape Maturity Level from pH, Titratable Acidity, and Sugar Content Using Non-Destructive In Situ Infrared Spectroscopy and Multi-Head Attention Convolutional Neural Networks. Sensors 23: 9536. https://doi.org/10.3390/s23239536
» https://doi.org/10.3390/s23239536 -
Knott M, Perez-Cruz F, Defraeye T. 2023. Facilitated machine learning for image-based fruit quality assessment. Journal of Food Engineering 345: 111401. https://doi.org/10.1016/j.jfoodeng.2022.111401
» https://doi.org/10.1016/j.jfoodeng.2022.111401 -
Le Moigne M, Symoneaux R, Jourjon F. 2008. How to follow grape maturity for wine professionals with a seasonal judge training? Food Quality and Preference 19: 672-681. https://doi.org/10.1016/j.foodqual.2008.06.006
» https://doi.org/10.1016/j.foodqual.2008.06.006 -
Li P, Lee S-H, Hsu H-Y. 2011. Review on fruit harvesting method for potential use of automatic fruit harvesting systems. Procedia Engineering 23: 351-366. https://doi.org/10.1016/j.proeng.2011.11.2514
» https://doi.org/10.1016/j.proeng.2011.11.2514 -
Li C, Li L, Jiang H, Weng K, Geng Y, Li L, et al. 2022. YOLOv6: A Single-Stage Object Detection Framework for Industrial Applications. arXiv: arXiv:2209.02976. https://doi.org/10.48550/arXiv.2209.02976
» https://doi.org/10.48550/arXiv.2209.02976 -
Li Y, Wang Y, Xu D, Zhang J, Wen J. 2023. An Improved Mask RCNN Model for Segmentation of ‘Kyoho’ (Vitis labruscana) Grape Bunch and Detection of Its Maturity Level. Agriculture 13: 914. https://doi.org/10.3390/agriculture13040914
» https://doi.org/10.3390/agriculture13040914 -
Lou H, Duan X, Guo J, Liu H, Gu J, Bi L, et al. 2023. DC-YOLOv8: Small-Size Object Detection Algorithm Based on Camera Sensor. Electronics 12: 2323. https://doi.org/10.3390/electronics12102323
» https://doi.org/10.3390/electronics12102323 -
Lu J, Tan L, Jiang H. 2021. Review on Convolutional Neural Network (CNN) Applied to Plant Leaf Disease Classification. Agriculture 11: 707. https://doi.org/10.3390/agriculture11080707
» https://doi.org/10.3390/agriculture11080707 -
Muncan J, Anantawittayanon S, Furuta T, Kaneko T, Tsenkova R. 2022. Aquaphotomics monitoring of strawberry fruit during cold storage – A comparison of two cooling systems. Frontiers in Nutrition 9:1058173. https://doi.org/10.3389/fnut.2022.1058173
» https://doi.org/10.3389/fnut.2022.1058173 -
Pathange LP, Mallikarjunan P, Marini RP, O’Keefe S, Vaughan D. 2006. Non-destructive evaluation of apple maturity using an electronic nose system. Journal of Food Engineering 77: 1018-1023. https://doi.org/10.1016/j.jfoodeng.2005.08.034
» https://doi.org/10.1016/j.jfoodeng.2005.08.034 -
Perestrelo R, Silva C, Silva P, Câmara JS. 2018. Unraveling Vitis vinifera L. grape maturity markers based on integration of terpenic pattern and chemometric methods. Microchemical Journal 142: 367-376. https://doi.org/10.1016/j.microc.2018.07.017
» https://doi.org/10.1016/j.microc.2018.07.017 -
Qiu C, Tian G, Zhao J, Liu Q, Xie S, Zheng K. 2022. Grape Maturity Detection and Visual Pre-Positioning Based on Improved YOLOv4. Electronics 11: 2677. https://doi.org/10.3390/electronics11172677
» https://doi.org/10.3390/electronics11172677 -
Redmon J, Divvala S, Girshick R, Farhadi A. 2016. You Only Look Once: Unified, Real-Time Object Detection. arXiv: arXiv:1506.02640. https://doi.org/10.48550/arXiv.1506.02640
» https://doi.org/10.48550/arXiv.1506.02640 -
Redmon J, Farhadi A. 2017. YOLO9000: Better, Faster, Stronger. arXiv: arXiv:1612.08242. https://doi.org/10.48550/arXiv.1612.08242
» https://doi.org/10.48550/arXiv.1612.08242 -
Redmon J, Farhadi A. 2018. YOLOv3: An Incremental Improvement. arXiv: arXiv:1804.02767. https://doi.org/10.48550/arXiv.1804.02767
» https://doi.org/10.48550/arXiv.1804.02767 -
Shah SSA, Zeb A, Qureshi WS, Arslan M, Malik AU, Alasmary W, et al. 2020. Towards fruit maturity estimation using NIR spectroscopy. Infrared Physics & Technology 111: 103479. https://doi.org/10.1016/j.infrared.2020.103479
» https://doi.org/10.1016/j.infrared.2020.103479 -
Wang C-Y, Bochkovskiy A, Liao H-YM. 2023. YOLOv7: Trainable bag-of-freebies sets new state-of-the-art for real-time object detectors. arXiv: arXiv:2207.02696. https://doi.org/10.48550/arXiv.2207.02696
» https://doi.org/10.48550/arXiv.2207.02696 -
Wang W, Shi Y, Liu W, Che Z. 2024. An Unstructured Orchard Grape Detection Method Utilizing YOLOv5s. Agriculture 14: 262. https://doi.org/10.3390/agriculture14020262
» https://doi.org/10.3390/agriculture14020262 -
Wei X, Xie F, Wang K, Song J, Bai Y. 2023. A study on Shine-Muscat grape detection at maturity based on deep learning. Scientific Reports 13: 4587. https://doi.org/10.1038/s41598-023-31608-6
» https://doi.org/10.1038/s41598-023-31608-6 -
Wu F, Zhu R, Meng F, Qiu J, Yang X, Li J, et al. 2024. An Enhanced Cycle Generative Adversarial Network Approach for Nighttime Pineapple Detection of Automated Harvesting Robots. Agronomy 14: 3002. https://doi.org/10.3390/agronomy14123002
» https://doi.org/10.3390/agronomy14123002 -
Yu C, Shi X, Luo W, Feng J, Zheng Z, Yorozu A, et al. 2024. MLG-YOLO: A Model for Real-Time Accurate Detection and Localization of Winter Jujube in Complex Structured Orchard Environments. Plant Phenomics 6: 0258. https://doi.org/10.34133/plantphenomics.0258
» https://doi.org/10.34133/plantphenomics.0258 -
Yuan M, Meng H, Wu J. 2024. AM YOLO: adaptive multi-scale YOLO for ship instance segmentation. Journal of Real-Time Image Processing 21: 100. https://doi.org/10.1007/s11554-024-01479-9
» https://doi.org/10.1007/s11554-024-01479-9
Edited by
-
Edited by:
Barbara Janet Teruel https://orcid.org/0000-0002-5102-6716