 Comparative Analysis of the RFT and IRIS Non-Destructive Testing Techniques Via Advanced Statistical and Artificial Intelligence Tools: the Case of Carbon Steel Tubular Bundles of Shell & Tube Heat Exchangers
Abstract
Abstract This work presents a comparison between the Remote Field Testing (RFT) and Internal Rotary Inspection System (IRIS) non-destructive testing (NDT) techniques. Such a comparison aims to assess the influence of the inspector experience on the RFT inspection process, as well as to evaluate whether the RFT technique has an inspection capability equivalent to the IRIS test. By using inspection data, a statistical analysis was conducted based on the results from three different RFT inspectors. Then, considering a third technique (3D Scanning) applied to sections extracted from tubes (destructive case) as a reference basis, the statistical equivalence of both NDT techniques was evaluated. Finally, to assess the accuracy of the analyses conducted by the RFT inspectors and the comparison between the RFT and IRIS techniques, artificial intelligence (AI) tools were employed to measure the success and error rates of corrosion detection via the RFT case. The results show equivalence between the NDT techniques and, despite the interpretation challenges with the RFT case, the subjectivity by the inspectors with its inspection process was considered low. The AI classification results indicated that the generated network was capable of classifying the corrosion effectively, hence supporting the equivalence between the RFT and IRIS techniques.
Keywords:
Remote Field Testing; Internal Rotary Inspection System; Shell & Tube heat exchangers; Non-destructive testing
1. Introduction
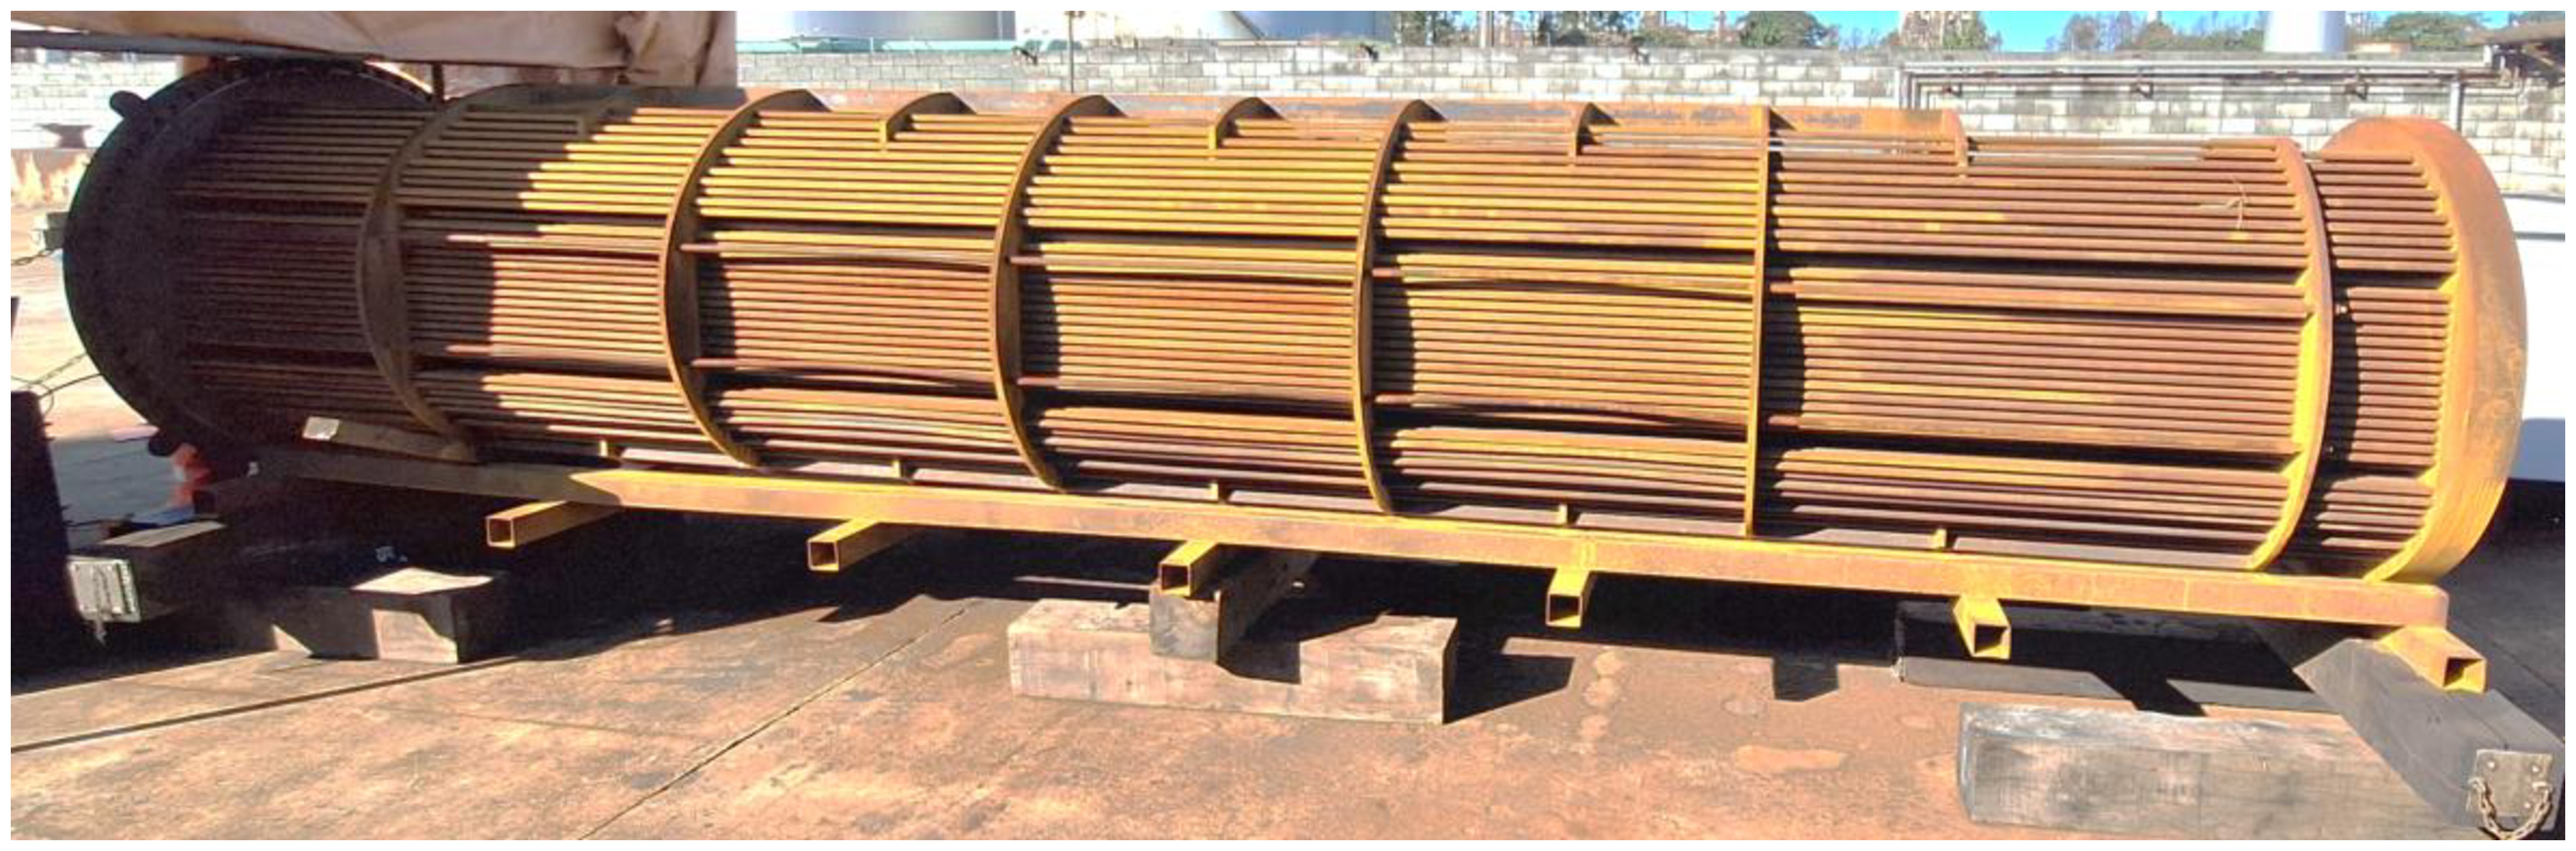
Heat exchangers are essential equipment in refineries as they are not only used in production processes but are also directly linked to energy reuse within the plants. As an illustration, Figure 1 shows the core (tubes and baffles, already decommissioned) of a Shell & Tube heat exchanger commonly used in oil refineries in Brazil. According to Sabino [1], the Shell & Tube type is the most common heat exchanger present in refineries due to its operational flexibility and maintenance characteristics. It typically consists of a shell that encloses a tubular bundle, a head, and a spool. Given the importance of such assets, both established and emerging non-destructive testing (NDT) techniques are available for their integrity monitoring. While the head and spool operational life is commonly monitored by conventional integrity evaluation techniques such as magnetic particle testing and liquid penetrant testing, the tubular bundles require techniques considered unconventional, such as Eddy Current Testing (EC), Internal Rotary Inspection System (IRIS), Remote Field Testing (RFT), among others. Although ECT can be applied in a variety of situations, this technique has evolved into RFT, specifically for tubes. By using dedicated probes, the RFT method enables the complete inspection of tubes, that is, of the full wall thickness along the entire length of each tube examined. Additionally, it allows access to tubes located within the tube bundles of the heat exchangers.
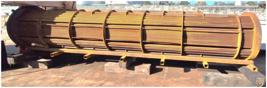
Core of a Shell & Tube heat exchanger composed of carbon steel tubular bundles as investigated in the present work.
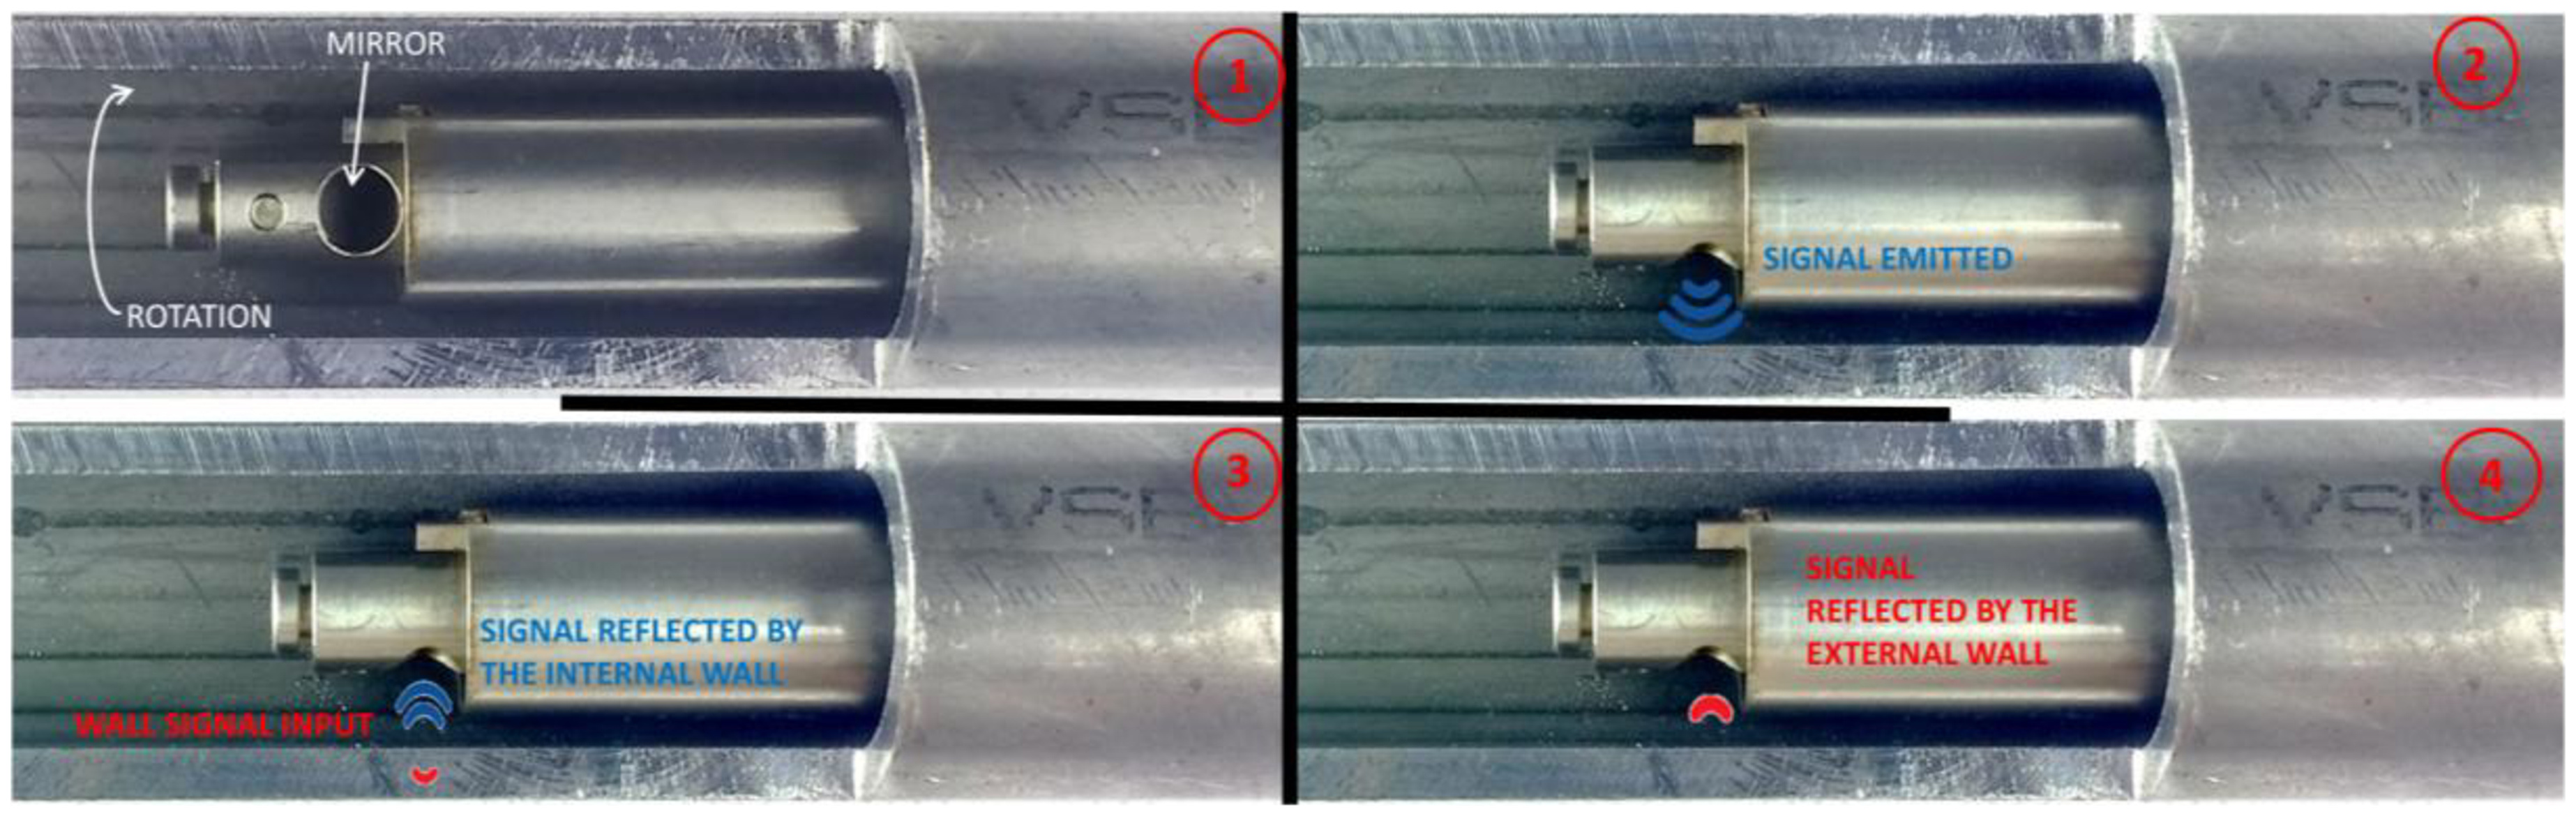
In the case of carbon steel [1,2], the IRIS non-destructive testing technique is often used to measure the remaining wall thickness of tubes in Shell & Tube heat exchangers. As any Ultrasonic Testing (UT) method, in physics terms, this technique is based on the propagation of high-frequency sound waves through a material (usually generated by a piezoelectric transducer), which travel through the material and reflect in the form of electrical signals and/or images for analysis when encountering an interface, such as a flaw or the opposite surface of the material. Figure 2 shows the basic principles of the IRIS technique. It is worth noting that the IRIS test has been positively validated for years by companies performing the tests and by companies contracting this form of inspection in tubular bundles. However, this is not the only NDT technique capable of inspecting carbon steel tubular bundles.
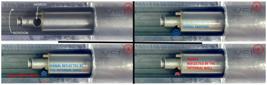
Schematic illustration of the basic principles of the IRIS technique with the sequence of propagation and reflection of a sonic pulse (image extracted from previous work to improve the reader’s understanding) [3].
To enhance the understanding of the IRIS technique, Saffiudeen et al. [4] presents a study on failure analysis in heat exchangers using this inspection method. The primary objective in this case was to assess wall thickness loss caused by corrosion in the tubes, as well as erosion and wear, to determine whether a partial or total retubing of the bundle would be necessary or not, thereby optimizing maintenance costs and downtime. The study was conducted on a floating head-type heat exchanger equipped with 286 tubes made of Inconel SB 163-800H alloy. Prior to inspection, the tubes underwent internal cleaning, and the IRIS system was calibrated according to ASTM E-470 standards [5]. Upon completion of the tests, defects such as corrosion and pitting were identified in 108 tubes. Based on the acceptance criterion defined by the client, which was the percentage of wall thickness loss, a decision was made to perform partial retubing of the bundle. This approach resulted in significant savings in both time and cost, allowing for a quicker return to operational status.
One of the challenges faced in tube inspection concerns the inspection speed and the accuracy in detecting discontinuities. In Tada and Suetsugu [6], a technology called Magnetic Flux Resistance (MFR) is presented as a high-speed and high-precision inspection method for heat exchanger tubes made of carbon steel. The primary focus is to enhance the efficiency of internal defect detection in tubes by employing electromagnetic techniques with improved resolution and reduced interference. To conduct the study, the authors compared the results obtained using MFR with those from more traditional techniques such as RFT, IRIS, and Magnetic Flux Leakage (MFL). Regarding inspection velocity, MFR, RFT and ECT exhibit comparable efficiency, each capable of examining more than five hundred tubes per day. By contrast, the IRIS operates at a significantly lower scanning speed. In terms of measurement accuracy, MFR performs on par with IRIS and consistently yields highly reliable data, whereas ECT and RFT tend to deliver comparatively lower accuracy. The technique enabled more precise identification of internal defects compared with the more conventional methods, demonstrating high-speed operation capabilities, being ideal for industrial environments requiring large-scale inspections. Additionally, a reduction in false positives and increased reliability of inspection data were observed. The experimental results further validated the effectiveness of the technology in detecting small discontinuities in carbon steel tubes. In conclusion, the MFR technique offers high sensitivity, speed, and accuracy, surpassing the limitations of conventional inspection methods.
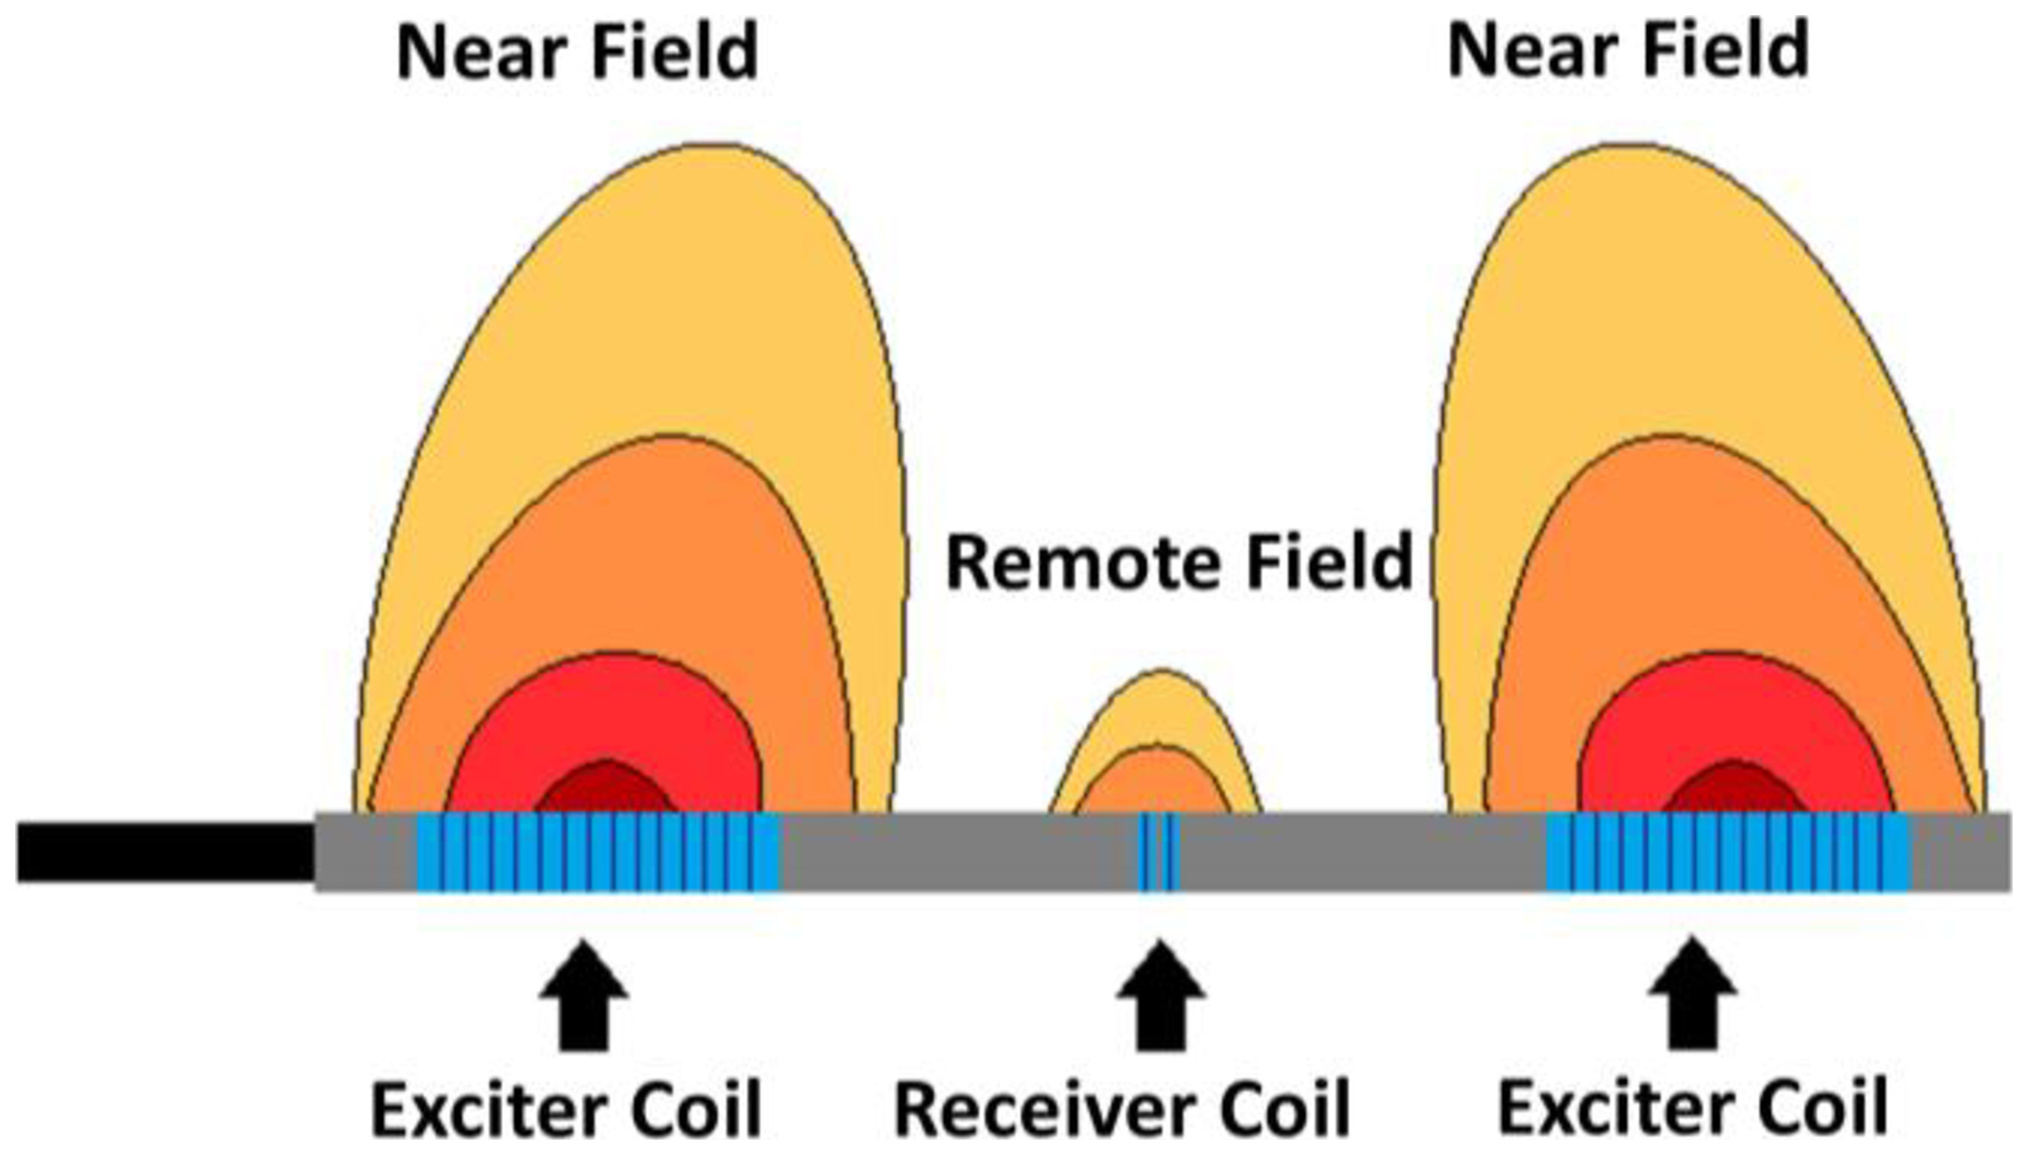
In this context, the RFT technique has gained significant interest from both the academic and industry communities due to its advantages over the IRIS method. Essentially, RFT is a magnetic NDT technique that uses eddy current concepts and remote field characteristics to detect discontinuities [7]. In physics terms, the ECT technique is based on electromagnetic induction generated with an alternating current flowing through a coil probe, creating a fluctuating magnetic field. When the coil is placed near a conductive material, this field induces eddy currents, which circulate within it, in turn, generating their own opposing magnetic field, which is detected by the probe and presented to the user by means of various complex signals. And it is primarily used for detecting surface and near-surface defects in conductive materials. Figure 3 illustrates the basic principles of the RFT technique with a dual driver probe (two exciter coils and two receiver coils), as applied in this work [8].
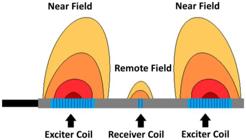
Schematic illustration of the basic principles of the RFT technique with a dual driver probe (two exciter coils and two receiver coils) (image extracted from previous work to improve the reader’s understanding) [3].
Depending on the type of discontinuity of interest one technique or another might be preferred, or they can be both even recommended or not. In this context, Table 1 shows the general possible applications of the IRIS and RFT methods. Despite its positive features, the RFT technique is not applicable to non-ferromagnetic tubes, which can be considered as a disadvantage, whereas the IRIS can be applied to a large variety of materials.
Studies by various authors have demonstrated the RFT ability to detect and characterize discontinuities (location, size [width, length and depth], shape/type, frequency of occurrence). As an example, Figueredo [10] conducted a study to assess the feasibility of combining IRIS and RFT techniques, with IRIS complementing RFT to enhance inspection coverage in heat exchangers and boilers during scheduled maintenance outages. The experimental setup involved four carbon steel tubes: two with a nominal external diameter of 19.05 mm and a wall thickness of 2.11 mm, and two with a nominal external diameter of 25.40 mm and a wall thickness of 2.11 mm. Two types of defects were evaluated: notches and groove-type flaws. Wall loss measurements were performed using a vernier caliper, a Ferroscope 204 for RFT, and a 9000 B-Scan system for IRIS. The results demonstrated good agreement among the techniques, with all methods successfully detecting and characterizing the defects, despite some discrepancies in sizing. It was concluded that a combined inspection strategy is viable: using RFT as a fast and practical screening method, followed by IRIS for detailed characterization and sizing of the most critical indications detected by RFT.
Similarly, Araujo and Silva [11] conducted a comparative study between these RFT and IRIS on carbon steel tubes. In this case, the authors detected discontinuities in the same longitudinal positions along the tubes, demonstrating that the IRIS technique requires more thorough cleaning than the RFT case, which is one of the main advantages typically claimed for the RFT method. Additionally, RFT offers good sensitivity in detecting volumetric discontinuities resulting from corrosion, erosion, and abrasive wear, and other forms of material loss [12].
In the same line, van Name et al. [13] conducted a study on the phenomenology involved in the ECT and RFT methods for condensers and heat exchangers. Such work provides important information about both techniques, considering the basic types of coils and their arrangements, emphasizing that the main difference between them lies in the distances between the coils and the type of material to be tested: ECT for non-ferromagnetic materials and RFT specifically for ferromagnetic materials. Another crucial point evaluated in such a study was the need for correct calibration of the respective systems to ensure functionality and sensitivity during the inspection. More recently, Jayaraman et al. [14] conducted a numerical modeling study using RFT for 9Cr-1Mo modified steel tubes with the addition of stabilizing elements used in steam generators operating in radioactive environments at high pressure and temperature. Simulations were carried out to investigate the influence of adjacent tubes and analyze the stresses indicative of pitting and localized discontinuities. It was concluded that the signal stress level varies depending on the volume of material loss, with pitting discontinuities generating higher stresses. Finally, it was found that adjacent tubes do not produce measurable differences in the signal generated.
In another study, Kako et al. [15] evaluated the applicability of the RFT technique for detecting external flaws in cooling tubes in the blanket of an experimental fusion reactor. The main analysis in this case was related to the length of notch-type discontinuities with varying depths, and it was observed that the ability to identify a discontinuity is related to its geometry.
More recently, Wang et al. [16] conducted research on using the RFT technique to detect hidden defects in riveted components used in aircraft. Experimental tests and numerical simulations were carried out to assess discontinuities with dimensions of 10 mm × 02 mm × 1 mm (length x width x depth) can be detected and characterized. The authors concluded that the technique was able to detect discontinuities at a maximum depth of 9 mm from the surface. It is worth mentioning that the manufacturer of the RFT equipment used in such a study provides tables comparing various inspection techniques for tubes and their capabilities for detecting pitting and generalized corrosion discontinuities, highlighting that the technique is not recommended for detecting cracks.
Also recently, Ferraresi et al. [3] conducted RFT tests on carbon steel tubes with artificial (machined) flaws and inspected them with different frequencies for the probe in the absolute and differential channels. A better adequacy was found to be with the channels set at different frequencies, and the most appropriate values must be determined at the time of the test considering variations in the tubes, especially in terms of magnetic permeability. In comparison with the IRIS, the RFT test, despite not intrinsically allowing the sizing of flaws, has been shown to be much faster in terms of scanning execution and with similar detection capability. However, the equivalency between the RFT and IRIS tests must be verified in actual heat exchangers and based on better sampling, as the present work proposes to implement.
Therefore, it is clear that RFT has the necessary attributes for application in tubular bundles used in refineries. However, it is also evident that one of the significant challenges when using this technique lies in the clear understanding and statistical interpretation of its signals, which are necessary for making inferences about the structural integrity of the industrial assets being monitored. As informally reported by personnel in the field, these challenges currently limit the RFT utilization. In this sense, the objective of this work is to contribute to the development of a numerical methodology using modern statistical tools for analyzing NDT data, with a focus on predicting the structural integrity of heat exchangers commonly used in refineries. At the end, it is expected to show that the RFT method can be as capable as the IRIS technique for examining tubes of heat exchangers.
For demonstration of the proposed methodology, inspection data from a caron steel tubular bundle of a Shell & Tube heat exchanger (provided by an oil refinery) was used. To assess the degree of influence of the measurement process through RFT and its respective detection and characterization capabilities, a statistical analysis of inspection data from three inspectors (with different levels of experience) was conducted. Subsequently, considering the results obtained by IRIS and 3D Scanning (a destructive test applied to some tubes) as true values, a statistical comparison was made between the global results of the techniques to demonstrate their equivalence. Finally, the accuracy provided by the RFT inspectors and between the RFT and IRIS techniques was evaluated using artificial intelligence classification tools available in MATLAB commercial code MathWorks [17], verifying the error and accuracy percentages of corrosion data via RFT considering the IRIS data as the reference basis.
2. NDT Methods Utilized
2.1. Brief description of the IRIS and RFT tests
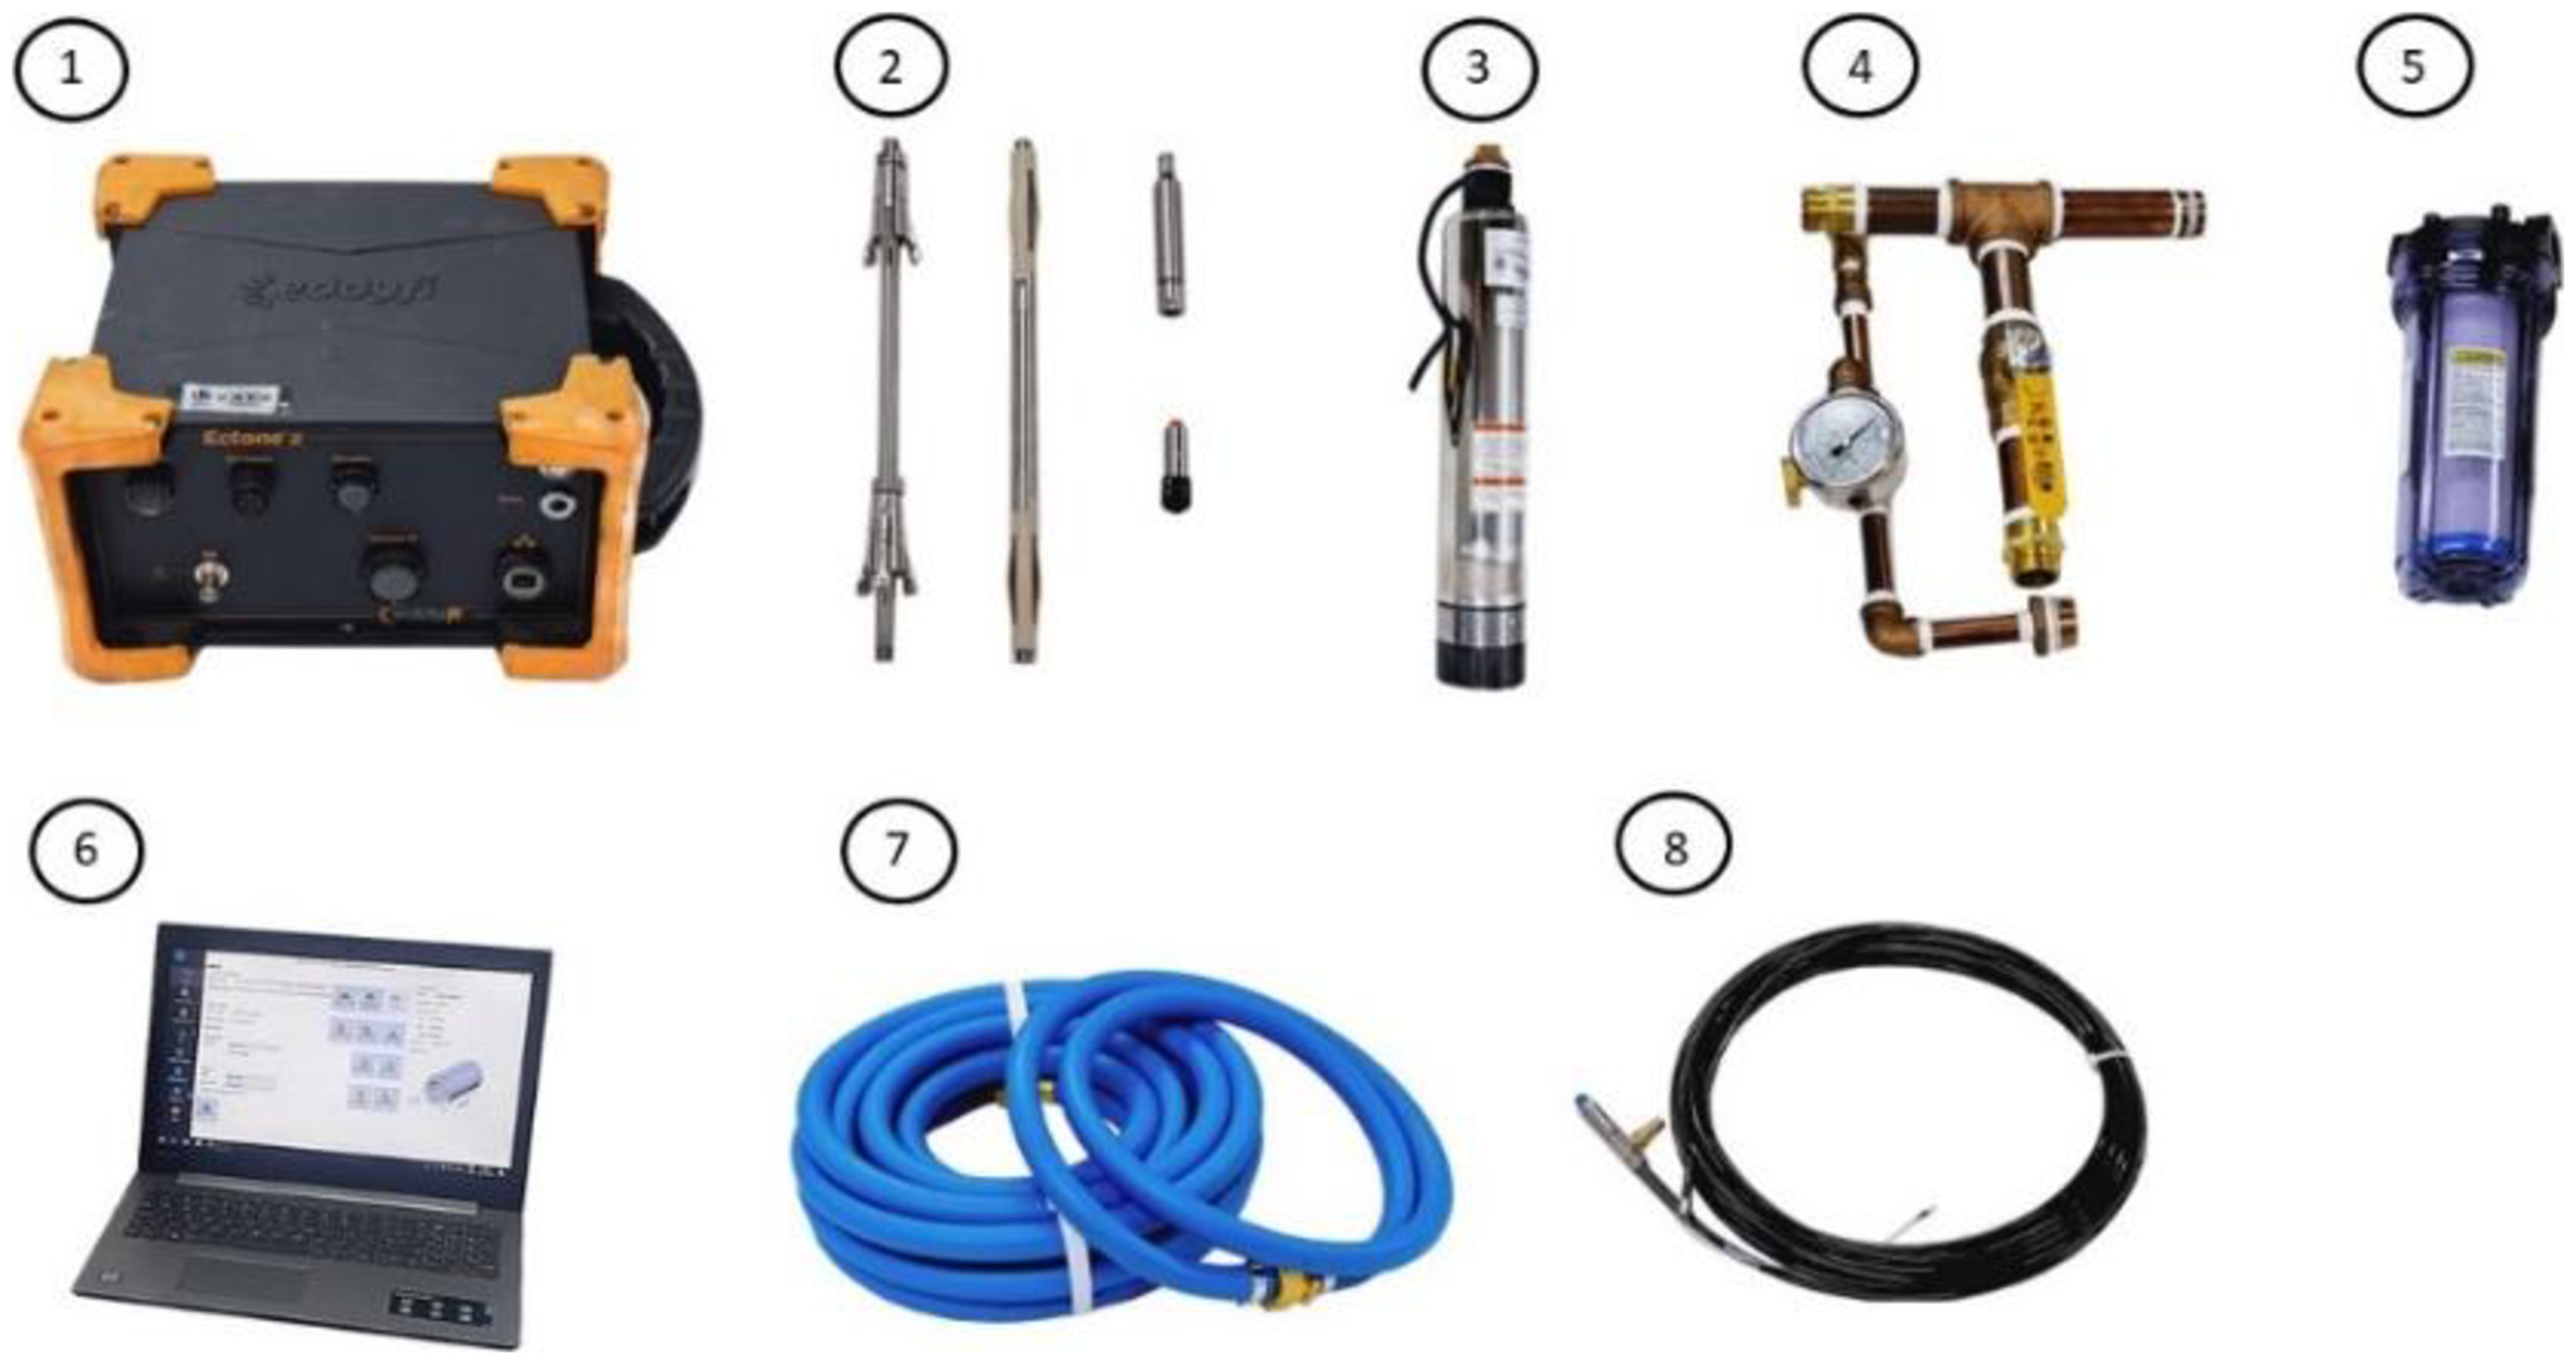
In simplified terms, to conduct the IRIS test, the respective probe is inserted into the tube using water as coupling element to transmit ultrasonic pulses to its internal wall. Part of the resulting sonic energy is absorbed by the metal and then travels to the tube external wall, subsequently returning to the IRIS probe for proper signal processing to estimate the remaining wall thickness. Further details on this technique can be found in Ornelas [18]. Figure 4 lists the basic equipment required for performing the IRIS test (and employed in this work), noting that a connection for power supply and another one for a constant flow of clean water must be available.
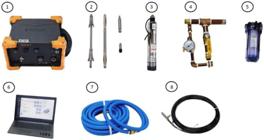
Equipment required for the IRIS test and as employed in this work: (1) Test module; (2) Rigid probe and ultrasonic transducer; (3) Water pump; (4) Manometer and valve; (5) Water filter; (6) Computer with the appropriate software; (7) Water hose; (8) Signal and water conduit.
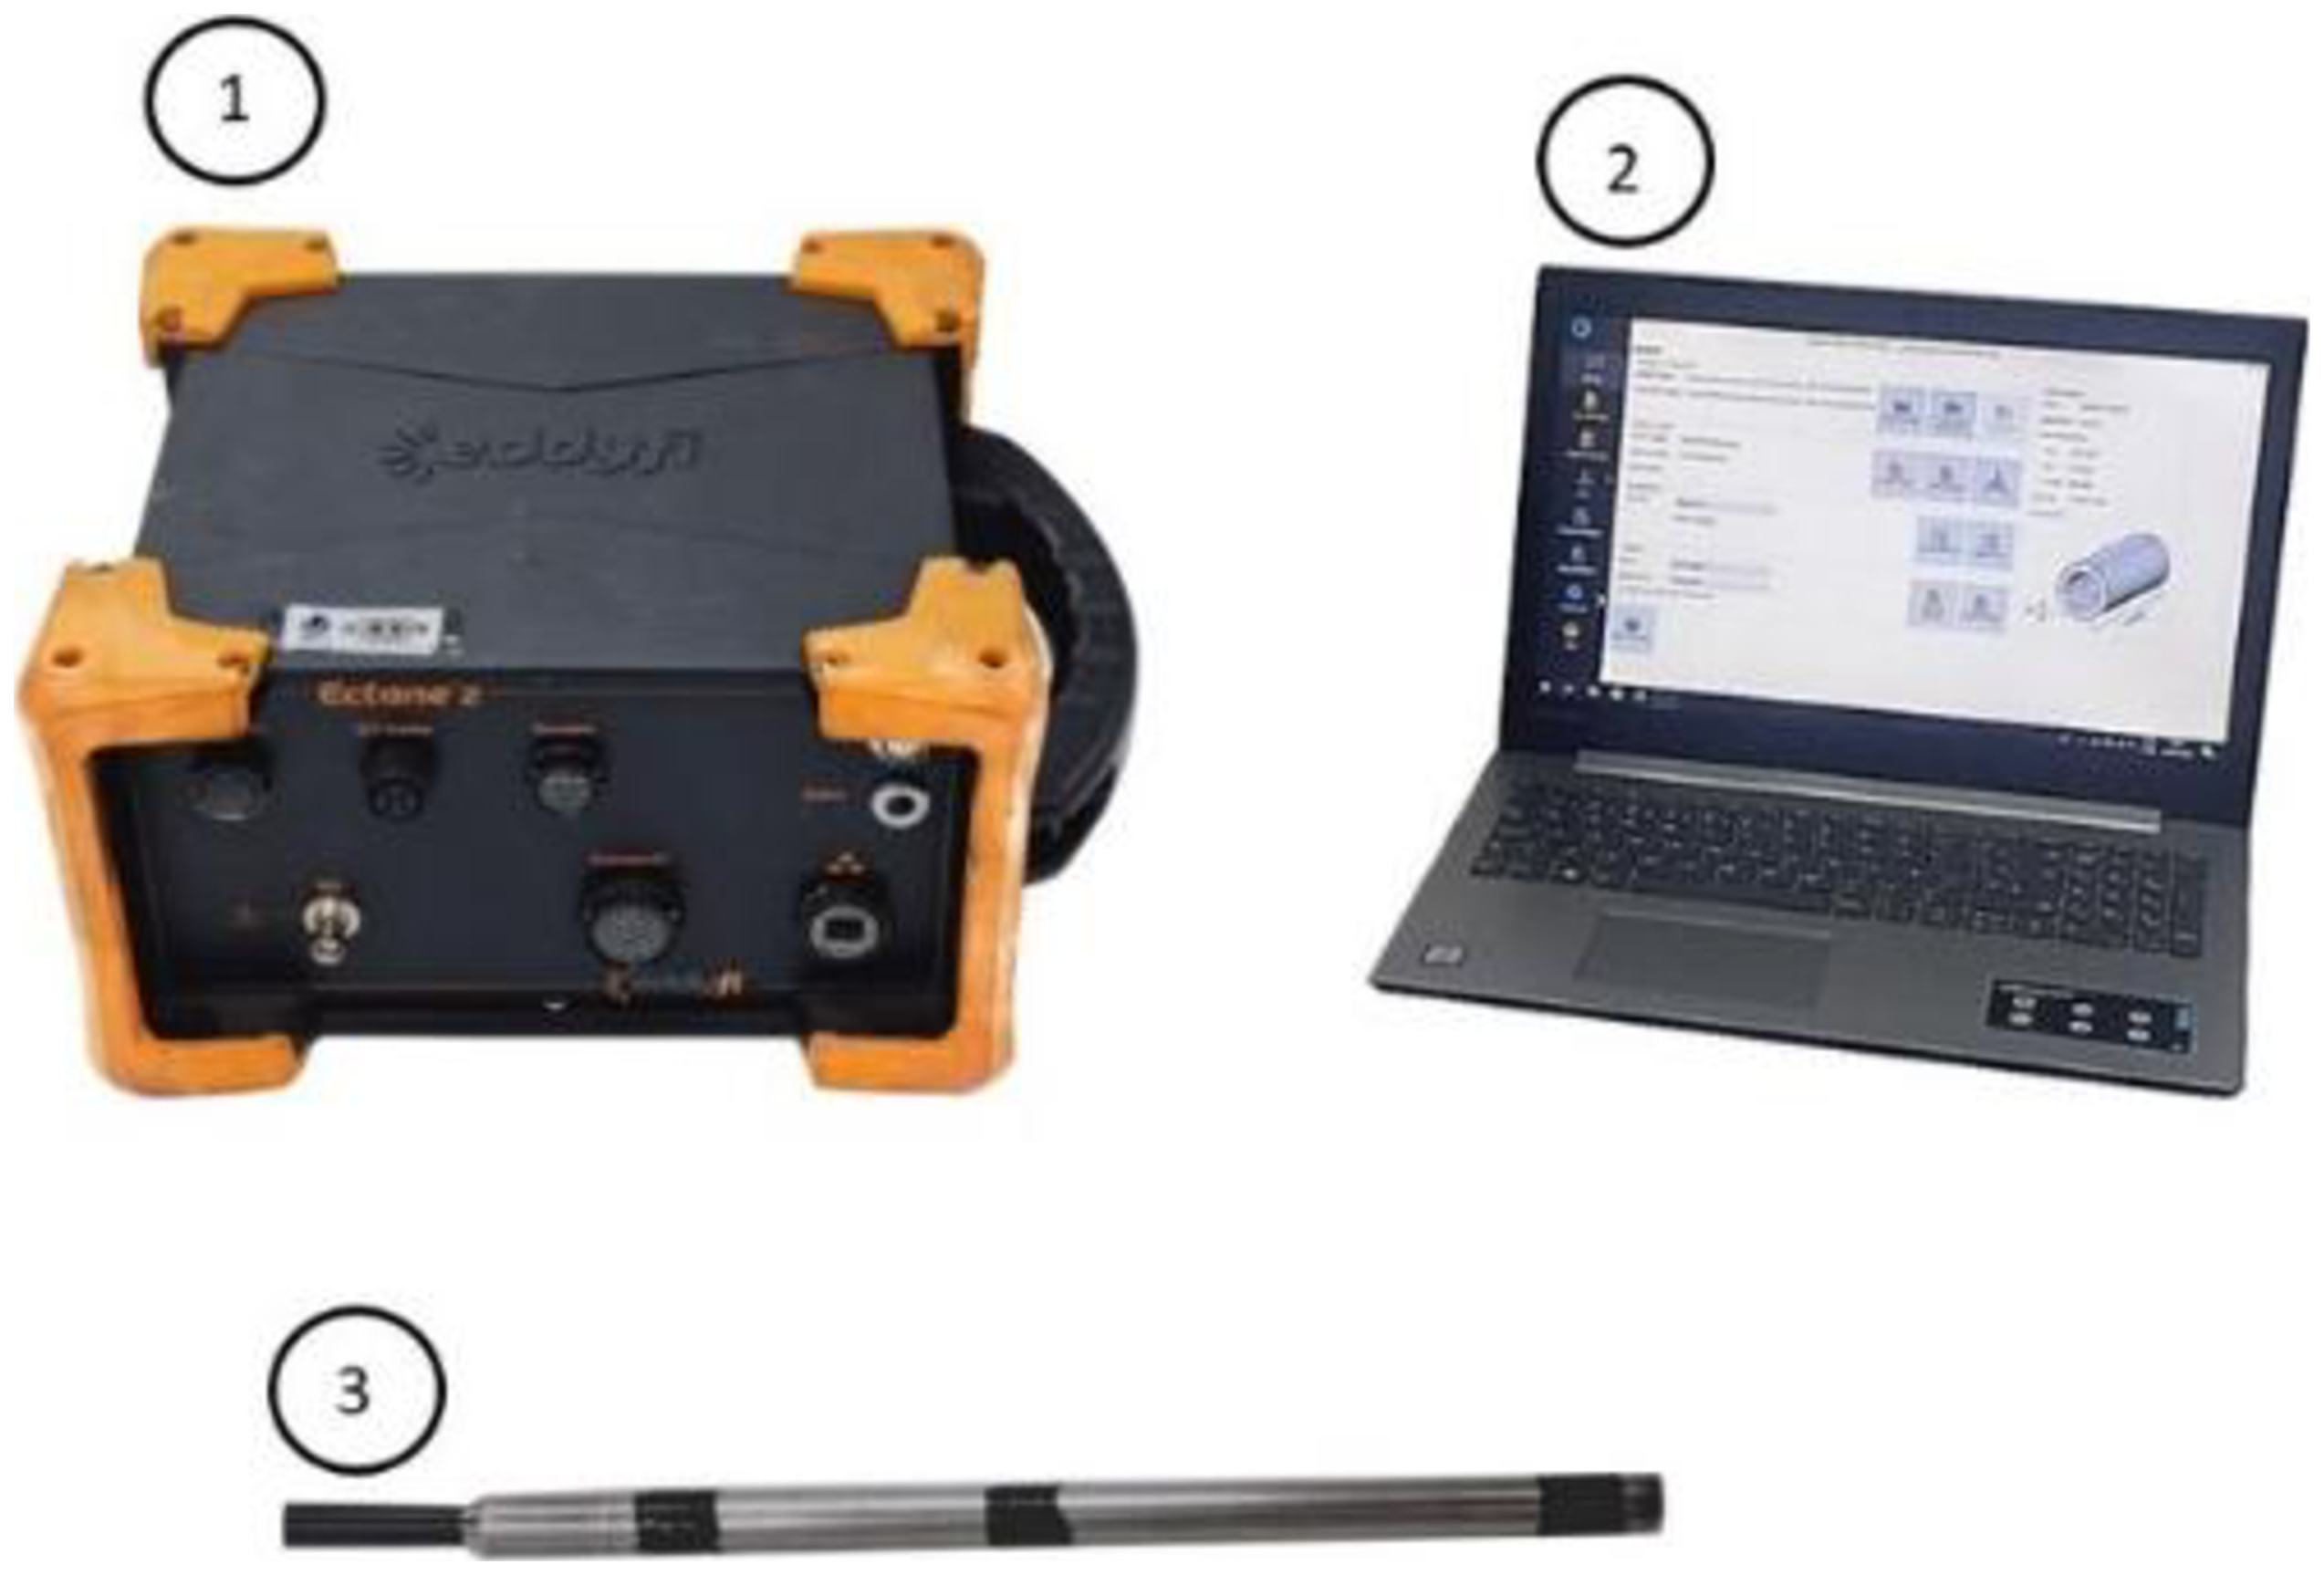
For the RFT test, the respective probe with an exciter coil is inserted into the tube, which, when energized with a low frequency alternating current, generates a magnetic field that induces circular eddy currents in the tube wall. These currents generate a second magnetic field that propagates axially through the tube until it reaches one (absolute probe) or two (differential probe) receiver coils located at a distance greater than twice the external diameter of the tube itself [19]. Figure 5 lists the equipment necessary for conducting the RFT test (and as employed in this work), which also requires a connection for power supply.

Equipment required for the RFT test and as employed in this work: (1) Test module; (2) Computer with appropriate software; (3) Rigid probe.
Table 2 provides a direct comparison of the equipment and accessories required for performing IRIS and RFT tests. As observed, compared with the IRIS case, the RFT test is generally simpler, requiring only three components for execution and not dependent on the use of water.
2.2. Main Characteristics of the IRIS and RFT tests
The main characteristics of the IRIS test are:
-
A continuous water supply is required since the tube must remain constantly flooded with a coupling medium (low acoustic impedance) to ensure efficient transmission of the sonic wavefront from the probe and to drive the probe turbine, thus scanning the entire length of the tube (ultrasonic transducer rotation plus probe translation along the tube);
-
It can be performed on ferromagnetic and non-ferromagnetic materials;
-
The probe has centralizers to maintain the sonic focus at an equidistant position along the circumference and length of the tube so that the signal perpendicularly hits the tube walls, reflects back, and is captured by the transducer for processing in the test module software;
-
The probe movement (test scanning) is done at a low speed;
-
A high fill factor is required, meaning that the probe must nearly fill the tube in its entirety;
-
A high degree of tube cleaning is required, usually with hydroblasting ranging from 10 to 40 ksi, depending on the level of incrustation found on the internal walls;
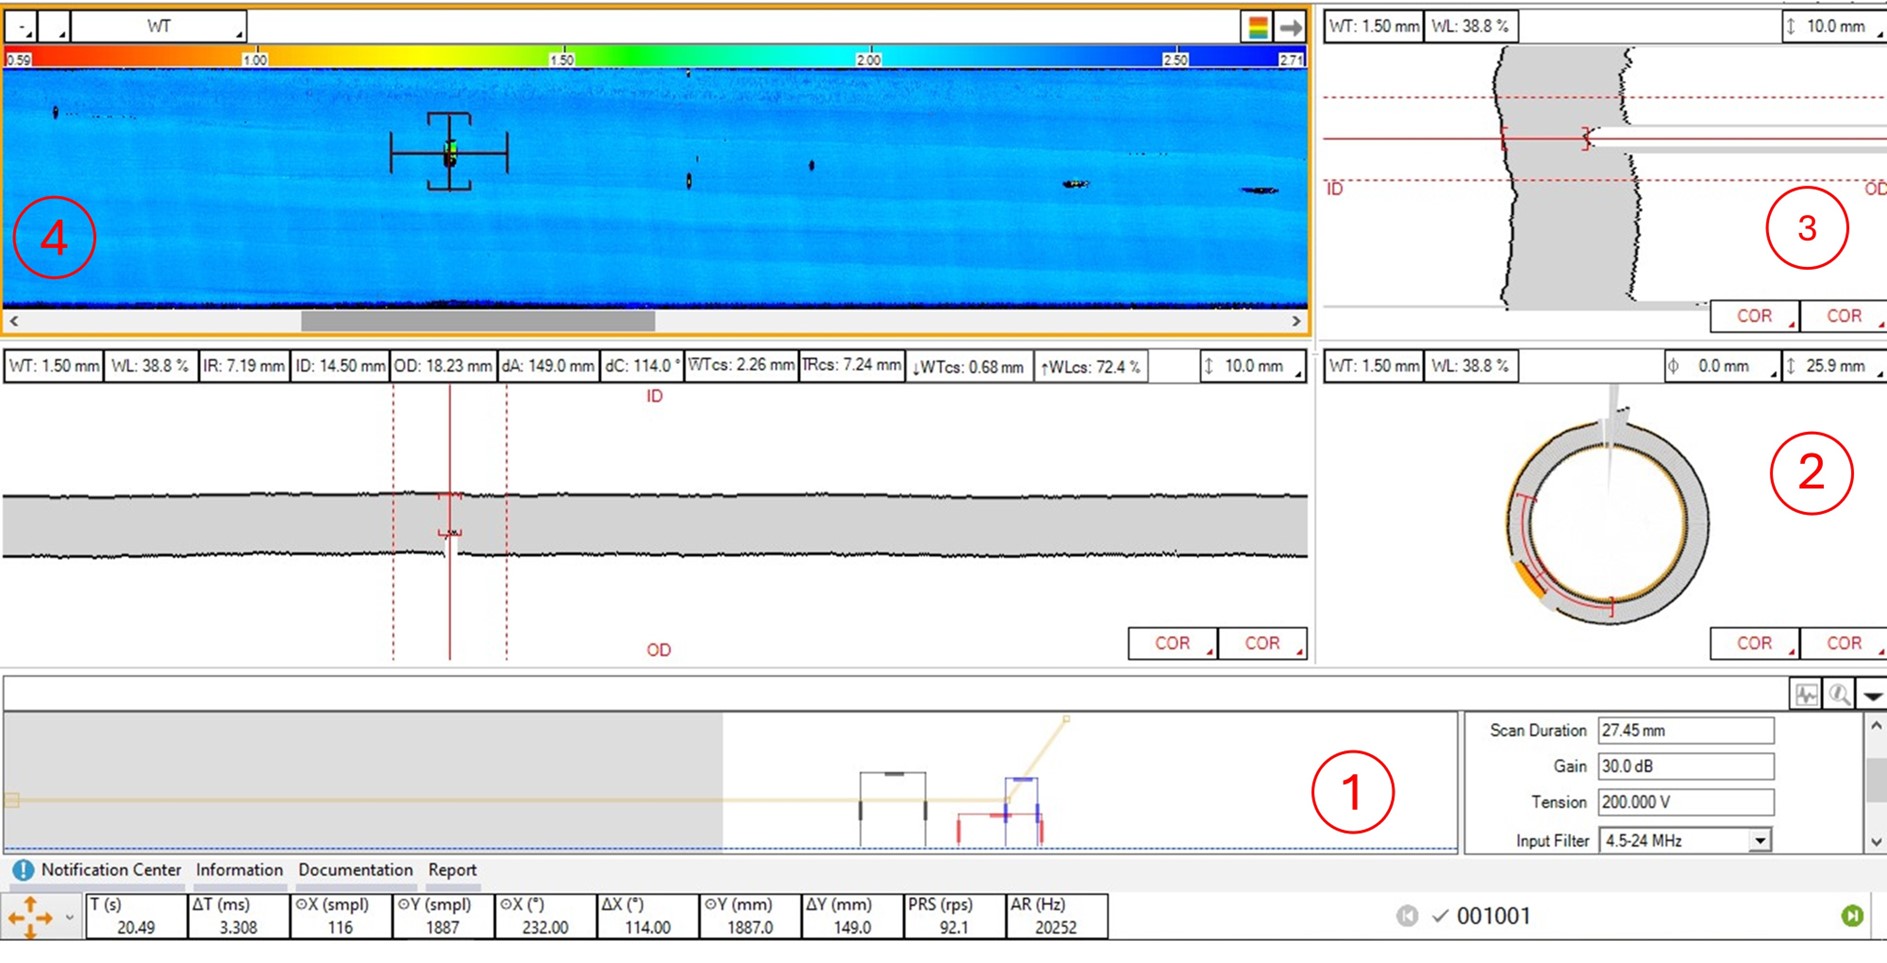
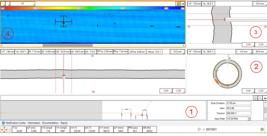
• The inspector can determine and evaluate discontinuities during the test. Figure 6 shows a typical screen presented to the inspector by the IRIS software. As seen, the IRIS technique can display the raw signal (A-Scan - 1), the tube radial section (B-Scan – 2), the flattened radial section (D-Scan – 3), and a heatmap image (C-Scan – 4), highlighting the locations of the discontinuities identified. These different ways of visualizing the inspected area provide the inspector with greater confidence in characterizing a specific discontinuity. Additionally, it is possible to know whether the material loss is at the tube internal or external wall side.
The main characteristics of the RFT test are:
-
Performed in a dry approach but only on ferromagnetic materials, as it is a magnetic technique;
-
It has a low fill factor and does not require centralizers for the probe;
-
The probe movement can be performed at higher speeds, for example, above 250 mm/s;
-
A moderate level of tube cleaning is required, typically with hydroblasting between 10 and 40 ksi, depending on the level of incrustation on the internal walls;
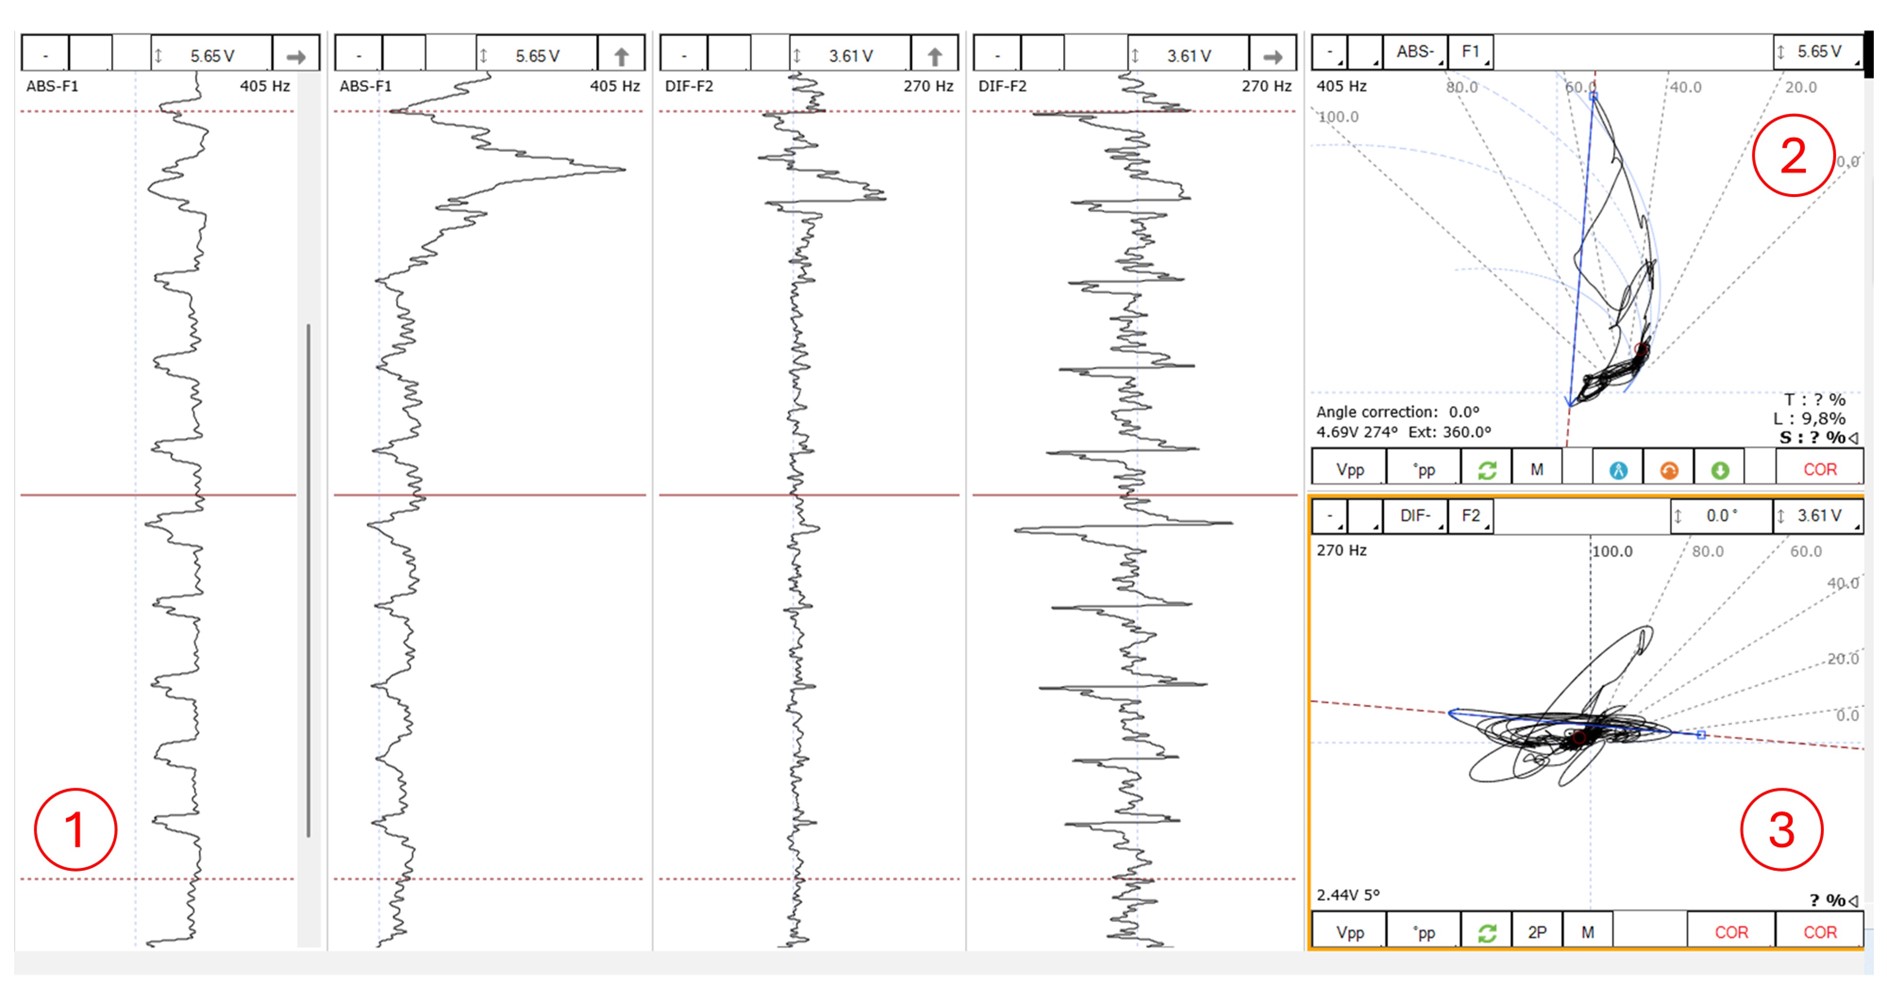
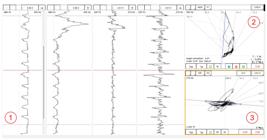
• The entire length of the tube must be scanned before performing the inspection (for determination and evaluation of discontinuities), meaning the scanning and inspection stages occur separately. As illustrated in Figure 7, the signal generated by the RFT method can be viewed by the inspector in three different ways: (1) voltage over time, also known as Strip Chart, which is based on visualizing the real and imaginary parts of the magnetic signal received; (2) a direct (absolute) signal and a differential signal; and (3) voltage planes, where it is possible to visualize the signal amplitude and phase angle. Due to this way of presentation, there is a certain degree of difficulty in correctly visualizing and interpreting these signals to characterize a specific discontinuity and make inferences about the integrity of a tube. Thus, the RFT technique does not allow the inspector to detail any indication during the scanning, requiring a new scanning if necessary. Moreover, it is not possible to determine whether the material loss is at the tube internal or external wall sides.
2.2. Typical Inspection Reports with the IRIS and RFT tests
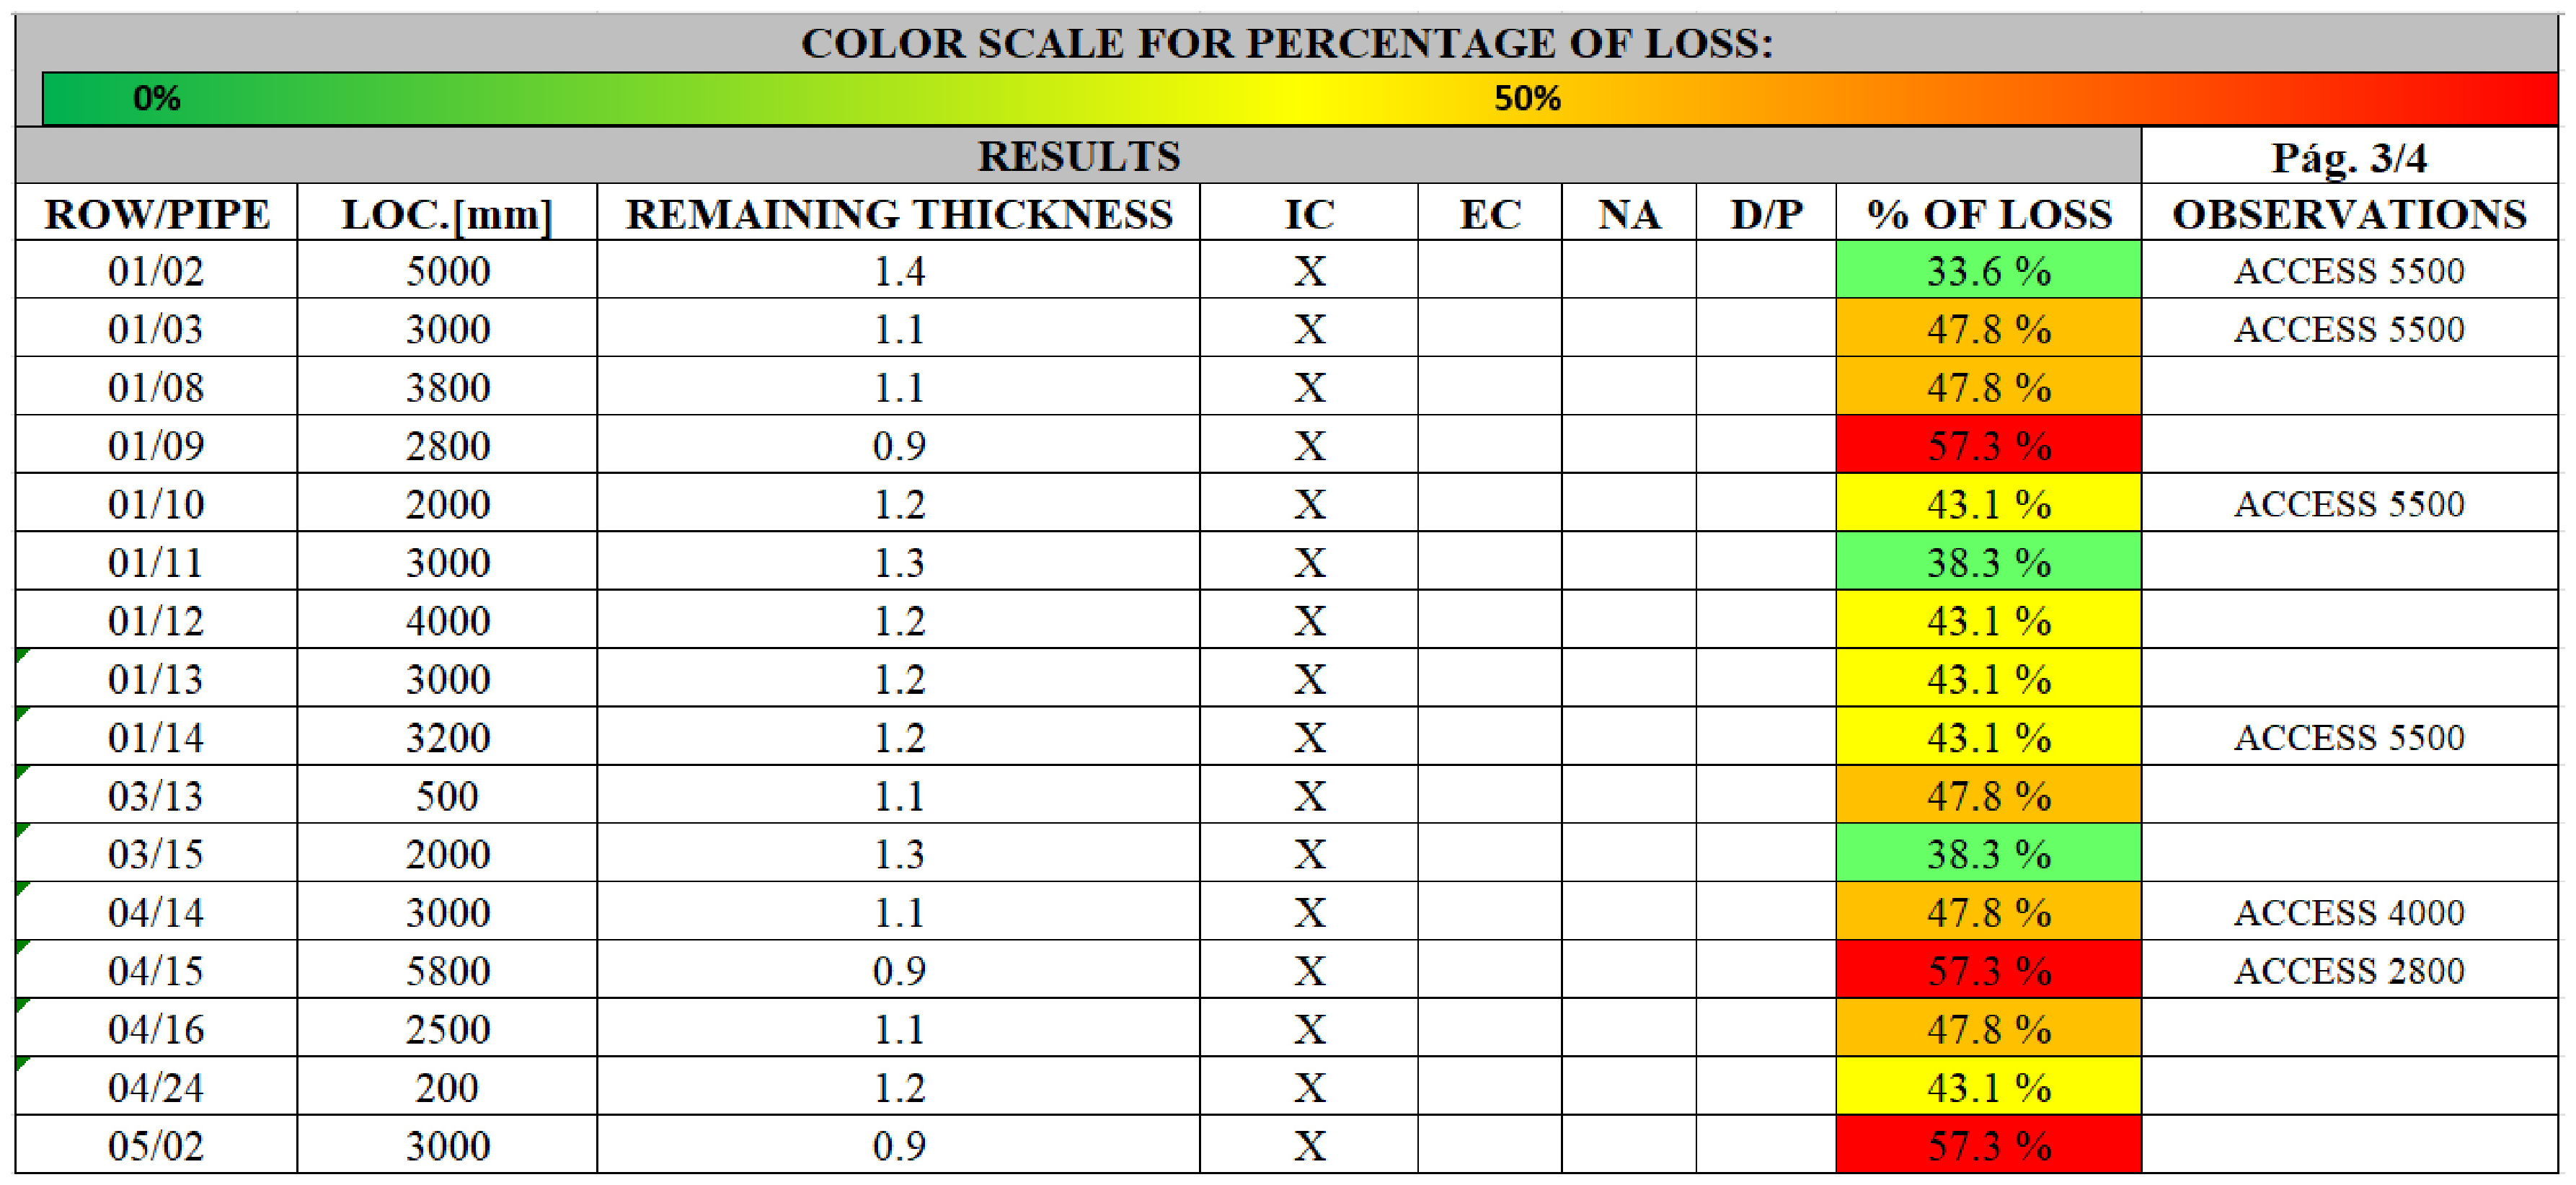
In general, the IRIS test provides the absolute value of the remaining wall thickness, meaning a direct measurement of the wall of the tube being inspected. Figure 8 shows part of typical IRIS data as presented in an original inspection report with the remaining wall thickness directly presented. It is also possible to visualize the percentage of wall loss due to corrosion, calculated from a reference value for the tube nominal thickness. Another characteristic of the IRIS report is the indication of whether the corrosion is developing internally or externally on the tube. Additionally, the locations of corrosion occurrences along the tubes are identified.
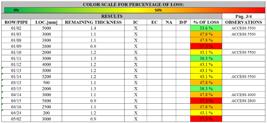
Part of a typical inspection report as generated by and directly extracted from an IRIS test (remaining thickness in mm).
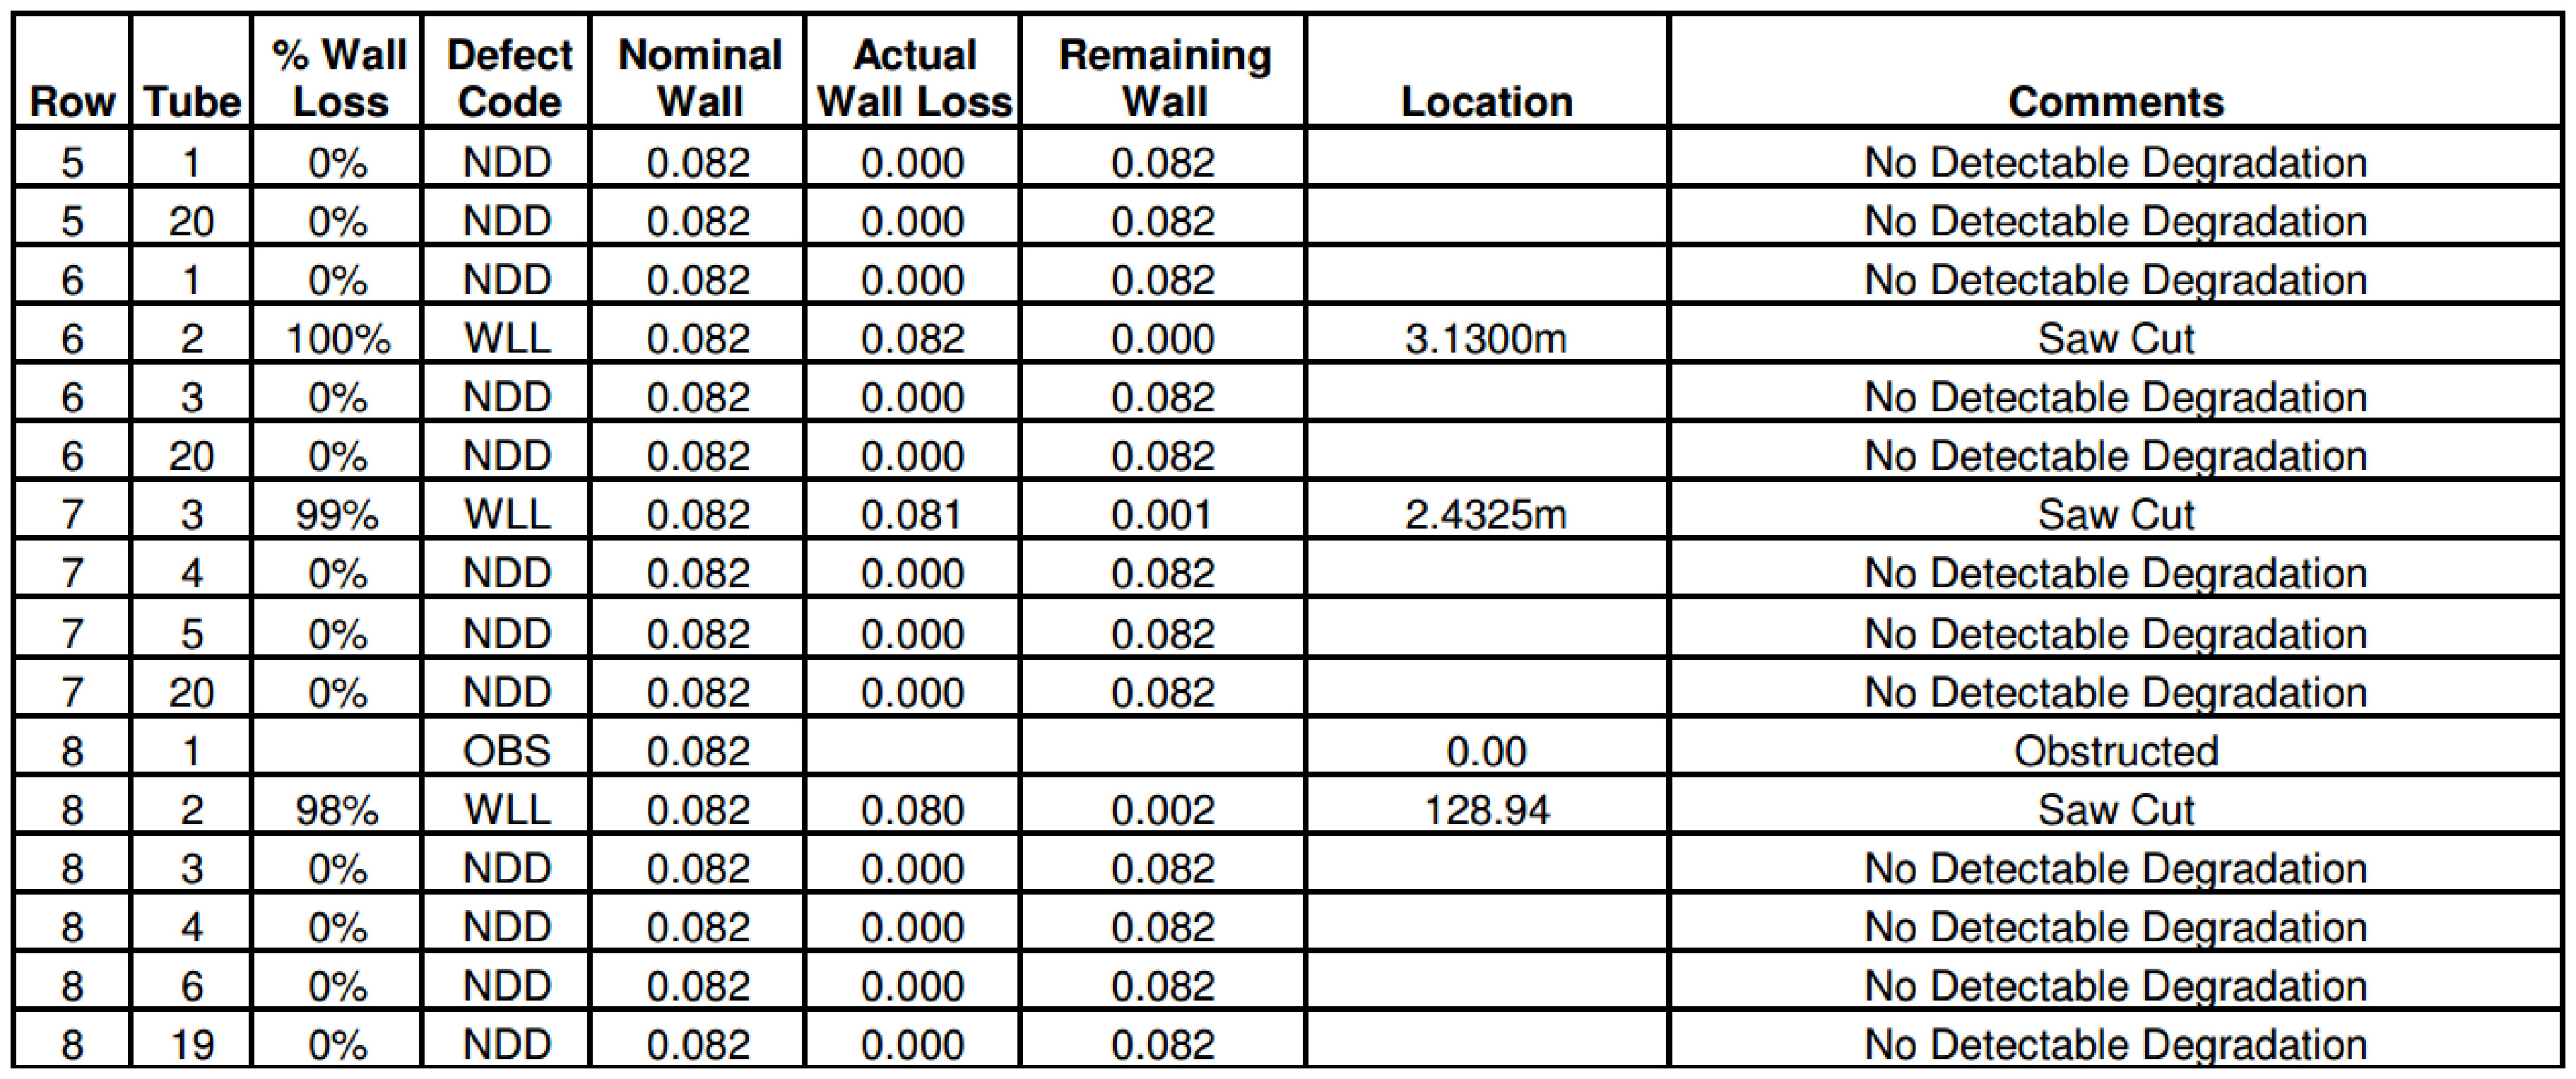
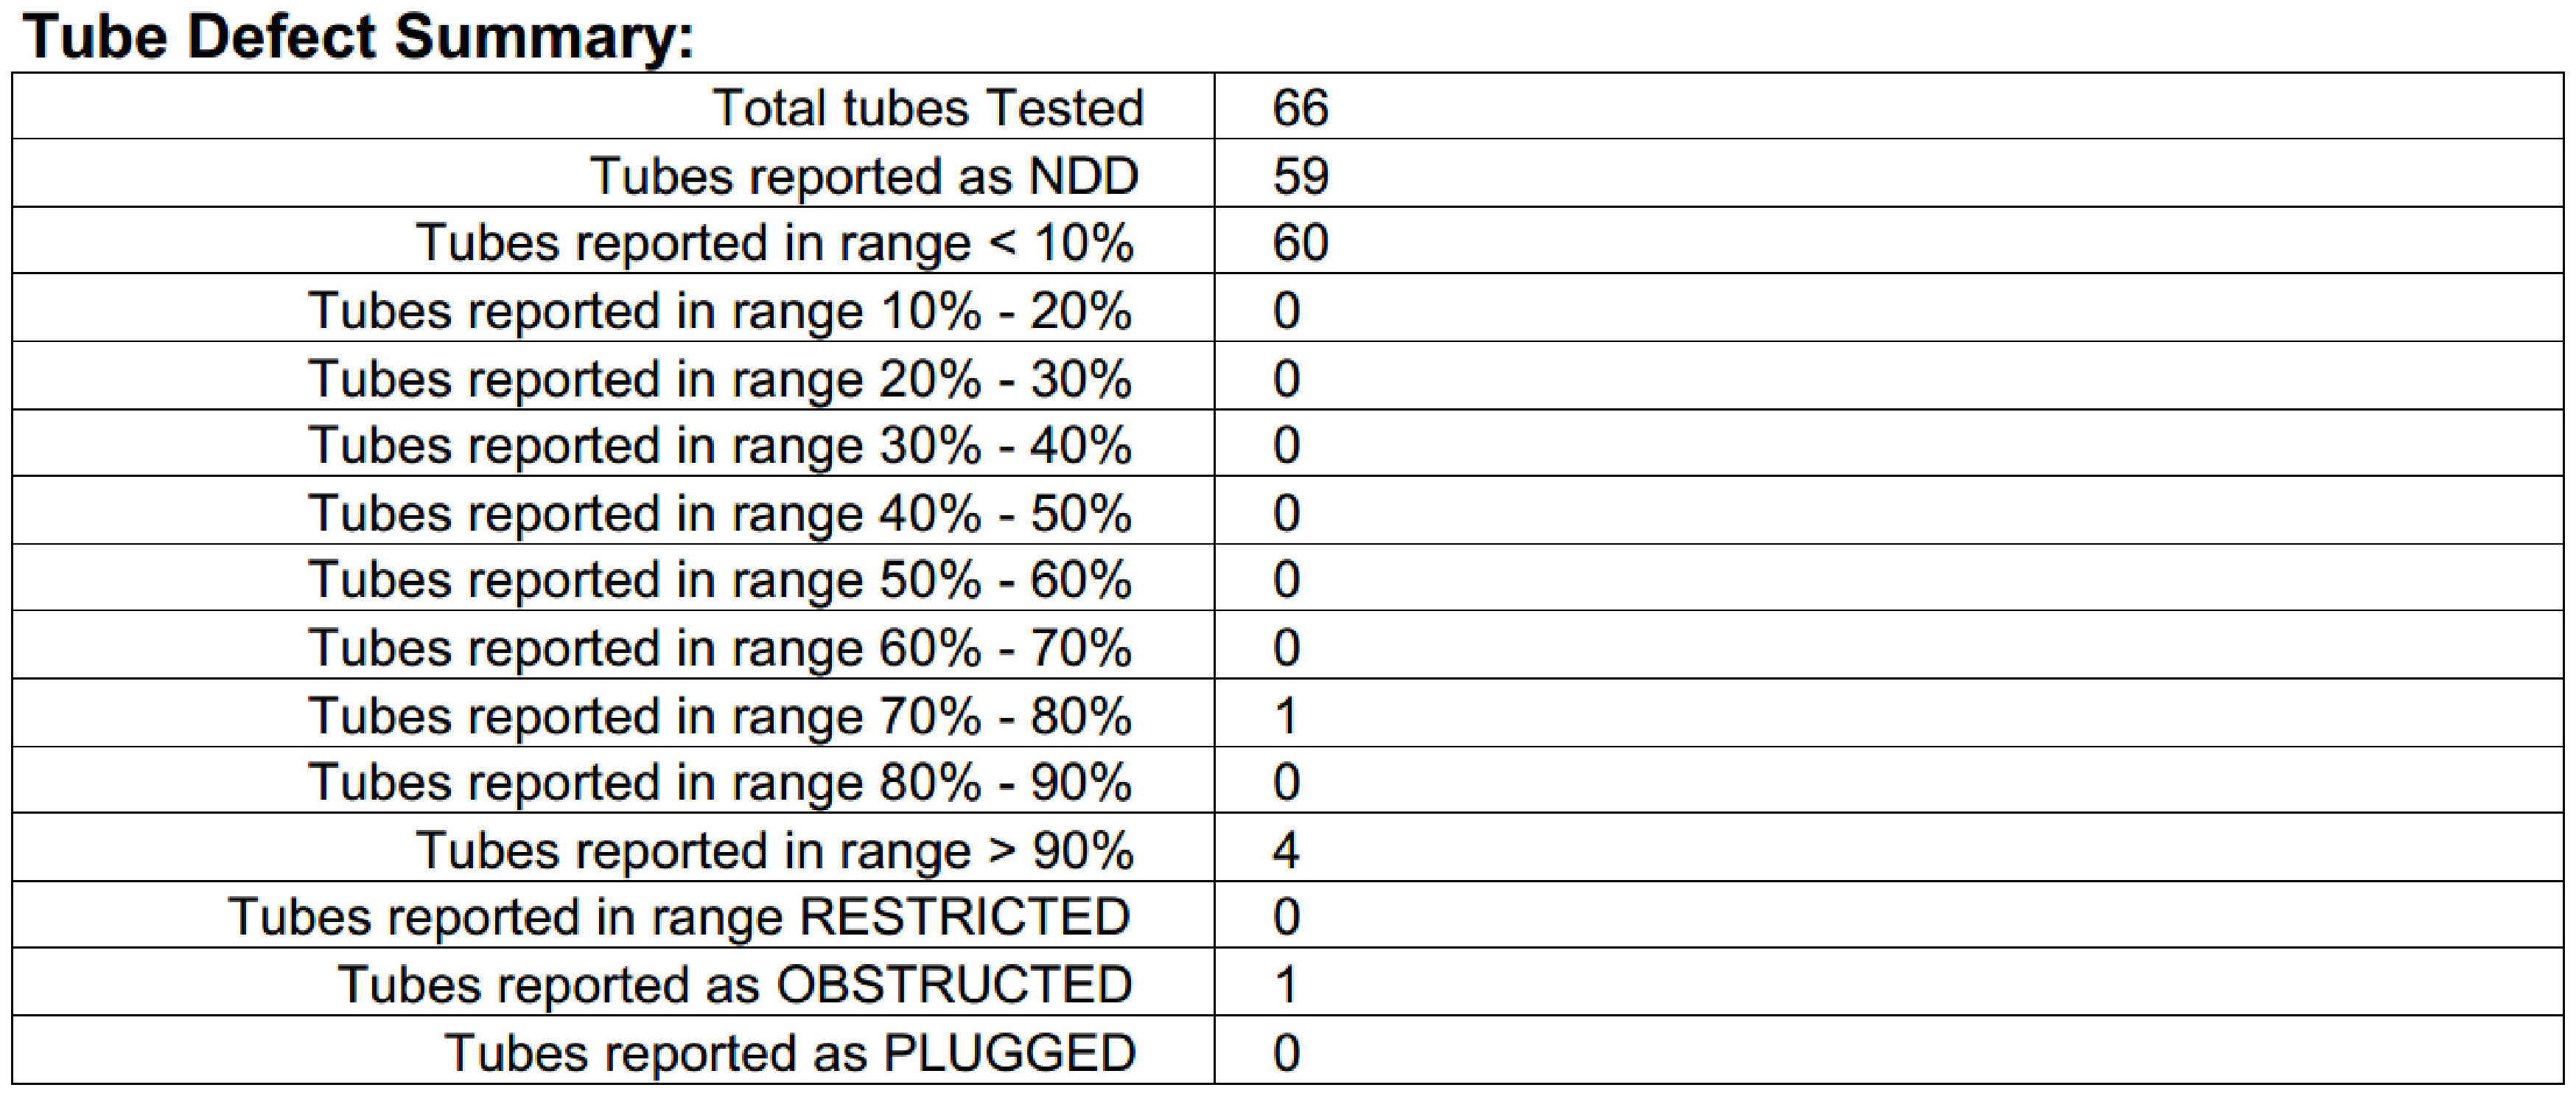
On the other hand, the RFT test provides a relative result of wall thickness loss, always based on a given reference. In other words, the remaining wall thickness (which is what matters for continued safe operation of the asset) is determined indirectly. Figure 9 illustrates part of typical RFT data as presented in the original inspection report. It can be noted that it is impossible to identify whether the corrosion occurs internally or externally on the tube, as the magnetic technique does not allow this type of visualization. However, like the IRIS case, the longitudinal locations of corrosion are also provided. In addition to the information shown in Figure 9, a summary is also presented in Figure 10 showing the number of tubes found in various corrosion ranges (as exactly presented in the original RFT inspection report).
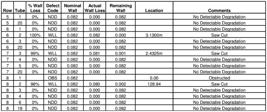
Part of a typical inspection report as generated by and directly extracted from a RFT test (nominal, actual, and remaining wall in mm).
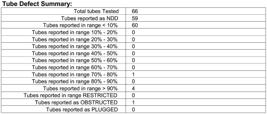
Summary of corrosion ranges found in tubes in a typical inspection report as generated by and directly extracted from RFT test.
2.3. Experimental methodology
In this study, field inspections were carried out using the IRIS, RFT, and 3D Scanning techniques on a carbon steel tubular bundle as the one shown in Figure 1. It consisted of 1024 tubes, each 6 m long, with a nominal wall thickness of 2.11 mm and an external diameter of 19.05 mm, all supported by 2 mirrors at each end and 12 baffles distributed along the equipment length.
In terms of the comparative analysis of the inspection techniques, a set of 16 tubes with various types of discontinuities was selected to be tested with each one of them. Initially, discontinuities were located and identified based on their longitudinal positions using the RFT test. Subsequently, the IRIS test was applied to inspect the same discontinuities, considering the previously identified longitudinal positions. Finally, a destructive test was conducted by sectioning samples at the points of interest (at the same positions indicated by the RFT test) and measuring them via a 3D Scanner (Creaform HandySCAN 3D Black Series). For analyzing the discontinuity data from the 3D Scanner-generated meshes, the VxElements software provided by the same manufacturer was used. Thus, the same discontinuities in the same set of tubes were examined by the three distinct inspection techniques.
To evaluate the operation of the RFT test, three inspectors with different levels of theoretical and practical knowledge of the technique were selected to analyze the inspection data. Inspector 1 is considered an RFT specialist, possessing the highest level of knowledge regarding test execution and data analysis. Inspector 3 is considered to be newly trained with the least knowledge/experience, while Inspector 2 has an intermediate level of knowledge/experience on the RFT technique. All RFT tests were conducted under the following conditions: Dual Driver PRBT-RFT-DDST ABS/DIF RFT probe and Ectane 2 test module from Eddyfi; excitation frequencies in the DIF and ABS channels at 680 Hz and 500 Hz, respectively; amplitude at 10 V; acquisition frequency at 1000 Hz; probe moving speed at 300 mm/s; gain in the ABS channel at 46 dB; gain in the DIF channel at 46 dB; cutoff filter in the ABS channel at 12 Hz; and cutoff filter in the DIF channel at 12 Hz.
The IRIS test was performed by a certified company (Qualyend Engenharia e Inspeção LTDA) using the procedure normally employed for inspecting bundles of the same type for oil and gas plants. The test conditions were as follows: Procedure PT-CQ-IRIS-05; ABNT NBR 16342/2015 1st Ed. [2]; standard tube Ø19.05x2.11 mm – C.S.; 14.5 mm centralizer; Eddyfi P-757 probe; Ectane 2 test module from Eddyfi; primary gain at 28 dB; turbine mirror at 45°; 12 mm turbine; IRIS 07 PAT.381 equipment; normal type transducer; sound velocity at 5,920 m/s; transducer frequency at 15 MHz; resolution of 0.1 mm or 5% of the tube’s 2.11 mm wall thickness. It is important to highlight that the IRIS system was calibrated using a standard tube with a 2.11 mm wall thickness and with the same metallurgical and dimensional characteristics of the tubular bundle to be inspected, further validated by performing a dimensional test with a digital vernier caliper.
To assess the influence of the RFT inspectors’ knowledge/experience level, the result of the largest discontinuity found by each one of them in each tube (a total of 236 tubes tested by each inspector) was considered. In other words, the discontinuity found in each case is not necessarily the same for each inspector. This allowed for a global assessment of the tubular bundle and verification of whether there was a tendency to detect and characterize the same discontinuities by the different inspectors. Then, a comparative analysis was conducted between the results obtained by the IRIS and RFT techniques. In this case, the results from Inspector 1 (considered the specialist) were used in terms of the mean and standard deviation of the results from each technique, analyzing their interaction.
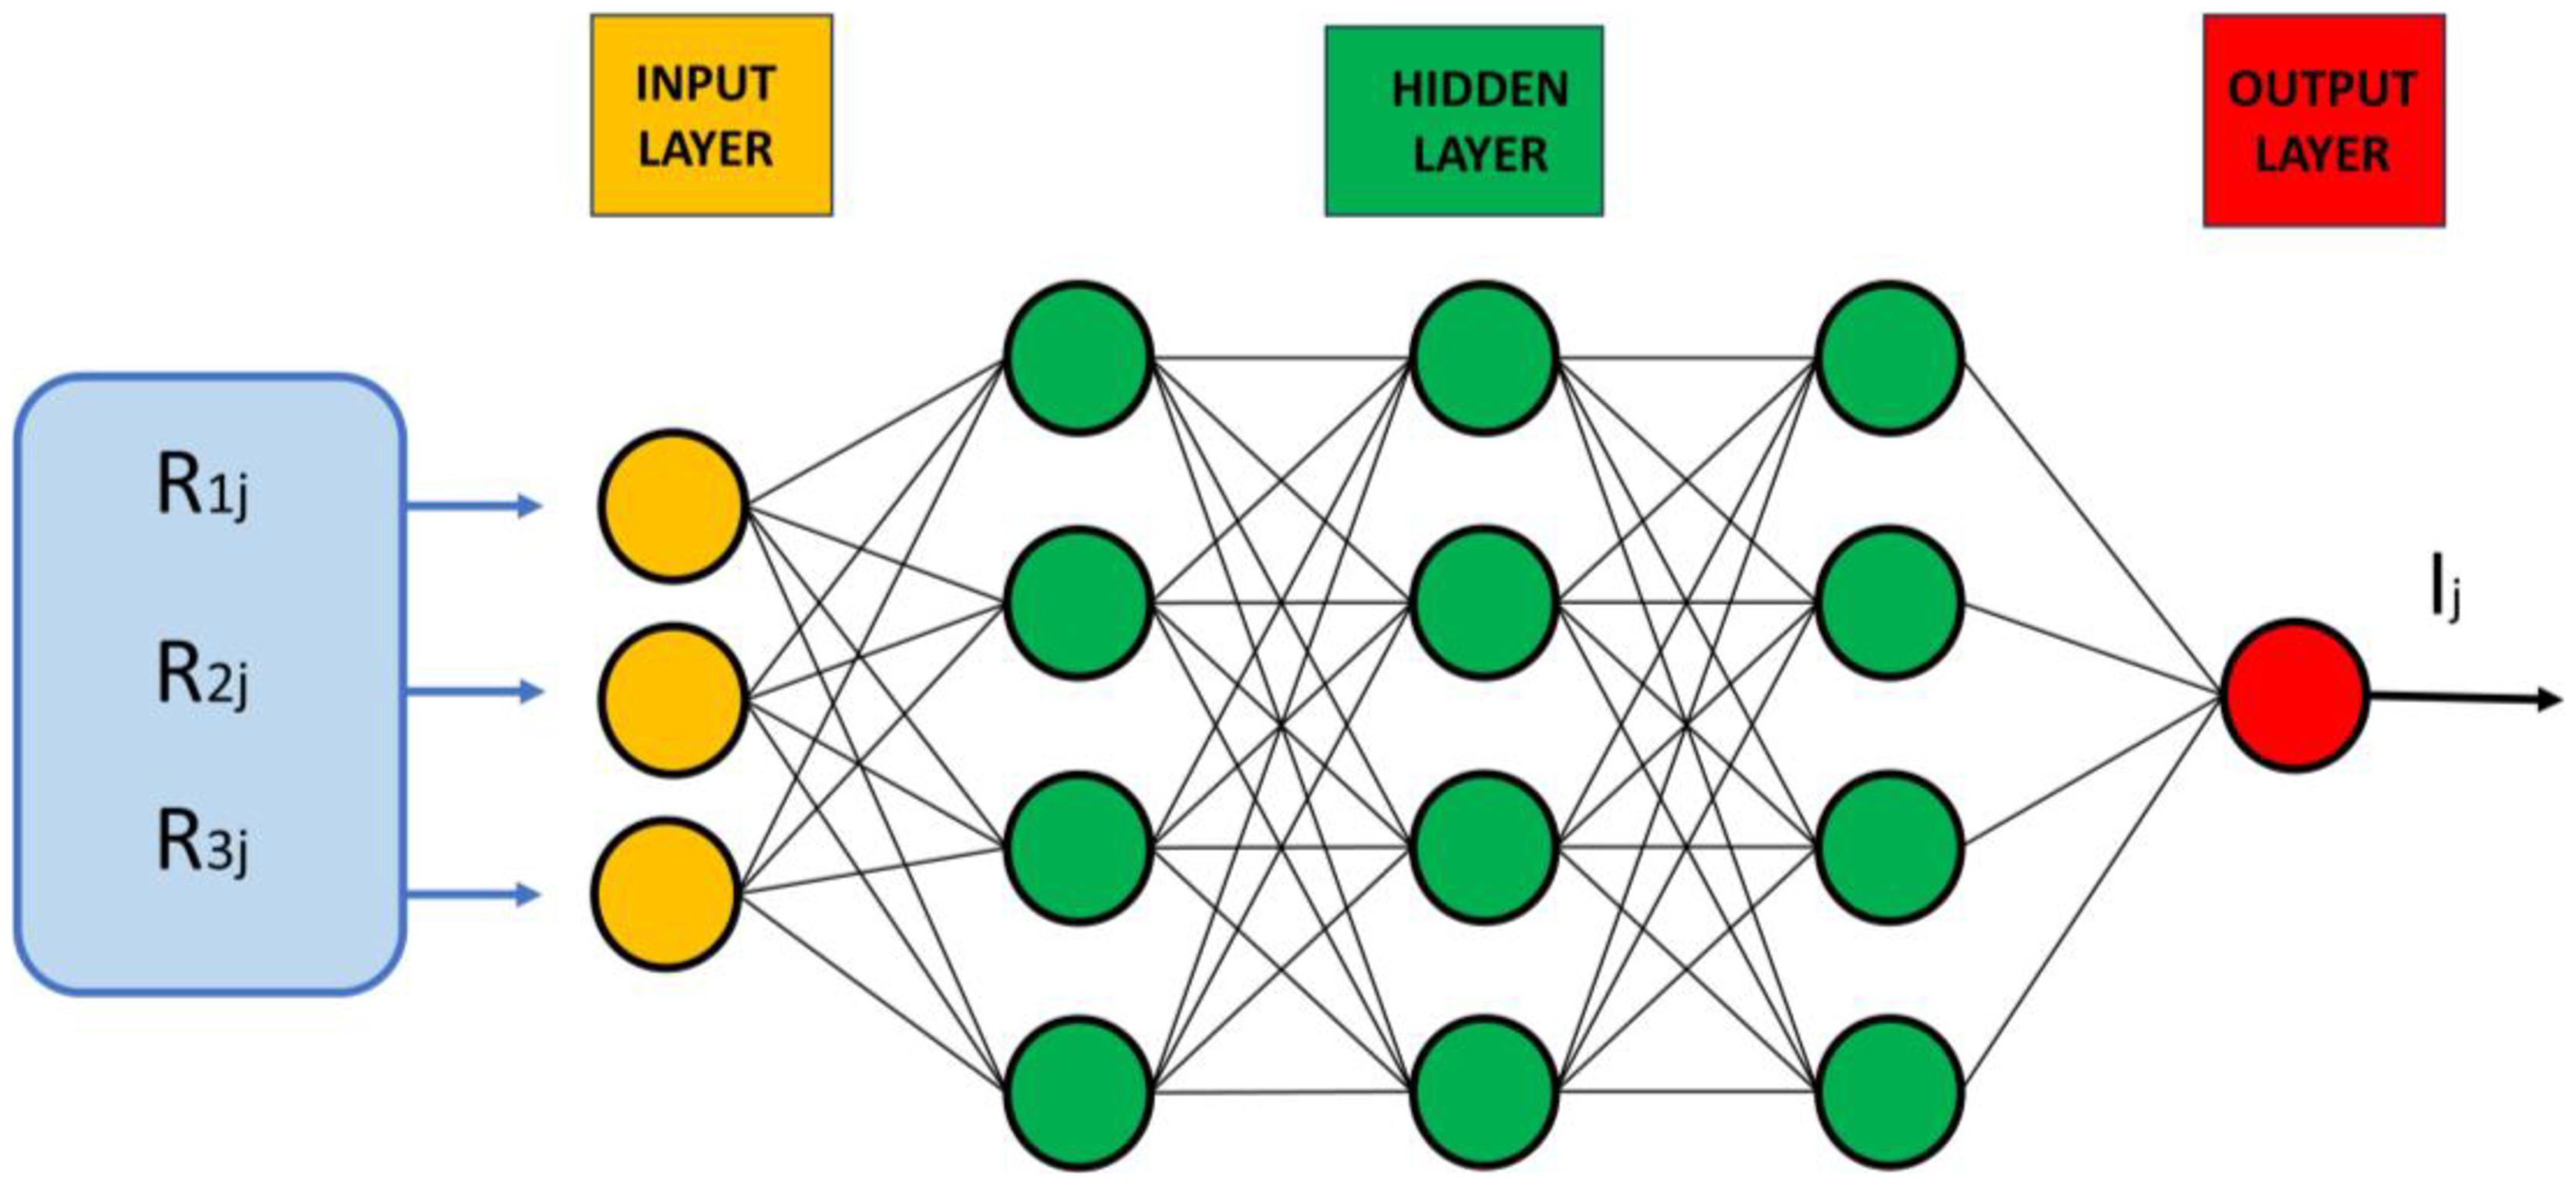
Finally, a Wide Neural Network (WNN) classification model was applied, consisting of several hidden layers that can be useful for modeling complex relationships between inputs and outputs [20]. In this study, the WNN was used with the input being the inspection data (Figure 8) of discontinuities measured independently by the three RFT inspectors and the output being the inspection data of discontinuities measured using the IRIS technique provided by the inspection company. Thus, the input data was composed of a corrosion matrix where i=1,2,3 represents each inspector, j=1...n represents the inspection measurements of each discontinuity via RFT, and represents the inspection data of each discontinuity via IRIS. The intermediate layers consisted of 3 layers, each containing 30 neurons. The output of the training stage is a data structure containing two parts: one grouping the training classification information and another containing the accuracy obtained in the network training. Based on the network response, a confusion matrix was constructed, allowing for the identification of correct and incorrect classifications between the inspection data collected by each inspector and the correlated IRIS data. Figure 11 illustrates the classification network (WNN) used in this study, which, in addition to the input and output layers, was designed with three hidden layers.
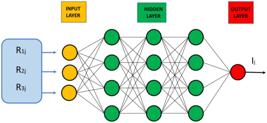
In terms of detailed characteristics of the neural network, the Wavelet Neural Network (WNN) architecture was developed utilizing the real Morlet wavelet activation function (defined as ψ(x) = cos(ω0x) * exp(-x2/2) with a fixed ω0) within the hidden layer. The Adam optimizer was selected for its efficacy in navigating the unconventional error surfaces characteristic of this architecture, as it dynamically adapts the learning rate for various parameters. Regarding the training protocol, a batch size of 64 was implemented to achieve an optimal balance between convergence stability and model generalization. Furthermore, a validation set comprising 20% of the original data was evaluated in its entirety at each epoch to monitor performance and mitigate overfitting.
3. Results and Discussions
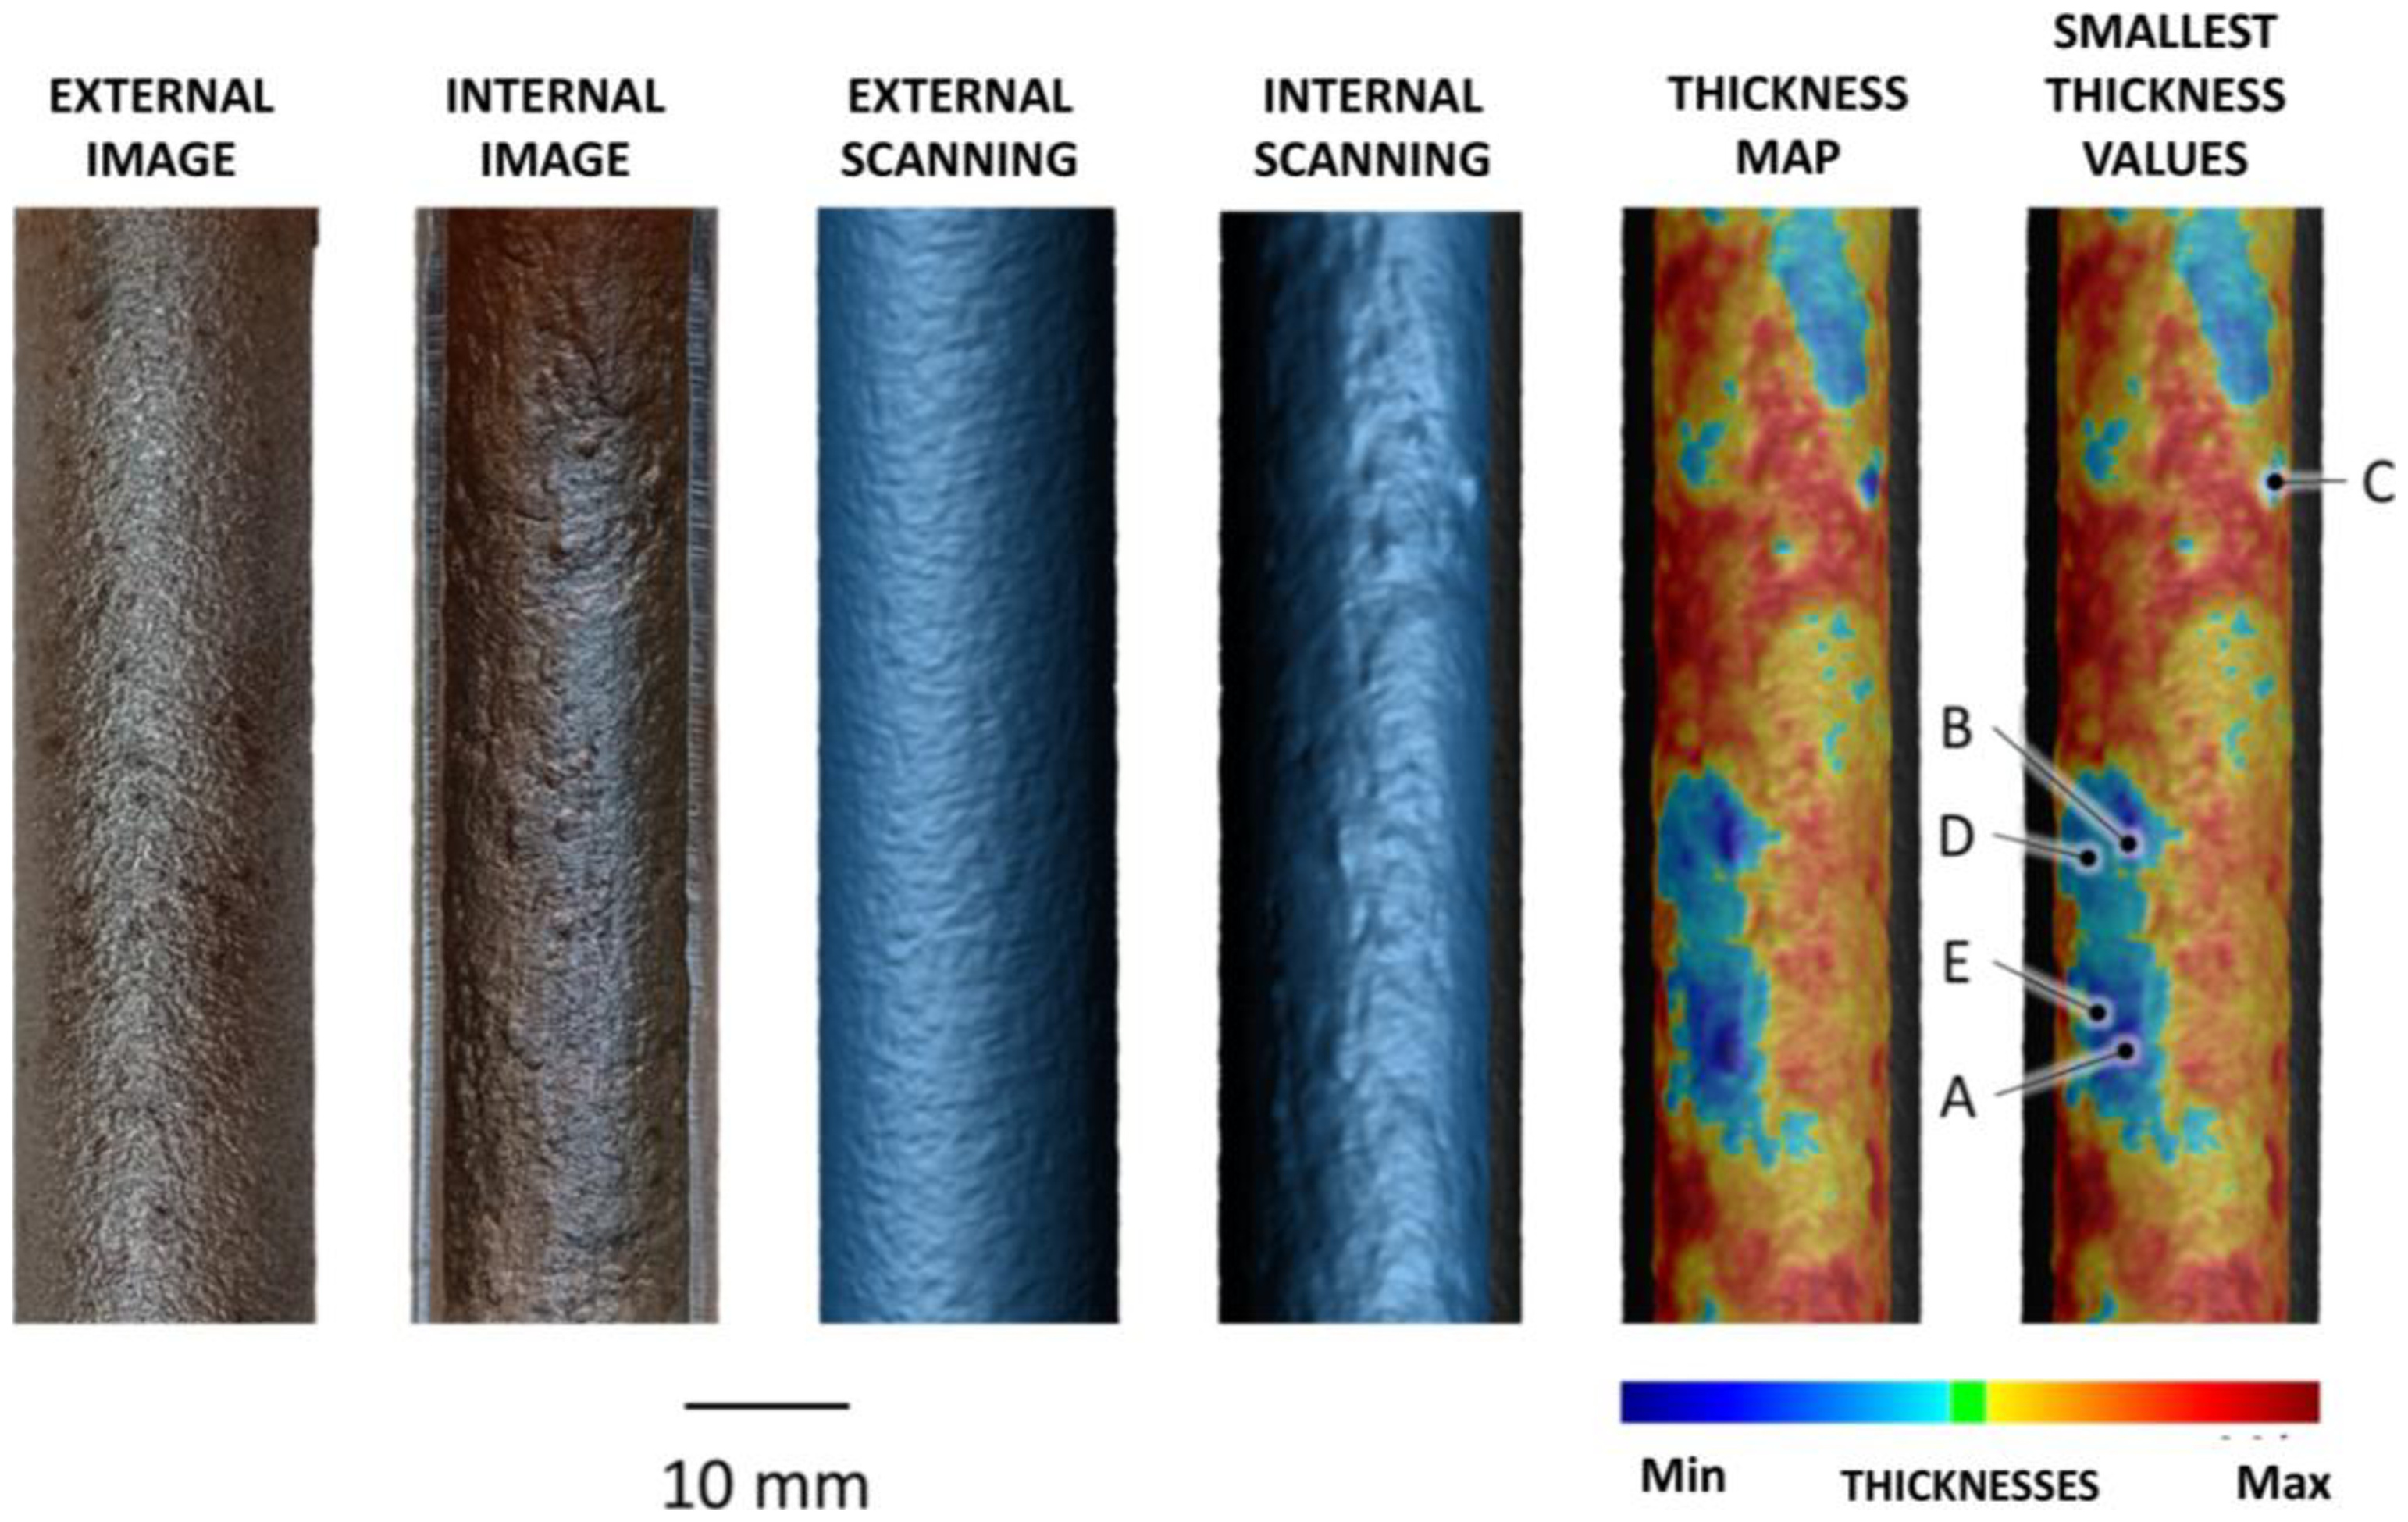
Figure 12 presents an example of a section removed from a tube for analysis, where on the left side are the external and internal real images of the tube section of interest, in the center the respective images generated by 3D scanning, and on the right side the thickness maps (resulting from the difference in coordinates between the digitalized external and internal surfaces) with five discontinuities showing the greatest wall reductions (smallest thickness values) that were identified (with indication E being the case of the greatest reduction (smallest thickness value) identified). In this case, the main discontinuities can be qualitatively classified as a uniform corrosion since the damage occurred spread evenly across the tube sample. The same visual criteria were applied to classify the main discontinuities identified by the different tests later on in this work.
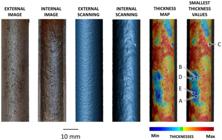
Example of discontinuities in a tube section with digitalized images and smallest thickness values (A = 1.262 mm; B = 1.340 mm; C = 1.430 mm; D = 1.490 mm; E = 1.496 mm).
As listed in Table 3, each technique has a specific way of representing the discontinuity values. RFT provides thickness loss data, but in percentage, whereas IRIS and 3D Scanning report the remaining thickness directly in millimeters.
Thus, to accurately work with the values of the discontinuities, it is necessary to convert them to the same unit, which in this case will be thickness loss in millimeters, that is, the amount of material thickness removed from the tube. Initially, the RFT data were converted from remaining thickness in percentage to millimeters using Equation 1. Subsequently, the remaining thickness data from RFT, IRIS, and 3D Scanning were converted to thickness loss in millimeters using Equation 2, as illustrated below:
where cp represents the corrosion percentage (% wall loss) determined from the RFT, Rt represents the remaining thickness, and is the nominal thickness of the tubes according to the heat exchanger manual.
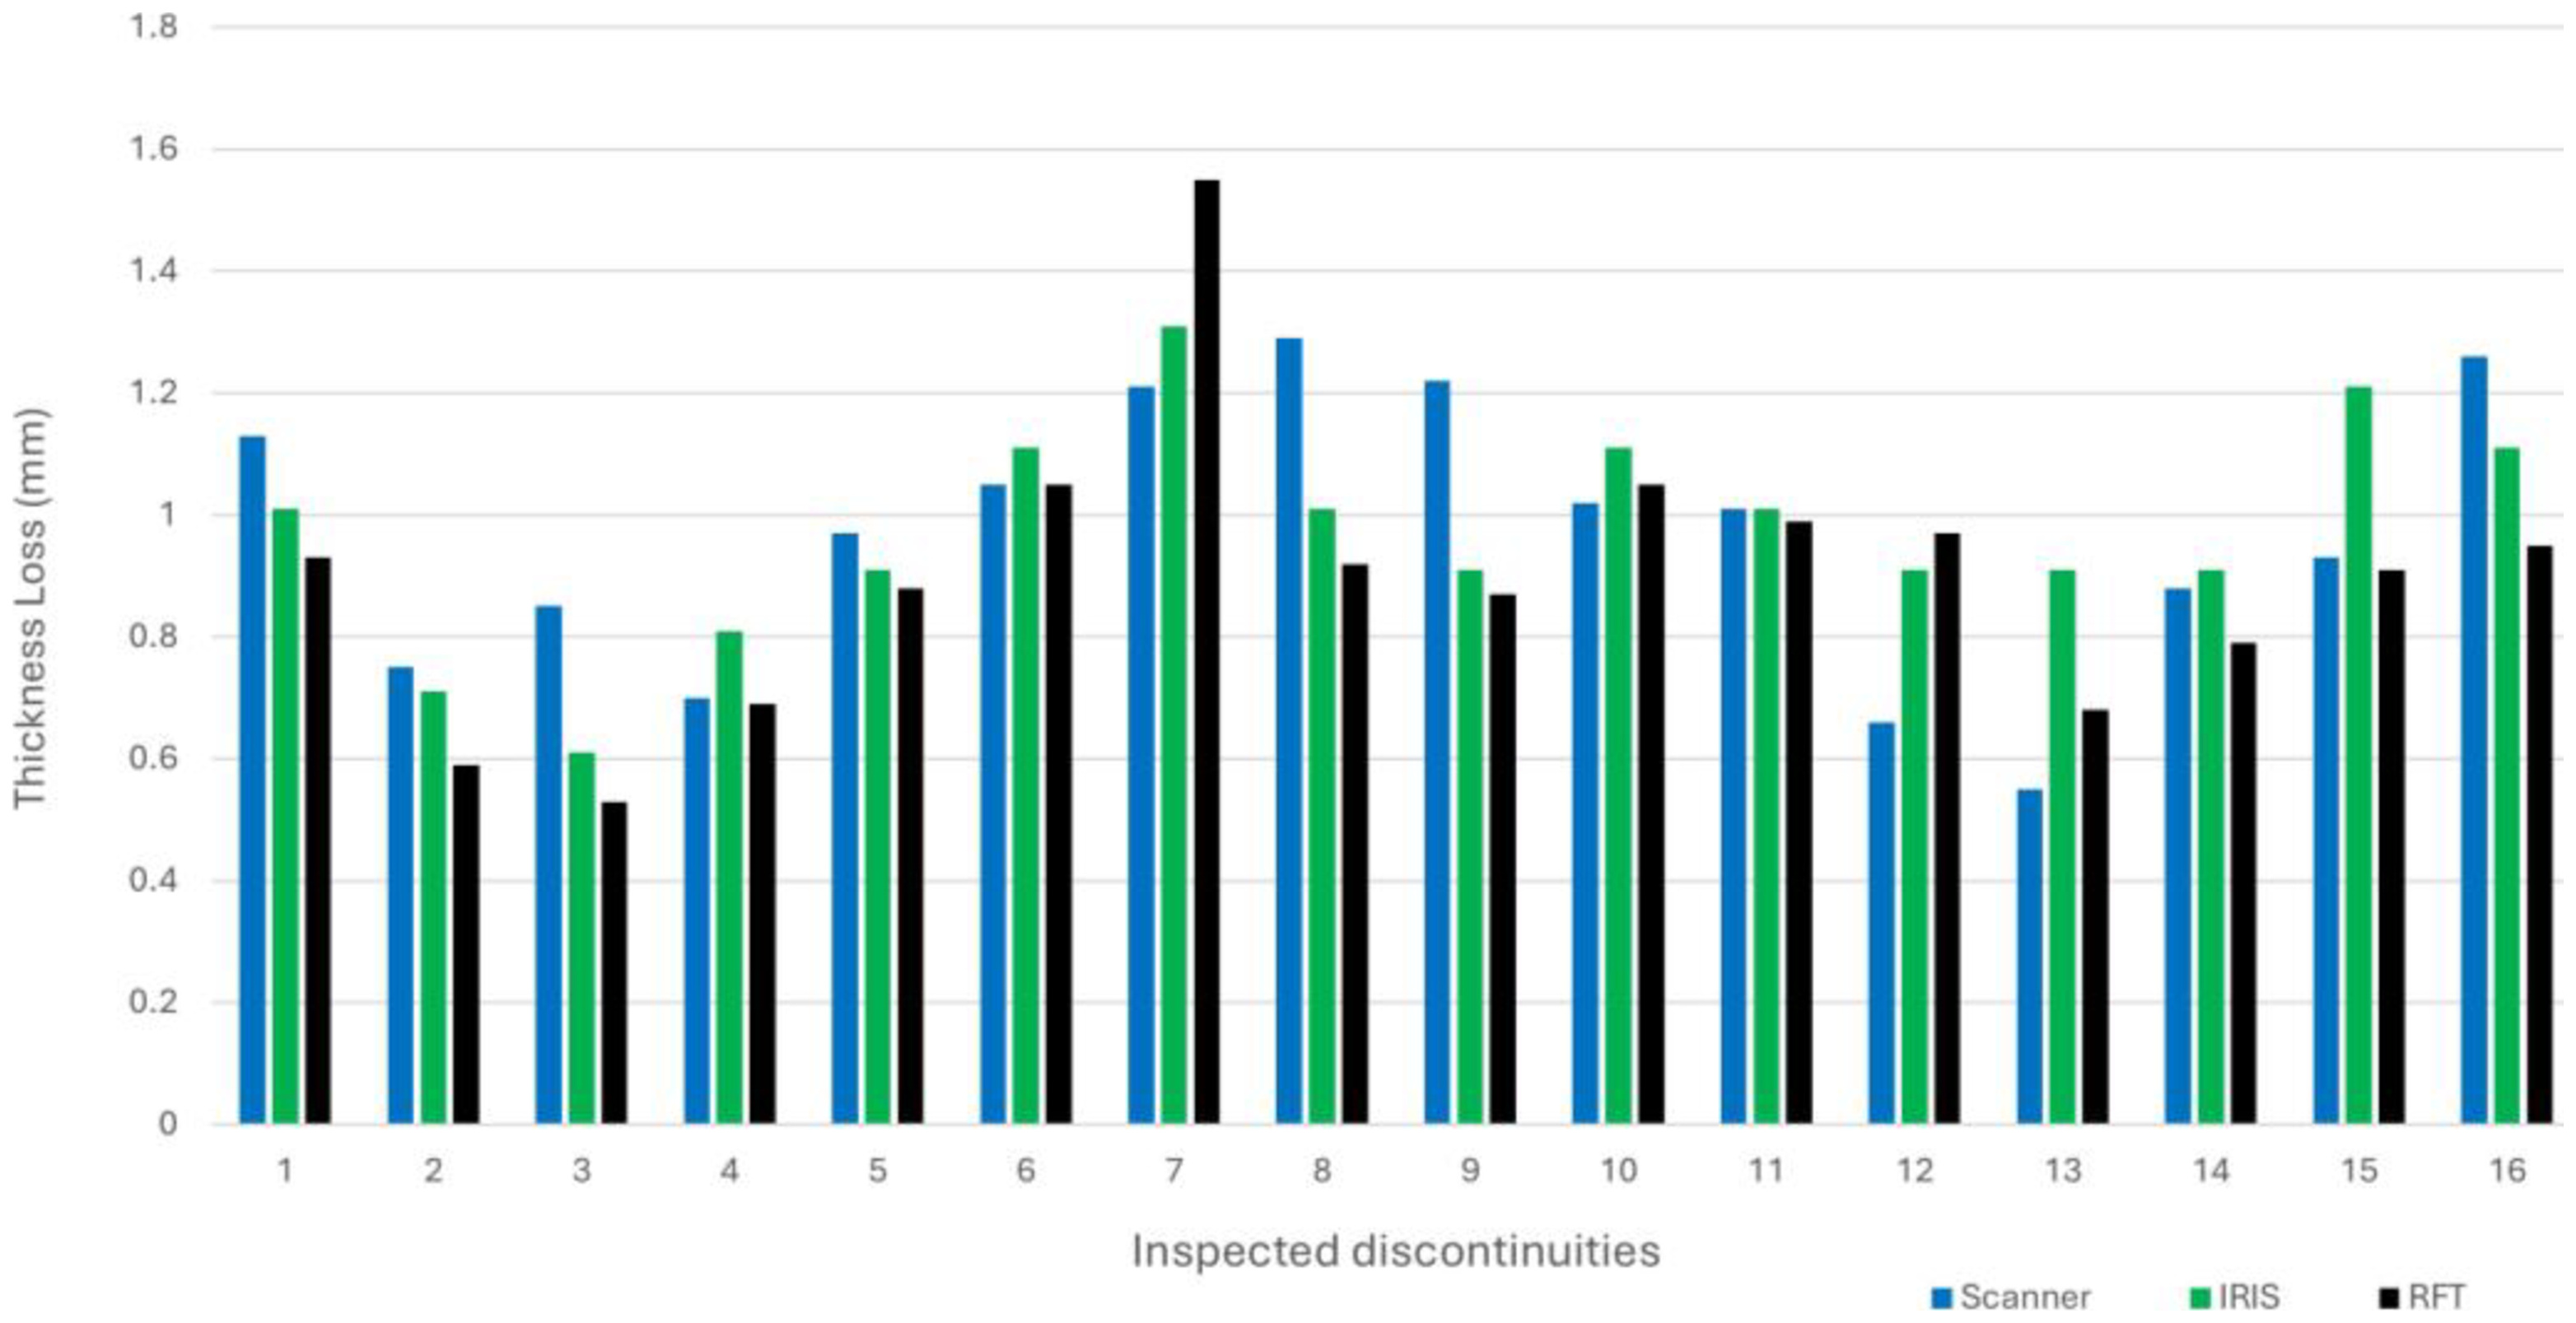
Figure 13 allows for a comparison of the 16 discontinuities (the primary one for each tube in the sample) identified by each inspection technique. Generally, it can be observed that the ability of each technique to characterize the levels of discontinuities in the group of tubes that were inspected varies. To better visualize the results, the Table 4 shows the thickness losses (classified according to a simple visual classification criteria as uniform or localized) determined by each test technique (IRIS, RFT, and 3D Scanning), the differences between the techniques (Scanner – IRIS; Scanner – RFT; and IRIS – RFT), as well as the mean and standard deviation of each difference.
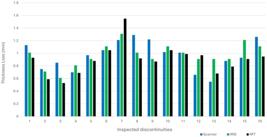
Comparison between measurements of the primary discontinuities of each tube by the IRIS, RFT, and 3D Scanning techniques.
Thickness losses of the main discontinuity of each tube measured with the three tests (IRIS, RFT, and 3D Scanning) for a sample of the tube bundle.
Since the discontinuity values obtained by the different inspection techniques are expressed as a percentage of corrosion relative to the nominal thickness of the tube, the measurements taken by the 3D Scanner were converted accordingly using Equation 1. In the subsequent analysis, the percentage of corrosion will be referred to as corrosion data or simply corrosion.
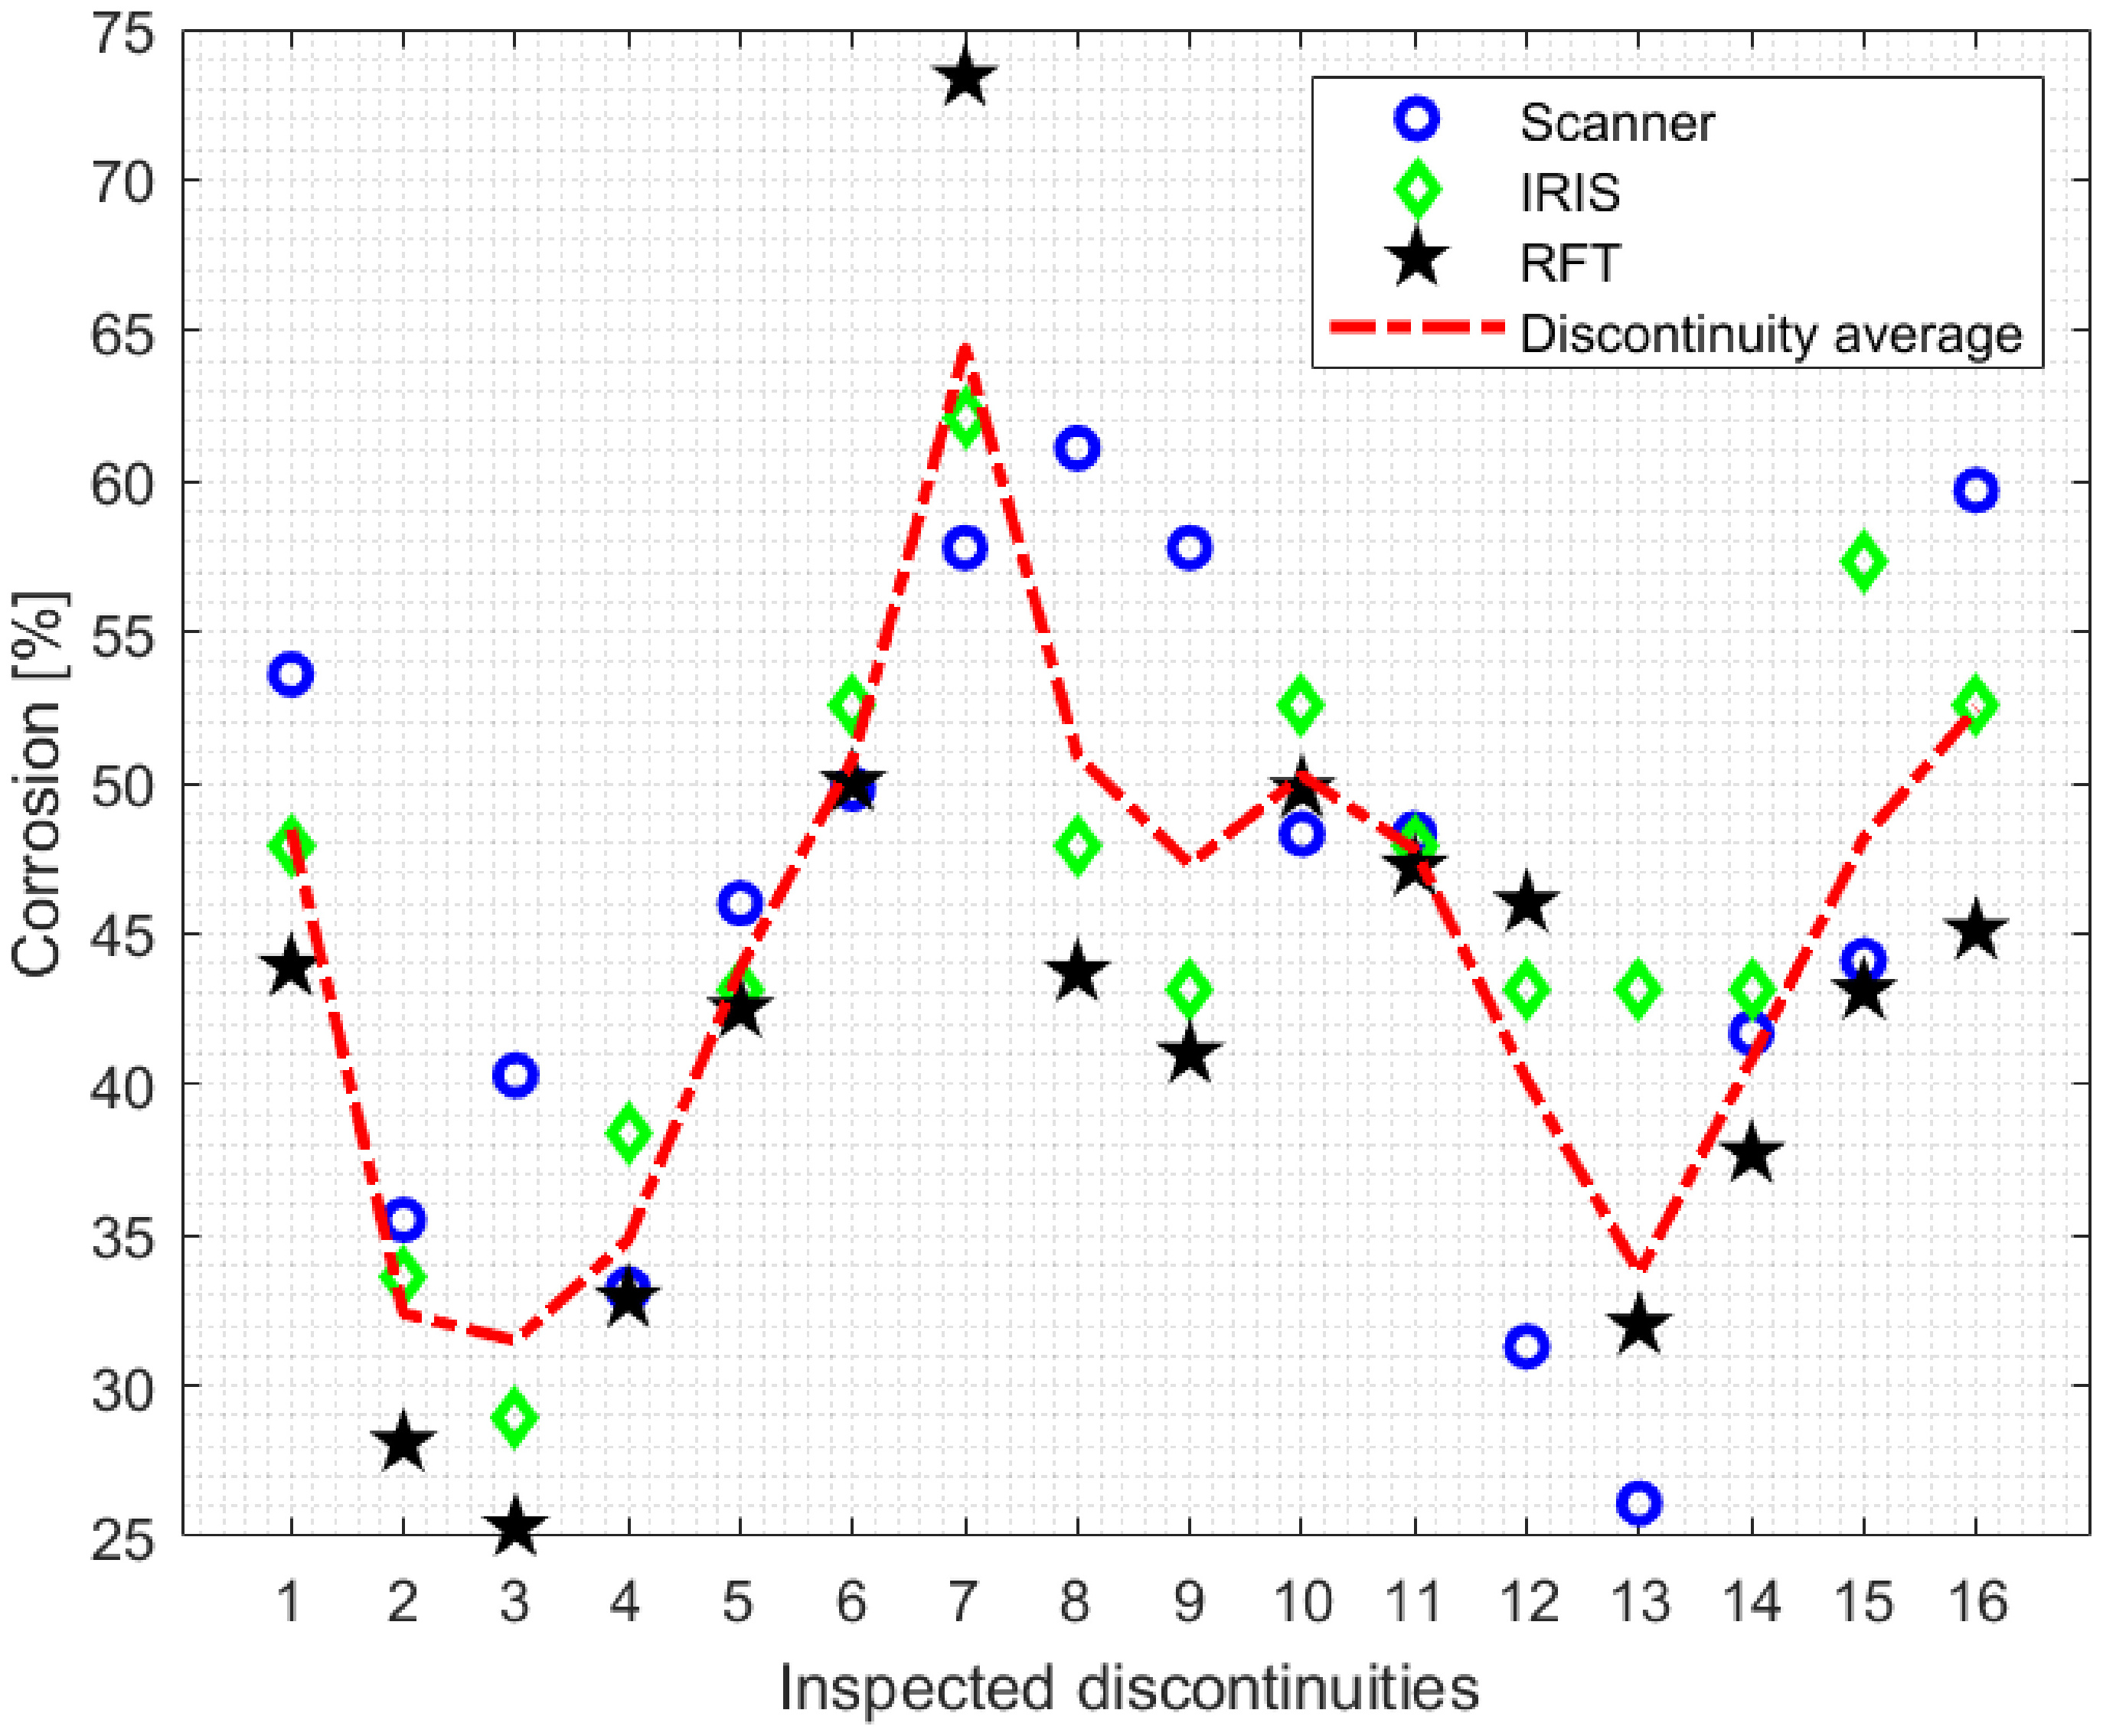
Figure 14 shows the dispersion of corrosion data (percentage of thickness loss relative to the nominal thickness of the tubes) generated by each inspection technique. Table 5 lists the statistical characteristics (mean and variance) corresponding to these data. However, to compare the average corrosions found from the inspections, some normality tests were performed on the samples for the purpose of applying variance analysis with the objective of accepting or refuting the similarity between the averages of the corrosion data of the discontinuities. Thus, to verify the adherence of the corrosion, data obtained through the 3D Scanning, IRIS and RFT tools in relation to the theoretical normal distribution, Table 6 was created, consisting of adherence parameters according to the Kolmogorov-Smirnov (K-S) and Anderson-Darling (A-D) metrics [21].
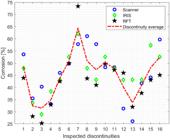
p-value for each inspection technique for a significance level (α) equal to 5% in the 16 tubes.
Figure 15 illustrates the cumulative probability of each technique in relation to the normal curve, while Table 7 presents the correlation coefficients (Pearson and Spearman) between the IRIS-Scanner and RFT-Scanner techniques.
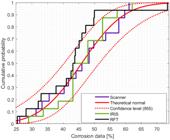
Cumulative probabilities of corrosion data obtained by each inspection technique in the 16 tubes.
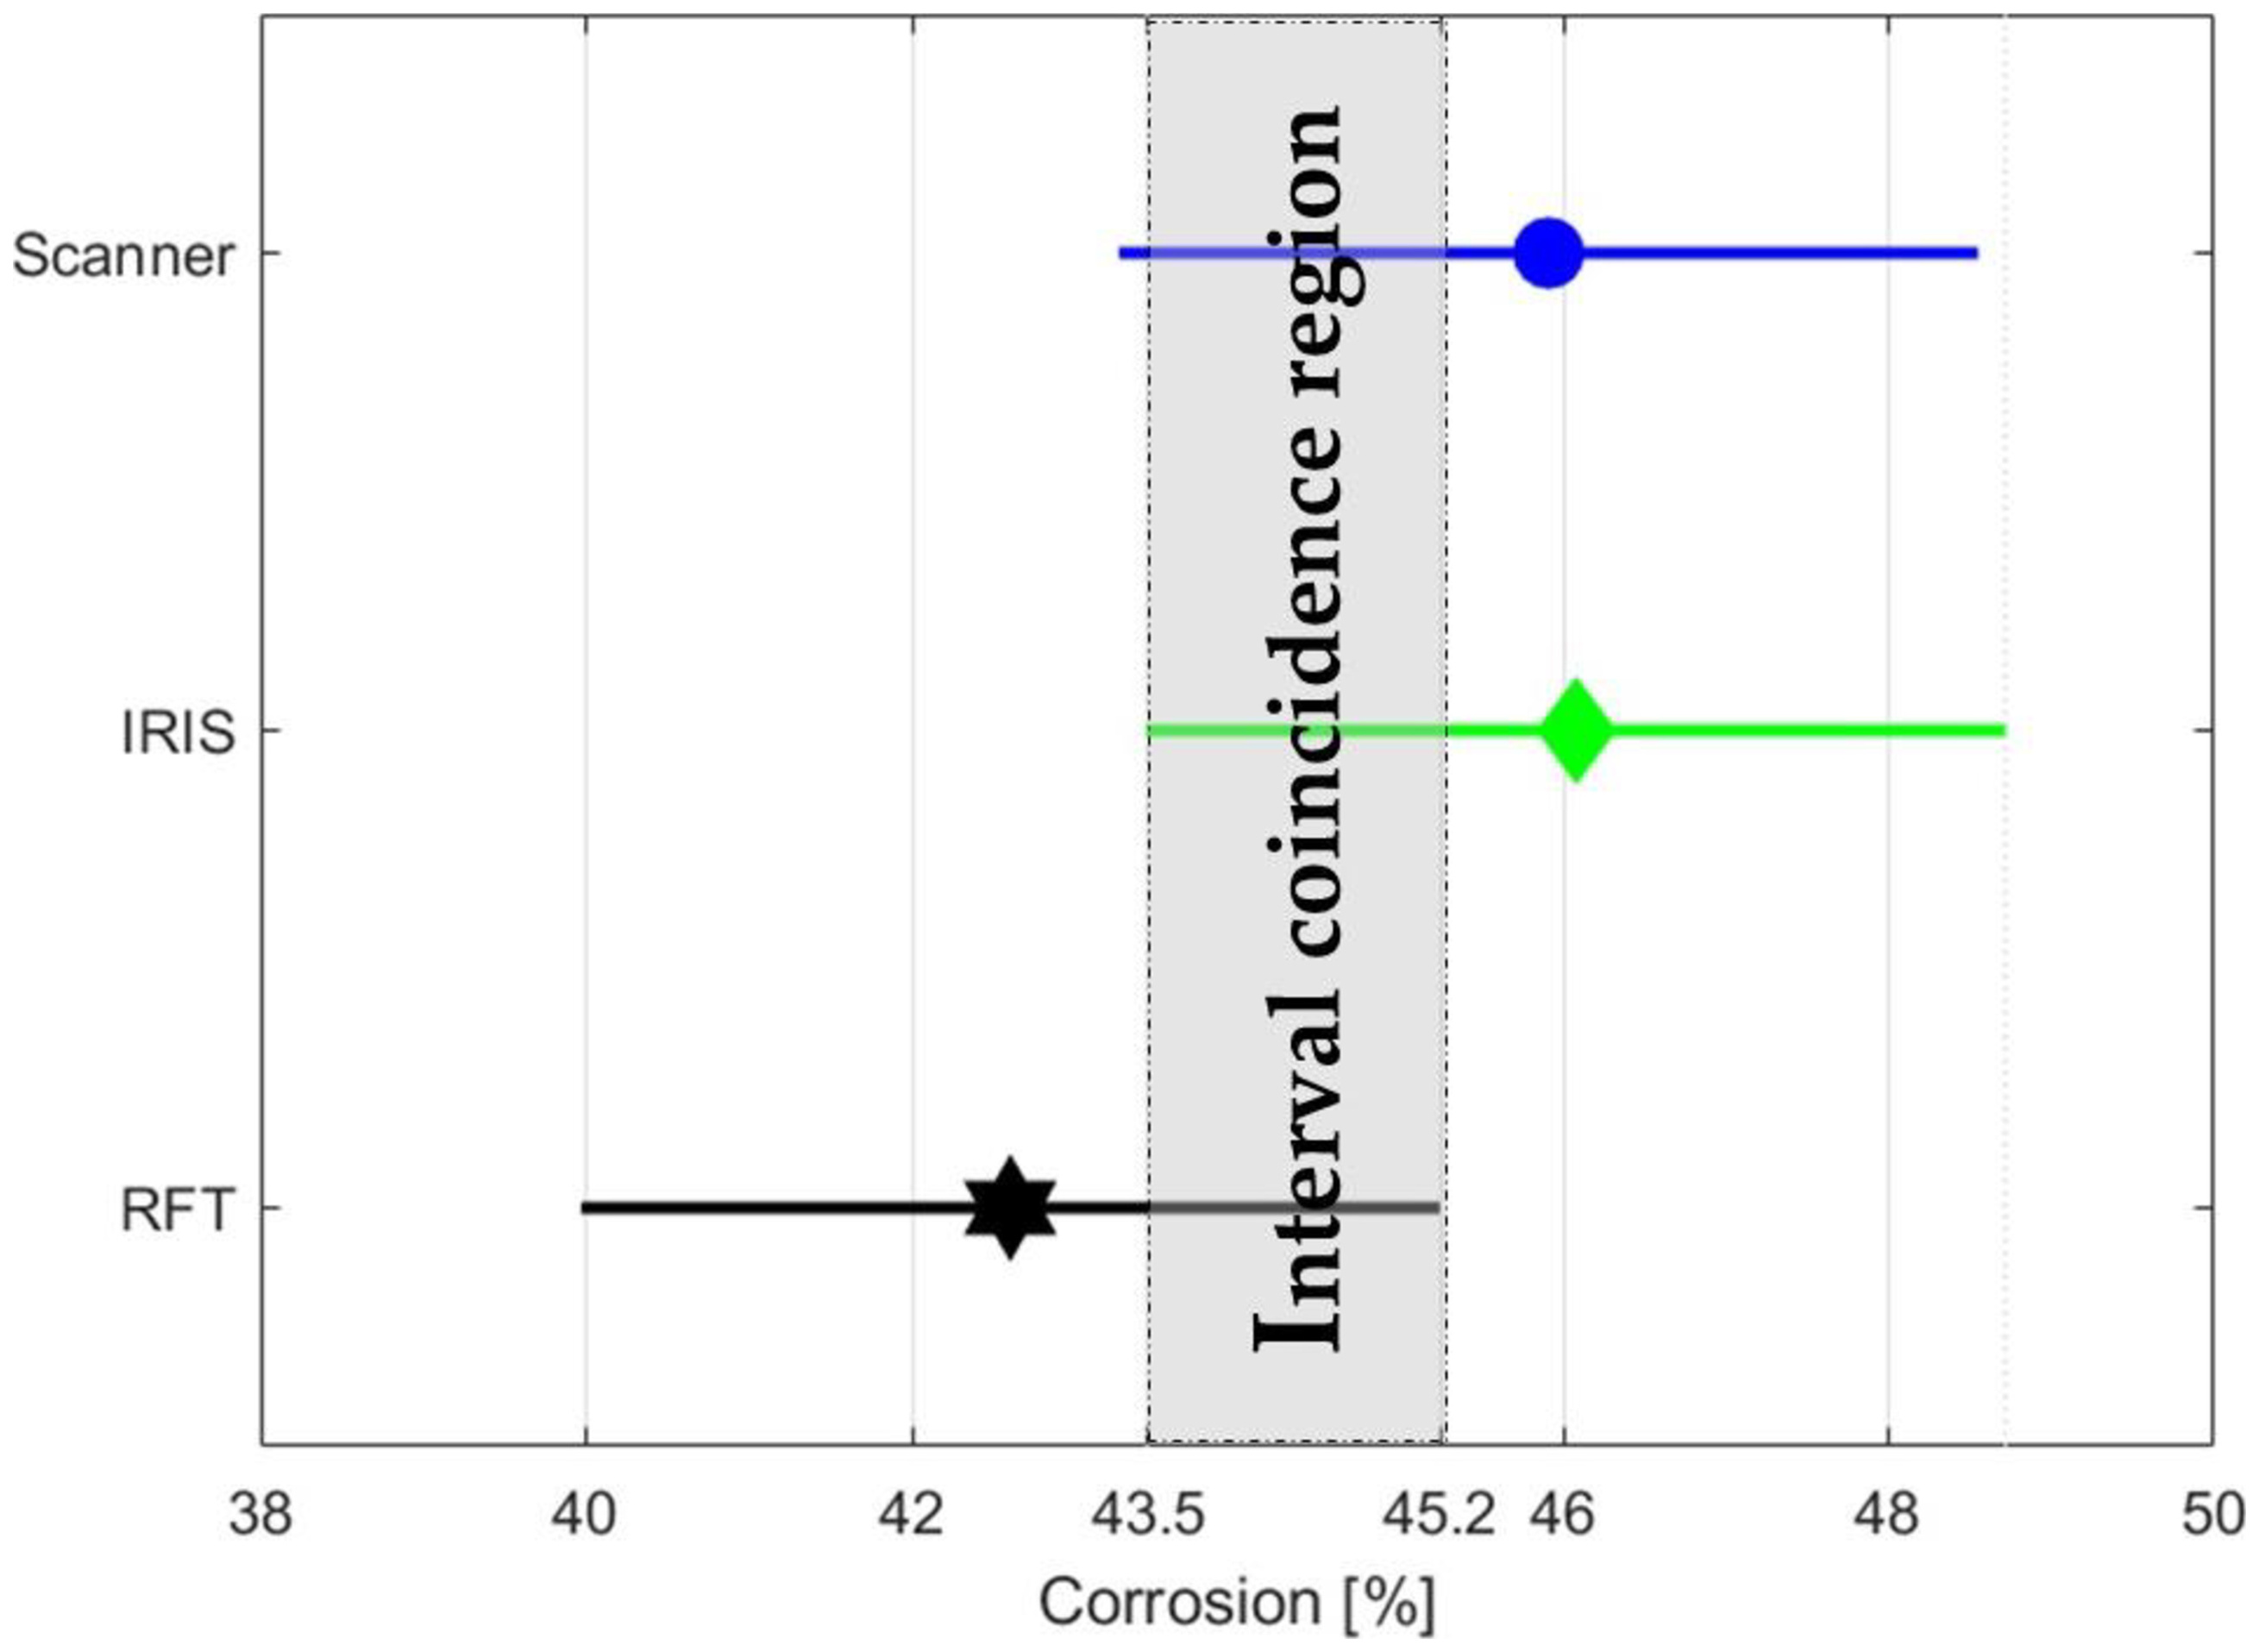
Figure 16 presents a comparison of the mean intervals for the corrosion data from each inspection technique. As seen in Table 5, the values obtained by the Scanner and IRIS have mean corrosion percentages close to 46%, while the mean for RFT was 42.61%. In this sense, the proximity of the means of both techniques is evident, as their intervals overlap in the range of 43.2% to 45.2%.
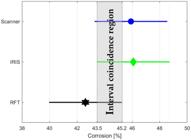
Based on the statistical characteristics presented in Figures 12 and 13, as well as on the results shown in Tables 3 and 4, it can be concluded that the 3D Scanning, IRIS, and RFT tools are similar in terms of their capability to detect discontinuities in heat exchanger tubes subject to corrosion. Therefore, any of these inspection techniques could be used to obtain corrosion data for the structural integrity analysis of such industrial assets that suffer from corrosion. However, the 3D Scanning is impractical for field use, as it is a destructive method. Nevertheless, its use was relevant in the present work as a counterproof in relation to the RFT method (an NDT technique with growing industrial interest) and IRIS (an already established NDT technique).
At this point, a complementary analysis of variance was conducted to ensure that the means of each inspection technique do not differ significantly from one another. For this, the statistical tool ANOVA was used, assuming that the differences between the sample means are null [22]. Table 8 shows the results obtained for a significance level (α) equal to 5%, considering the corrosion data obtained by the different inspection techniques of interest in this study for the sample of 16 tubes.
From the ANOVA analysis, it is evident that the average values of the corrosion data obtained by each technique do not present significant differences, as the p-values are higher than the significance level adopted (α = 5%). This result corroborates the F values calculated, which are lower than the critical F values in accordance with the results presented in Figure 15, where the corrosion data from the different inspection techniques are shown. Therefore, with a confidence level of 95%, it can be stated that there are no differences between the means of the discontinuities identified by the different inspection tools.
Considering that the tools that were explored are equivalent in terms of determining different discontinuities in heat exchanger tubes subjected to corrosion, an analysis is now pursued regarding the operability of the RFT analysis (ease of use, level of operator specialization, etc.). In this sense, from the same set of tubes shown in Figure 1, 236 discontinuities were evaluated by three operators (inspectors) with different levels of experience with the RFT technique, as mentioned in Section 3. The inspections in this case were conducted independently by each inspector. Table 9 provides a summary of the data collected by each one of them, showing the count of data (number of tubes/discontinuities) along with their sum, mean value, and sample variance.
Sample mean value and variance of the corrosion measurements for the evaluation of 236 discontinuities by the three RFT inspectors.
From the analysis of the corrosion data obtained from the same set of tubes, an effort was made to verify the existence of differences between the mean values of the tube groups measured by the different inspectors. To this end, a comparative analysis was performed among the inspectors to determine whether there was any influence of their respective experience/skill levels on the quality of the RFT results, given that this technique is often reported in the field as more challenging to interpret than the IRIS case. Table 10 shows the results of the K-S and A-D statistical metrics applied to the data from the three inspectors. Statistically, it can be observed that the corrosion data measured by the different inspectors show strong adherence to the standard normal distribution. This finding is crucial for the application of certain statistical methods that will help determine whether a highly specialized operator is necessary for identifying discontinuities using the RFT tool or not.
Results of p-values for measurements (at a significance level (α) equal to 5%) obtained by the three RFT inspectors with 236 discontinuities.
In this context, given the strong adherence of the data to a normal distribution, Figure 17a illustrates the dispersion of corrosion data by each inspector and how these compare to the average corrosion for each discontinuity. Figure 17b presents the aggregation of the corrosion data obtained by the inspectors and their alignment with the theoretical normal distribution. This graphical representation clearly shows that the distributions of the corrosion data exhibit good agreement with each other and with a normal distribution.
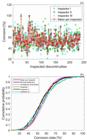
(a) Dispersion of corrosion measurements identified by the three RFT inspectors; (b) Adherence of corrosion measurements identified by the three RFT inspectors to the standard normal distribution (always with 236 discontinuities evaluated).
In this context, assuming that the discontinuity determinations by the inspectors follow a normal distribution, a variance analysis was conducted among the corrosion samples obtained by each one of the RFT operators to verify the similarity between their respective means.
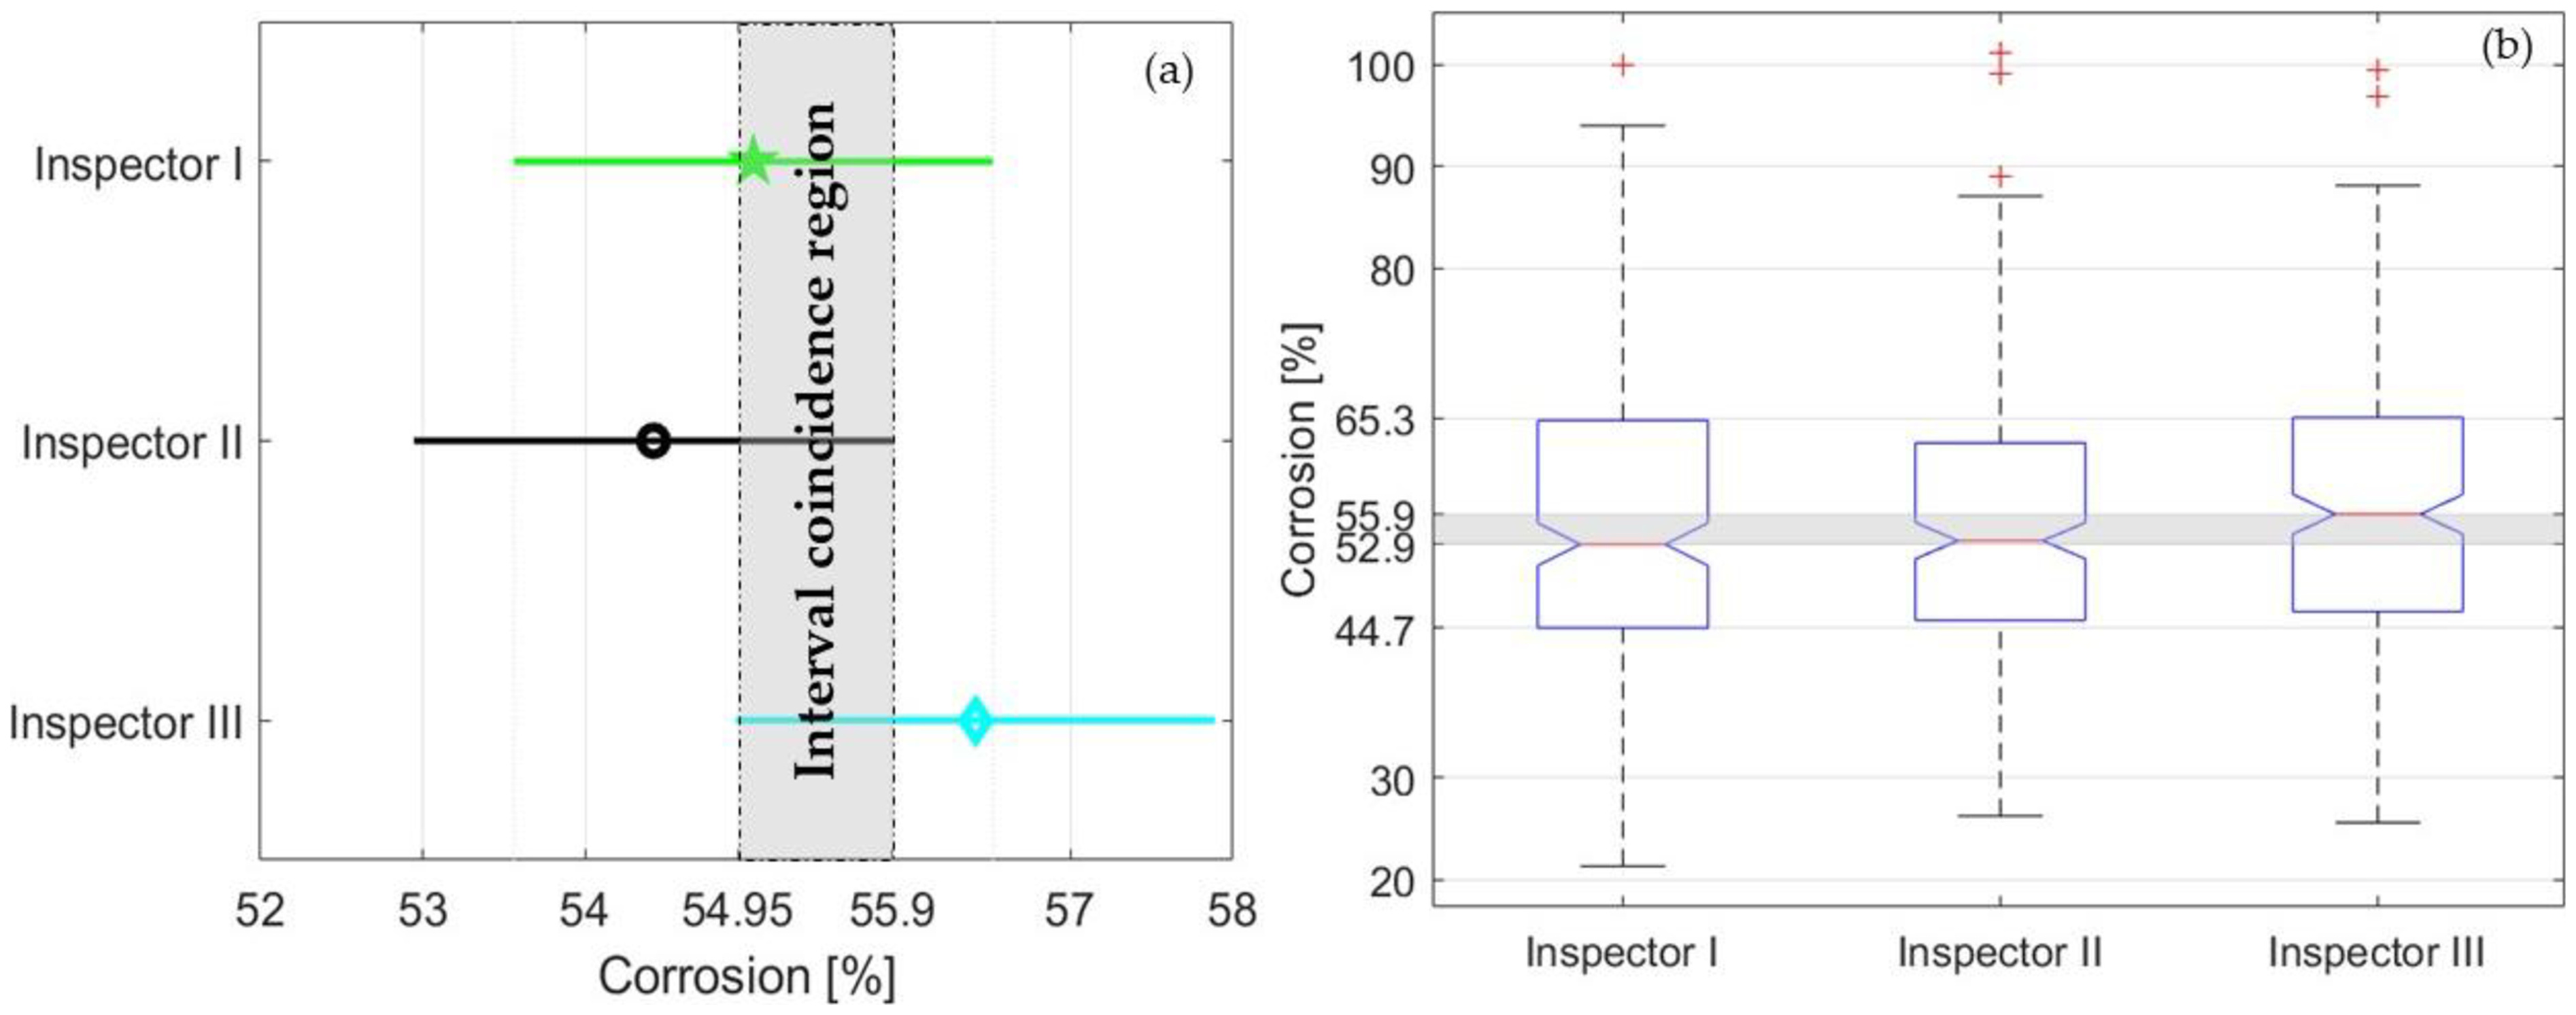
Table 11 shows that all the p-values are higher than the adopted significance value (α = 5%) and the calculated F values are lower than the critical F values. This indicates that there is no statistical evidence of differences between the means of the corrosion measurements determined by each inspector. Therefore, the RFT inspection can be operated by inspectors with limited experience in the technique without risking its effectiveness in detecting discontinuities. This characteristic is also evident in Figure 18a, which shows the overlaps between the respective means of corrosion data collected by the three inspectors. Thus, there is no evidence of differences between the means of discontinuity determinations by the different inspectors using the RFT technique. Additionally, the results presented in Figure 18b indicate that the maximum difference between the medians for each inspector is approximately 3%. Moreover, it is observed that 75% of the corrosion data determined by the different inspectors falls within the range of 4.47% to 6.53%.
Application of ANOVA to the corrosion data (236 discontinuities) obtained by the three RFT inspectors.
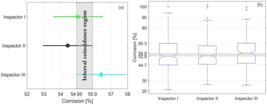
Multi-comparison of the inspector effect on the RFT test (236 discontinuities evaluated): (a) Means; (b) Medians.
Given the results found in this work, there is statistical convergence indicating no evidence of differences between the means of discontinuity determinations by the inspectors, regardless of their diverse level of skill on the RFT method. This leads to the conclusion that the level of experience in operating the RFT test did not significantly affect the accuracy of corrosion data collection in heat exchanger tubes affected by corrosion. And, in addition to not depending on experienced operators, it is statistically proven that the RFT technique produces similar results in inspecting discontinuities in such industrial assets when compared with the IRIS and 3D Scanning techniques, corroborating, now with 236 discontinuities evaluated, the previous results found with the sample of 16 tubes.
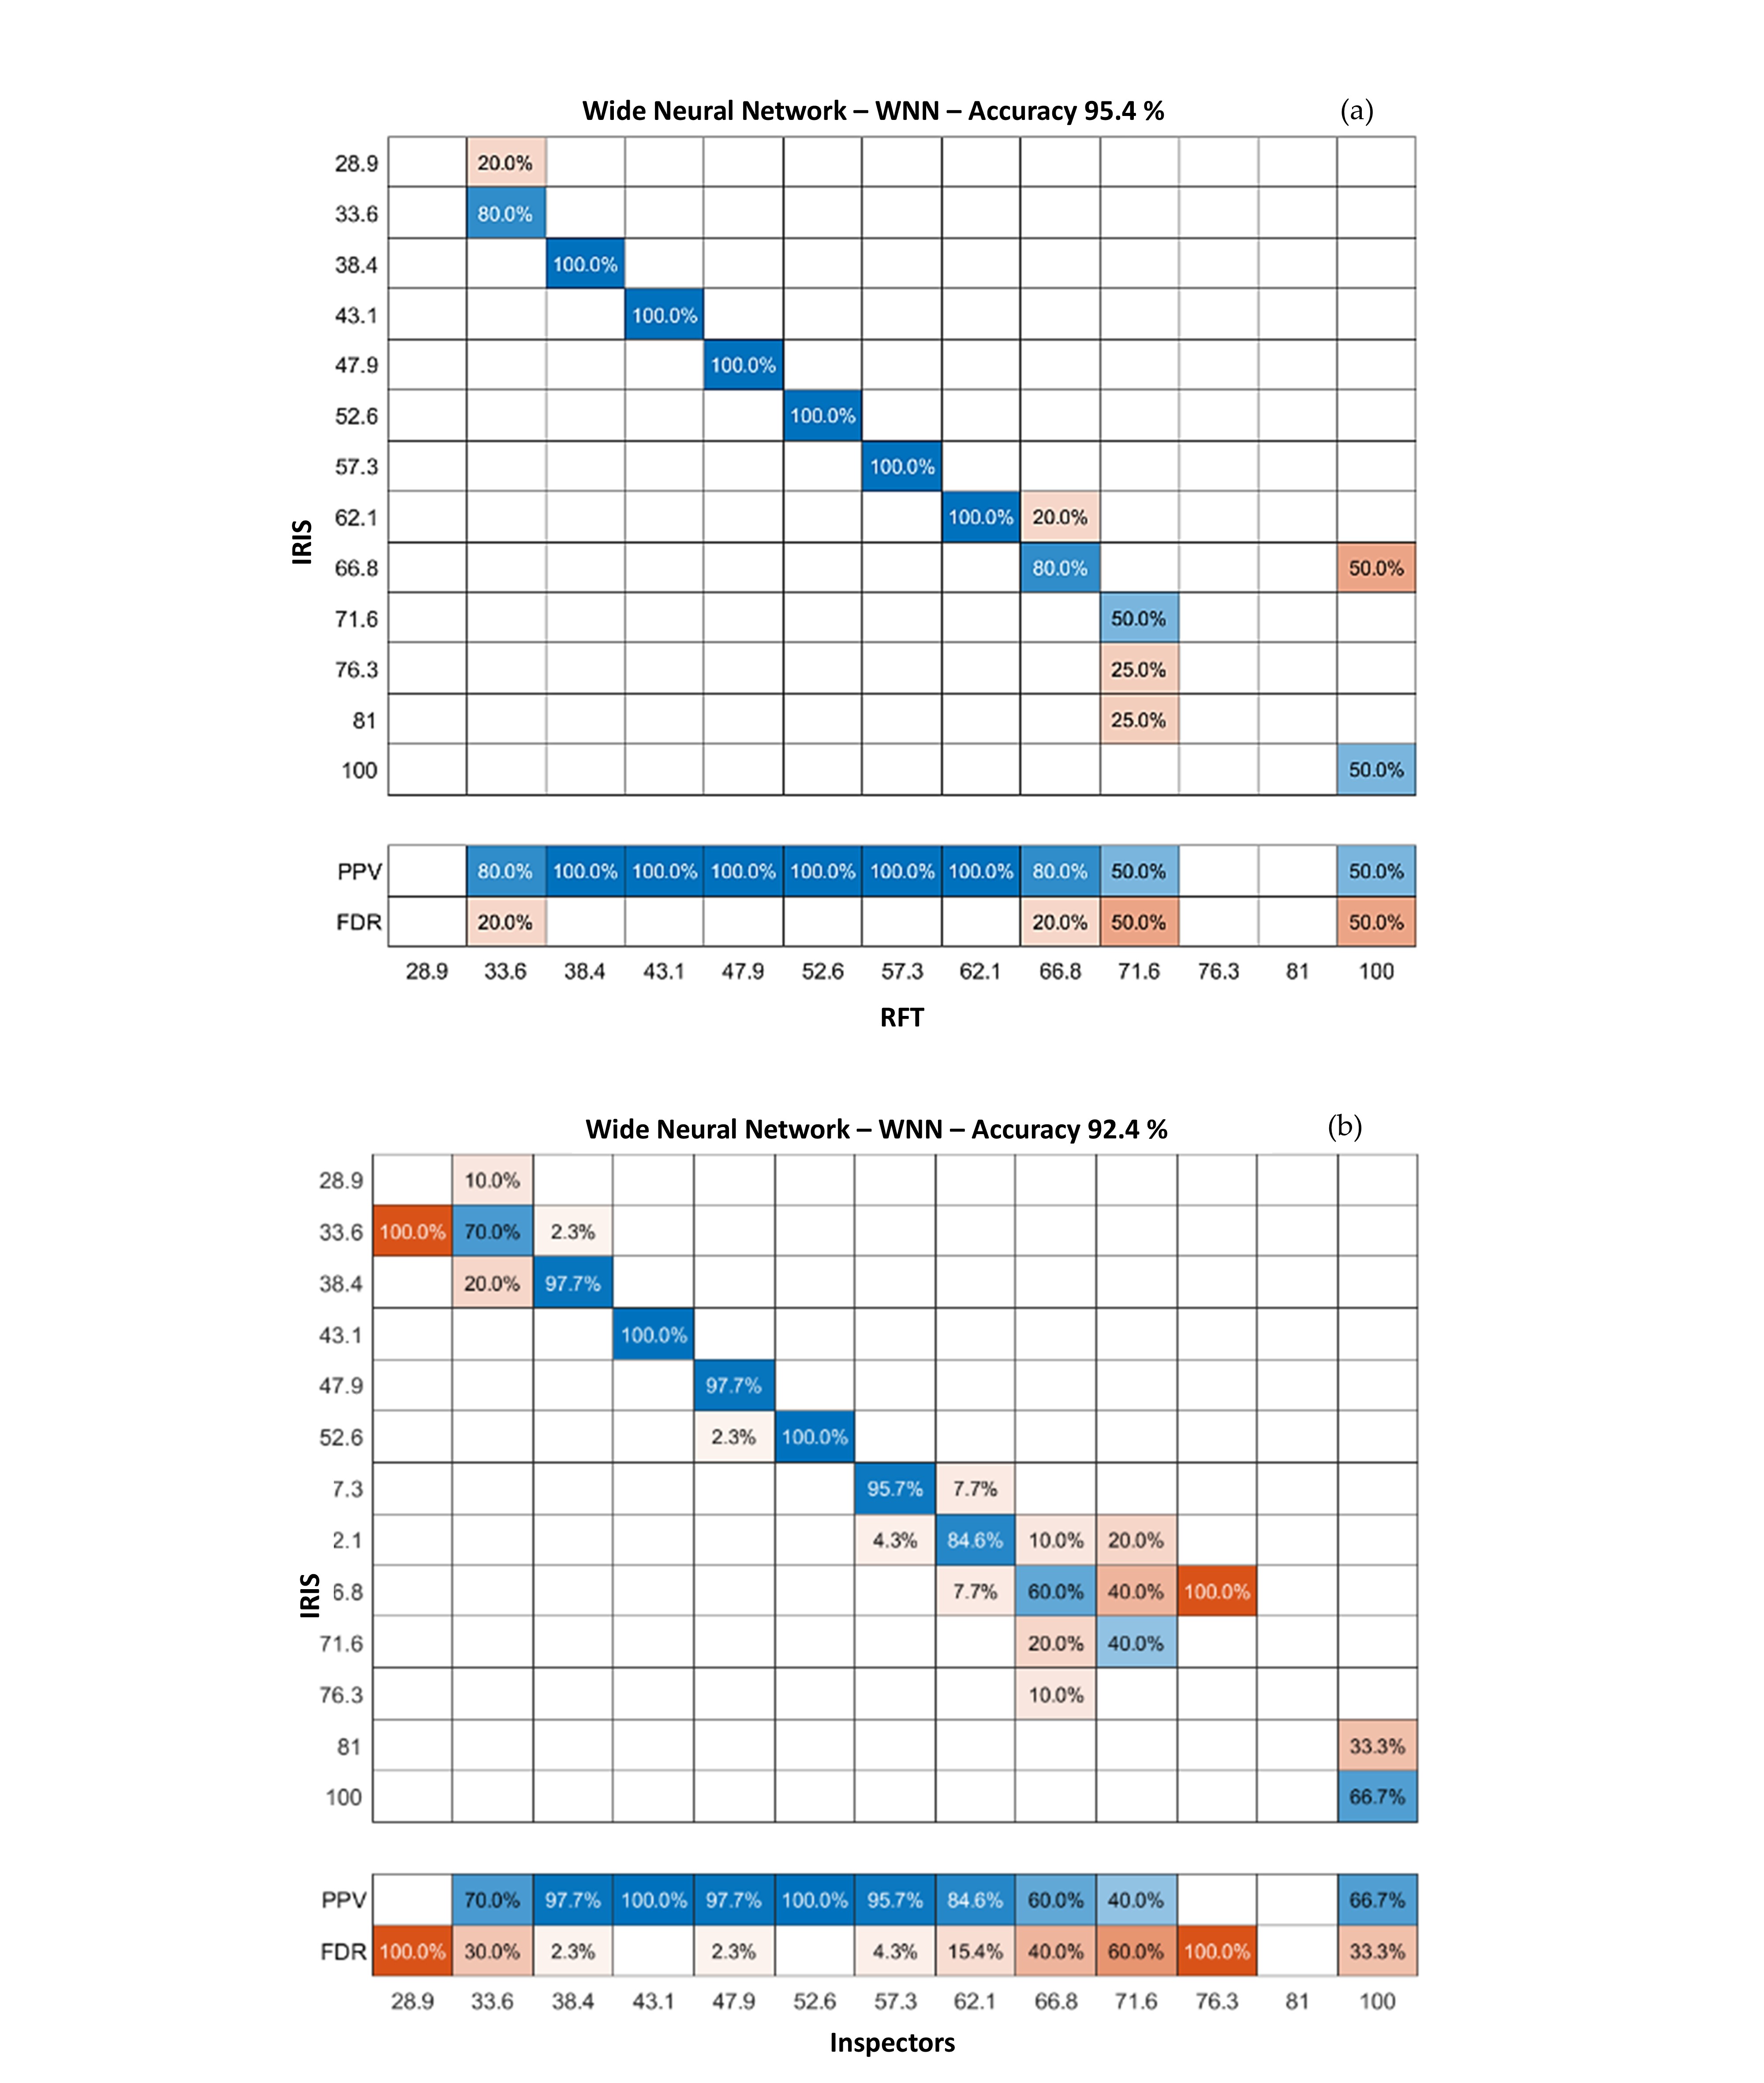
Finally, Figure 19 presents the confusion matrices of the neural network used to classify the inspections via RFT, both in comparison with the IRIS inspection data (Figure 19a) and in terms of comparison of discontinuity determinations by the different inspectors (Figure 19b). In Figure 19a, for the significance value adopted (α = 5%), it is evident that the use of the RFT technique to evaluate discontinuities in heat exchanger tubes is equivalent to the IRIS case. While in the learning scenario between the inspection tools, the network achieved an accuracy of 95.4%, in the learning scenario concerning the inspectors, it presented an accuracy of 92.4%. However, it is worth noting that some discrepancies were observed in different percentages of corrosion, as shown in Table 12. By way of illustration, for all corrosion data up to 66.8%, the network was able to correctly classify 80% of the corrosion measurements provided by the RFT technique, with 20% being classified as 62.1% corrosion.
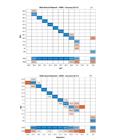
Confusion matrices of the neural network used for the classification of inspections via RFT (236 discontinuities evaluated): (a) RFT vs. IRIS; (b) Inspectors (using RFT) vs. IRIS.
Divergences in estimates by corrosion level extracted from the neural network confusion matrices (236 discontinuities evaluated).
Finally, when applying the artificial neural network to the corrosion data collected by the three RFT inspectors, taking the IRIS data as a reference basis, the confusion matrix shown in Figure 19b was obtained. In this learning scenario, high errors are noticed in the corrosion percentages of 28.9%, 71.6% and 76.3%. However, these high errors are associated with a small amount of inspection data at these corrosion levels (Figure 19a). It is observed that, among all tubes with up to 66.8% corrosion, the neural network correctly classified 60% and incorrectly classified 40% of the cases. On the other hand, the corrosion measurements that exhibited the highest accuracy were concentrated in the 33.6% to 71.6% range.
4. Conclusions
In this study, an experimental-numerical investigation was conducted on the feasibility of using the Remote Field Testing (RFT) in comparison with the Internal Rotary Inspection System (IRIS) as a non-destructive testing (NDT) technique for analyzing corrosion data of carbon steel tubes used in shell and tube heat exchangers applied in oil refineries. With a focus on the RFT case, the field inspection results collected by three different inspectors, each with varying levels of experience and knowledge of such a technique, were evaluated in terms of assertiveness (ease of test execution and data analysis) for making inferences about the asset structural integrity. For the comparative study between the NDT non-destructive tools (RFT vs. IRIS), corrosion data obtained via 3D Scanning (destructive testing approach) was adopted as a reference basis, while for the comparative analysis of the inspectors, the IRIS technique was used for comparison. This allowed for the application of a wide range of statistical tools to validate the hypotheses of similarity between the NDT techniques and the equivalence of the RFT operational capacity by the different inspectors. Artificial neural networks were also used to classify the corrosion data collected by the inspectors in order to assess the repeatability of the RFT test and infer its ease and/or difficulty of execution in the field in terms of the knowledge/experience of the personnel involved. Thus, considering the conditions applied to this work, the following specific conclusions can be drawn:
-
In terms of the corrosion data collected, it is evident that the RFT technique produces results with less variance compared with those generated by the IRIS case. However, both techniques were capable of detecting the same discontinuities within the same corrosion range. Moreover, although the mean and standard deviation of these techniques do not coincide, the difference was found to be less than 10%, which is considered acceptable as it falls within the margin of measurement error for both the RFT and IRIS techniques. This demonstrates the equivalence of such techniques in their ability to detect and characterize discontinuities in carbon steel tubular bundles commonly used in Shell & Tube heat exchangers for oil refineries.
-
In terms of ease of operation of the RFT technique, there is no statistical evidence of an inspector effect in the results that were obtained. It was found that the three inspectors, despite their different levels of experience and knowledge of such a technique, generated data that adhered well to a normal distribution within the same corrosion range. This result demonstrates that, despite the more complex form of discontinuity indication/visualization in the RFT case compared with the IRIS case, it is possible to collect and analyze corrosion data accurately with the RFT technique, even with newly trained inspectors.
• Finally, when evaluating the results of the three RFT inspectors (in comparison with the IRIS results), it becomes apparent that the deeper the discontinuities, the better they can be detected and characterized with such an NDT technique.
Acknowledgments
The authors acknowledge the infrastructure at Federal University of Uberlândia (UFU) and all the assistance provided at the Acoustics and Vibrations Laboratory (LAV) of the Faculty of Mechanical Engineering, especially by Professor Valtair Antonio Ferraresi. The cooperation of Dr. Weslley Carlos Dias da Silva from Petrobras SA is also gratefully acknowledged.
-
How to cite:
Ferraresi RN, Belonsi MH, Lima AMG, Reis RP, Duarte MAV. Comparative analysis of the RFT and IRIS non-destructive testing techniques via advanced statistical and artificial intelligence tools: the case of carbon steel tubular bundles of Shell & Tube heat exchangers. Rev. Soldag. Insp. 2026;31:e3102. https://doi.org/10.1590/0104-9224/SI31.02
-
Funding
This work was financially supported by the CNPq (grants 305636/2021-9 and 306138/2019-0, CAPES and FAPEMIG foundations, State University of Goiás (UEG) through the financial resource made available by its program on Research, Postgraduate Studies and Innovation in Bioinputs (Term nº 54/2023 – UEG; nº 202200020023145), and ANP/Petrobras.
Statements and declarations
Data related to this work is unavailable due to privacy restrictions imposed by the industrial partner.
References
- 1 Sabino RS. Inspeção de feixes tubulares de trocadores de calor [dissertação de mestrado]. Belo Horizonte: Escola de Engenharia, Universidade Federal de Minas Gerais; 2008.
- 2 Associação Brasileira de Normas Técnicas. ABNT NBR 16342: ensaios não destrutivos - ultrassom - inspeção de tubos de trocadores de calor e caldeiras pela técnica de IRIS. 2. ed. Rio de Janeiro: ABNT; 2021.
-
3 Ferraresi RN, Campos VC, Cicelini G, Silva WCD, Reis RP, Ferraresi VA. Análise de ensaios não-destrutivos para inspeção de tubos de trocadores de calor do tipo casco & tubos: Campo Remoto (RFT) versus Sistema de Inspeção Rotativa Interna (IRIS). Soldagem e Inspeção. 2021;26:e2613. https://doi.org/10.1590/0104-9224/si26.13
» https://doi.org/10.1590/0104-9224/si26.13 -
4 Saffiudeen MF, Syed A, Mohammed FT. Failure analysis of heat exchanger using internal rotary inspection system (IRIS). Journal of Failure Analysis and Prevention. 2021;21(2):494-498. https://doi.org/10.1007/s11668-020-01093-4
» https://doi.org/10.1007/s11668-020-01093-4 - 5 American Society for Testing and Materials. ASTM E-470: measuring gas enthalpy using calorimeter probe. West Conshohocken: ASTM; 1973.
-
6 Tada T, Suetsugu H. High speed and high accuracy inspection technology for heat exchanger tube of carbon steel. AIP Conference Proceedings. 2019;2102:060005. https://doi.org/10.1063/1.5099795
» https://doi.org/10.1063/1.5099795 - 7 Huang S, Wang S. New technologies in electromagnetic non-destructive testing. Singapore: Springer; 2013. 222 p. (Springer Series in Measurement Science and Technology).
- 8 American Society of Mechanical Engineers. Remote Field Testing (RFT) examination method. New York: ASME; 2019.
-
9 Eddyfi Technologies. Remote-Field Testing (RFT). 2025 [access 21 mar. 2025]. Available from: https://www.eddyfi.com/en/technology/remotefield-testing-rft
» https://www.eddyfi.com/en/technology/remotefield-testing-rft - 10 Figueredo MAS. Inspeção de tubos de trocadores de calor e de caldeiras com as técnicas IRIS e campo remoto conjugadas. In: III Pan-American Conference for Nondestructive Testing (PANNDT); 2003, Rio de Janeiro, RJ. Rio de Janeiro: SGS do Brasil Ltda.; 2003. p. 1-8.
- 11 Araujo MD, Silva AR. Aplicação conjugada das técnicas de IRIS, correntes parasitas, campo remoto e MFL na inspeção de tubos de troca térmica. In: Anais do 7° Encontro Regional de END e Inspeção; 2009; São Leopoldo, RS. São Paulo: Abendi; 2009. p. 1-16.
- 12 Ramos JE, Carneval RO. PT-144.01.11733: técnicas não intrusivas de inspeção não destrutivas aplicadas e equipamentos e tubulações: revisão da guia de boas práticas para inspeção de permutadores de calor do tipo casco e tubo. Rio de Janeiro: Cenpes/Pdep/Tmec; 2015. 50 p.
-
13 van Name C, Fischer G, Kocher J. The science behind eddy current and remote field testing: for condenser and heat exchanger tubing. In: Proceedings of the ASME 2016 Power Conference; 2016; Charlotte, NC. New York: American Society of Mechanical Engineers; 2016. p. 1-6. https://doi.org/10.1115/POWER2016-59273
» https://doi.org/10.1115/POWER2016-59273 -
14 Jayaraman R, Solomon JS, Sridhar N, Krishnamurthy CV, Arunachalam K. Numerical modelling of remote field eddy current testing of steam generator tubes. In: Mukhopadhyay CK, Mulaveesala R, editors. Advances in non-destructive evaluation. Singapore: Springer; 2021. p. 239-248. (Lecture Notes in Mechanical Engineering). https://doi.org/10.1007/978-981-16-0186-6_24
» https://doi.org/10.1007/978-981-16-0186-6_24 -
15 Kako M, Tomizawa T, Ge J, Ruan X, Nozawa T, Yusa N. The applicability of remote field eddy current testing to outer flaws on cooling tubes in the blanket of a fusion DEMO reactor. Fusion Engineering and Design. 2023;194:113709. https://doi.org/10.1016/j.fusengdes.2023.113709
» https://doi.org/10.1016/j.fusengdes.2023.113709 -
16 Wang R, Bao B, Wang W, Zhang M, Liu L, Song K. Research on remote-field eddy current focusing method for detecting hidden defects in aircraft riveted components. Journal of Nondestructive Evaluation. 2023;42(4):95. https://doi.org/10.1007/s10921-023-01011-2
» https://doi.org/10.1007/s10921-023-01011-2 -
17 MathWorks. MATLAB version R2021a. 2021 [access 21 sept. 2024]. Available from: https://www.mathworks.com
» https://www.mathworks.com -
18 Ornelas R. Entendendo o Ensaio de Ultrassom IRIS. 2017 [access 21 sept. 2024]. Available from: https://newwavendt.com.br/entendendo-o-ensaio-de-ultrassom-iris/
» https://newwavendt.com.br/entendendo-o-ensaio-de-ultrassom-iris/ -
19 Al-Qadeeb FE. Tubing inspection using multiple NDT techniques. In: Proceedings of the 3rd MENDT– Middle East Nondestructive Testing Conference and Exhibition; 2005; Bahrain, Manama. Mayen: NDT.net; 2005 [access 16 mar. 2022]. p. 27-30. Available from: https://www.ndt.net/search/docs.php3?showForm=off&id=3309
» https://www.ndt.net/search/docs.php3?showForm=off&id=3309 -
20 Lee J, Xiao L, Schoenholz SS, Bahri Y, Novak R, Sohl-Dickstein J, et al. Wide neural networks of any depth evolve as linear models under gradient descent. Journal of Statistical Mechanics. 2020;2020(12):124002. https://doi.org/10.1088/1742-5468/abc62b
» https://doi.org/10.1088/1742-5468/abc62b - 21 Dodge Y. The concise encyclopedia of statistics. New York: Springer; 2008.
- 22 Johnson RA, Wichern DW. Applied multivariate statistical analysis. Upper Saddle River: Pearson; 2002.
-
Editor:
Hélio Cordeiro de Miranda.