
 Geoinformation Technology in the Assessment of Children's Mobility in Urban Areas: from the Planned to the Informal City
Abstract
The article presents the use of geoinformation technologies to support the spatial analysis of the suitability of urban roads for independent child mobility, aiming to understand the differences in opportunities between planned areas of the city and unplanned areas, the latter being an example of social vulnerability. The case studies are developed in connected areas in Belo Horizonte, with the first being the traditional planned city and the second a section of a favela and its surroundings. It explores models of Multicriteria Analysis by Weights of Evidence and Sensitivity Analysis to Suitability Evaluation. Based on the careful selection of analysis variables, supported by an extensive literature review on the subject, thematic maps are created, which characterize each occupation condition, according to physical characteristics, presence of infrastructure, types of use, and human occupation of space. Once the maps have been created with the initial variables, the collection is integrated for the spatial representation of the level of spatial vulnerability, and the levels of uncertainty in the spatial distributions are evaluated. The result is the identification of the planned area as more conducive to child development, in comparison to the social vulnerability area. The approach presents defensible and reproducible criteria for other future case studies.
Keywords:
Multicriteria Analysis; Sensitivity Analysis; Child Mobility; Child-Friendly Cities; Geoprocessing
Resumo
O artigo relata o emprego de tecnologias de geoinformação como suporte à análise espacial de adequabilidade de vias urbanas para a mobilidade infantil independente, com vistas a entender as diferenças de oportunidades entre áreas da cidade planejadas e áreas não planejadas, sendo as segundas em um exemplo de vulnerabilidade social. Os estudos de caso são desenvolvidos em áreas conectadas em Belo Horizonte, sendo a primeira a cidade tradicional projetada e a segunda um recorte de uma favela e seus arredores. Explora modelos de Análise de Multicritérios por Pesos de Evidência (Multicriteria Analysis) e de Análise de Sensibilidade para Avaliação de Adequação (Sensitivity Analysis to Suitability Evaluation). A partir da escolha criteriosa de variáveis de análise, apoiado por ampla revisão bibliográfica sobre o tema, são elaborados mapas temáticos que caracterizam cada condição de ocupação, segundo características físicas, presença de infraestrutura, tipologias de uso, ocupação humana do espaço. Uma vez elaboradas as variáveis iniciais, elas são integradas para espacialização do nível de vulnerabilidade espacial, e são avaliados os níveis de incerteza das distribuições espaciais. O resultado é a identificação da área planejada como mais propícia para o desenvolvimento da criança. A abordagem apresenta critérios defensáveis e reproduzíveis para outros estudos de caso futuros.
Palavras-chave:
Análise Multicritérios; Análise de Sensibilidade Mobilidade Infantil; Cidades para Crianças; Geoprocessamento
INTRODUCTION
The study of child mobility, whether active or independent, interests urban planners who aim to support policies which include this social group in fully accessing habitable conditions and developing their activities. These activities are part of free growth and building active, participative citizens. Children who begin with active mobility are potential adults who will likely use cars less. Research on the spatial quality related to children’s mobility prepares urban spaces for walkability because where children circulate, adults can also move more comfortably.
Research supported by funding agencies has been conducted to perform investigations on the topic, aiming to observe and measure how children utilise urban space in various activities from leisure and commuting to their daily tasks. The research specifically focused on children’s independent mobility, characterised by the child’s ability to move independently without significant safety risks, while also enjoying the collective space’s offerings in terms of play, environmental quality, social interaction, and shared information, among others (Savolainen et al., 2025).
Children’s independent mobility still faces many obstacles related to the possibility of minors gaining independence. There are more detailed and robust studies on the topic in other countries, as the issue of risk is not an initial barrier, allowing for more research on benefits and encouraging action (Ferreira et al., 2024; Weir, 2023; Frohlich; Collins, 2024).
Brazilian legislation does not specify a particular age at which a child can walk alone in the street, but it states that this decision should be made by parents based on the child’s maturity and the environment’s conditions in which they will travel. According to the Brazilian Civil Code, parents are responsible for ensuring their children’s well-being and must assess whether the child is capable of moving around alone safely. The -“Child and Adolescent Statute” (“Estatuto da Criança e do Adolescente” - ECA) provides guidance on adults’ responsibilities to protect children, but it also includes the right to come and go in public places, as specified in chapter II, Article 16: “to go, come and stay in public places and community spaces, respecting legal restrictions”.
Considering children’s interest and right to move freely, how can we clearly and practically understand the conditions of an environment regarding both safety and the importance of mobility?
This study offers a methodological proposal using defensible and reproducible criteria for evaluating the conditions of public spaces intended for mobility and permanence on public roads. Its aim is to understand the vulnerabilities and potentialities of existing conditions for children’s mobility, whether active and/or independent. The study addresses two areas with significantly different spatial conditions: a planned district with optimal urban features, and an area of social vulnerability and its surrounding influence, where children are more likely to walk. The selection of these two areas seeks to apply the spatial analysis methodology across different urbanisation contexts.
The first area worked on is delimited by Contorno Avenue in Belo Horizonte, characterised as a planned city. It was established as a city based on republican and positivist values in 1897, through the transfer of the capital from Ouro Preto to Belo Horizonte. The new capital was designed according to the principles of the garden city, featuring orthogonal roads in uniform, tree-lined grids, with a distribution of parks and squares, although it ignored the natural watercourses. The area bounded by Contorno Avenue was identified as a “central urban area” and housed the entire urban infrastructure, including transport, education, sanitation, and medical services; it also contained public buildings, along with commercial and service establishments.
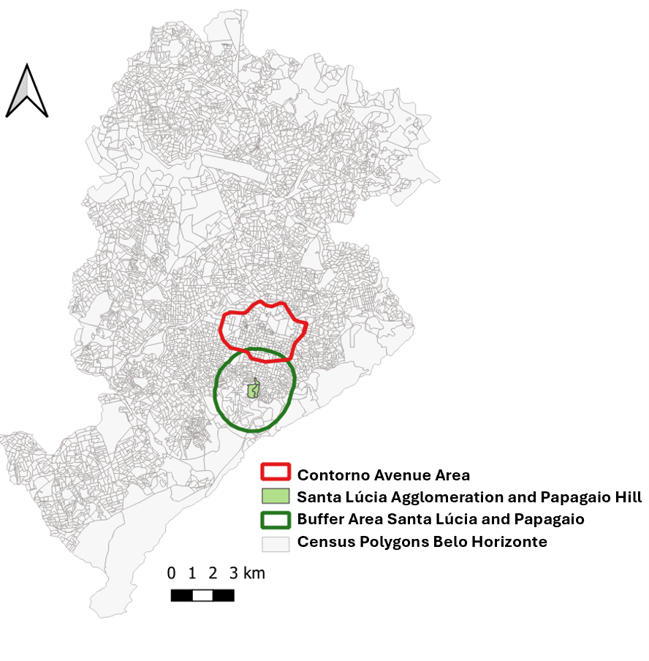
Belo Horizonte was originally planned to accommodate around 200,000 inhabitants, including the central, suburban, and rural areas. Today, 128 years after its inauguration, the city has 2,315,560 inhabitants, within an area of 331 square kilometres. The area bounded by Av. do Contorno has 83,905 inhabitants spread over 8.87 km² (IBGE, 2022) (Figure 1).
The study of active and children’s independent mobility within the area bounded by Contorno Avenue aimed to understand the main component variables in the best planned part of the city affecting the quality of urban spaces for children’s use. After identifying these variables, the study employed the “multicriteria analysis” (MCA, Weighted Sum) to rank the best and worst areas, along with the use of the “uncertainty analysis” method to pinpoint regions where doubts in the results might arise (sensitivity analysis for suitability evaluation - SASE) (Moura et al., 2024).
After the first study, a question was raised: what would the results be like if the study area presented social vulnerability conditions and was not so well served by urban resources? Thus, the investigation of this article stemmed from this question, which then used the same methodological process in the Papagaio Hill and Santa Lúcia urban slum regions (official names “Morro do Papagaio” and “Favela Santa Lúcia”). These are socially vulnerable areas classified as Villages, where 12,494 people live in 0.383 km². The principle of the walking influence zone where children move around was used when delineating the cluster areas. According to Moreno (2016), a person walking at an average of 4 km/h covers about 1 km in 15 minutes. Since children from these villages could also benefit from nearby resources, a spatial buffer of 1500 meters was established from the edges, considering a walking speed of between 4 and 5 km/h.

Location of study areas: Av. Contorno boundary area and Morro do Papagaio area and Santa Lúcia slum
Conceptual Foundations
Systematised geographic thinking originated from the Greeks, aiming to objectively analyse the location of phenomena and events using logic still closely related to mathematics and geometry. Geographic Information Systems (GIS) emerged with the advent of information technology in the late 1960s to utilise the spatial condition associated with all variables and structure data from this perspective. It is unquestionable that all phenomena and events today, whether physical or social, have territorial links and can be georeferenced, meaning they are tied to a geographic location. Understanding the spatialisation of issues offers new perspectives on scientific investigation, recognising that there are justifications and motivations with a geographic or spatial component.
In turn, the concept of geoprocessing arises with the emergence of GIS usage, which involves applying specialised modelling and analysis tools. The prefix “geo” relates to land, territory, and spatialisation, while the suffix “processing” derives from “process”, originating from Latin “processus”, meaning “moving forward” or “progress”. Geoprocessing enables data transformation into analysis through structuring it in GIS, opening new pathways to understanding reality.
Cowen (1990) conceptualised geoinformation technologies, including GIS and geoprocessing, as “computer-assisted systems for capturing, storing, retrieving, analysing and displaying spatial data”, described these tools as essential for handling spatial information. Secondini (1988) argues that using these technologies enhances various environmental research functions: acquiring and processing information; analysing data; formulating forecasts; generating system control proposals; and identifying solutions to problems. Tomlinson (1990) linked the term to the many opportunities for applying spatial analysis models. Dangermond (1983) emphasised the importance of the topological aspects of spatial data, which alter how information is utilised, as data is viewed not in isolation but as a network, making it crucial to understand the significance of each location within that network, along with data about variables measured at that site.
Highlighting the advantages of adopting GIS, Secondini (1988, p.96) argues that their resources: “...make possible a more analytical and objective observation of territorial organisation and, on the other hand, create new elements of knowledge and new suggestions for interpretation related to economic and social phenomena, depending on their distribution in the territory.”
Xavier-da-Silva (1992, p.48) provides a clear definition of geoprocessing: “it aims to treat environmental problems taking into account the location, extension and spatial relationships of the analysed phenomena, aiming to contribute to their present explanation and to monitoring their past and future evolution.”
Based on conceptual definitions, the main variables for the case study were defined as layers, obtained from data in the official cartography of Belo Horizonte through the Spatial Data Infrastructure portal (BHMap, 2024). The division of measurements into variables follows the principle discussed by Huggett (1980, p.17), who advocates for systemic analysis in selecting key variables that can explain a phenomenon, but systemically understood as interrelated elements which enable understanding complexity: “A complex system is logically and realistically simplified by discriminating parts of the system of subsystems at different levels of resolution which avoids the confusing mass of information.”
Once the layers of information were collected, they were spatially analysed using geoprocessing models that identify the occurrence areas classified based on their relevance to child mobility. Models in geography involve locational properties (where), thematic attributes (what), and temporal attributes (when), describing both time and space. According to Berry (1995), models can aim to represent conditions of scale, extent, objective, approach, technique, association, aggregation, and temporality.
It is a traditional approach in geoprocessing to combine thematic maps of occurrence concentrations by variables using multicriteria analysis based on weights of evidence (multicriteria analysis by weighted sum) (Bonham-Carter, 1994; Malczewski; Rinner, 2015). Multicriteria analysis relies on the principle of a systemic approach. According to Huggett (1980), the systemic approach is understood as a set of interacting parts which are not only combined, but also correlated. The systemic approach consists of elements (or objects - in this example, measurement points), states (or properties of objects - in this case, reported as variables in the columns of the associated table).
The layers of variables are initially captured separately to decompose reality and have already been analysed according to influence area models. The layers are then integrated through multicriteria analysis based on the value contained in each spatial element and considering the weight which indicates the importance of each layer. The aim is to reconstruct a unified view of the spatial concentration of the set of behaviours. The outcome is a ranking that identifies the most vulnerable areas compared to those with the greatest potential, from areas with the least favourable conditions to those best served. It is a numerical and quantitative analysis which seeks to enable qualitative interpretation.
The multicriteria analysis complements studies related to the level of uncertainty. They are known as the SASE model (Sensitivity Analysis for Suitability Evaluation), which adds information about the degree of doubt in the results depending on the behaviour of the variables. When a variable shows many changes in values under similar conditions, it indicates a level of uncertainty. SASE is based on the Monte Carlo weighted sum mathematical model, and provides detailed analysis according to the composition of identified situations: a) areas of high potential, but with uncertainties (which require further investigation); b) areas of high potential without uncertainty (robust positive results); c) areas of low potential, but with uncertainty (requiring more investigation for decision-making); and d) areas of low potential without uncertainty (Ligmann-Zielinska; Jankowski, 2008; Cakir et al. , 2021).
METODOLOGY
The process started with a case study in the area bounded by Contorno Avenue, a portion of the city established at its inception. The initial step was a literature review on the subject, aimed at identifying the main variables which influence the potential for active and children’s independent mobility (Adhikhari et al., 2021; Pan et al., 2021; Dixon et al., 2021; Ikeda et al., 2018; Danenberg et al., 2018; Smith et al., 2017; Ward et al., 2016; Lachowycz et al., 2012; Zdiara, 2018; Castro, 2018; Levner, 2018; Biddulph, 2012; Canciovici, 2018; Igel et al., 2020; Atles, 2018).
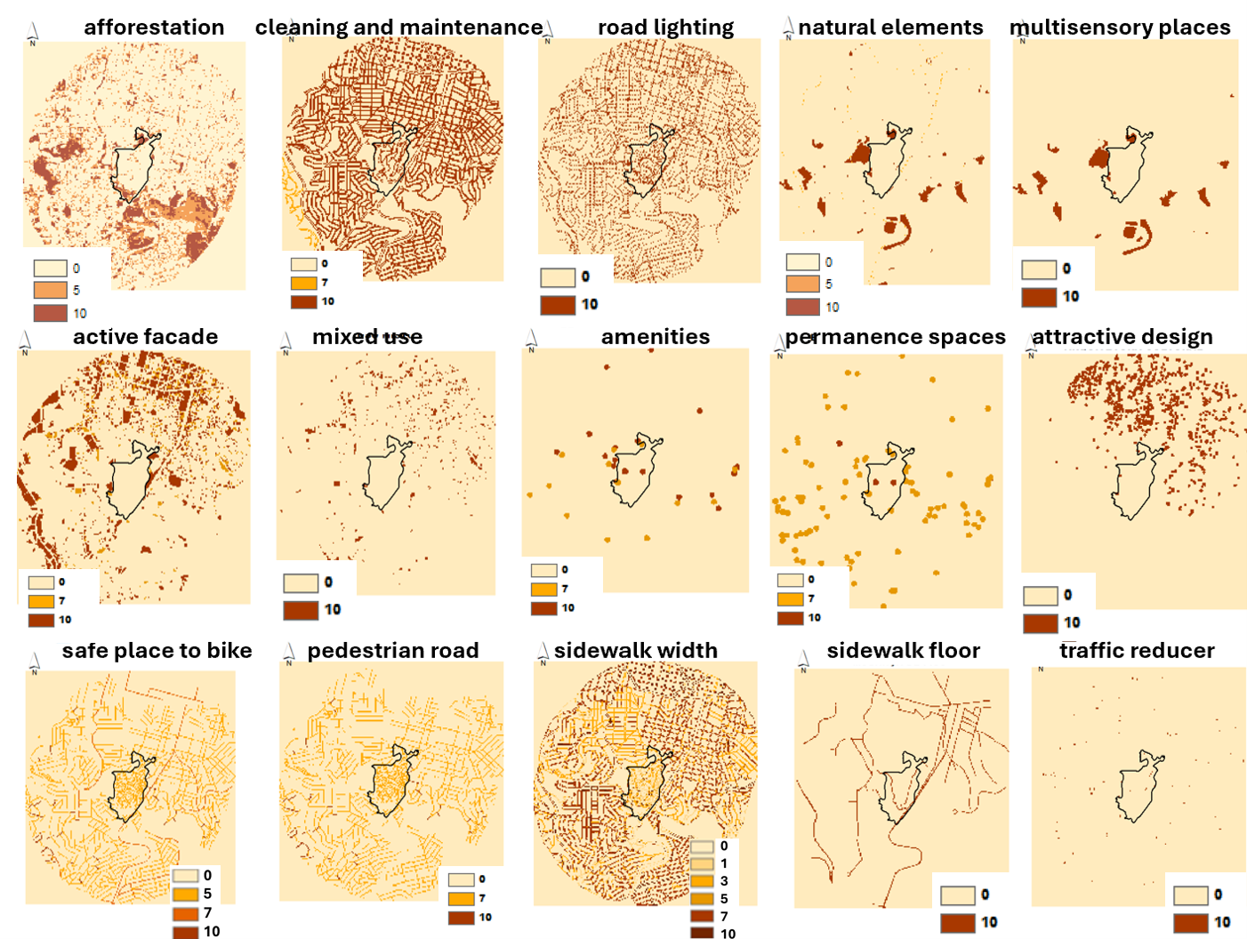
The variables for mapping were defined based on the main authors studied, comprising a collection of 15 maps categorised by topics of environmental interest, location, and movement: road afforestation; cleaning and maintenance; presence of lighting; natural features, flowers, planters, and animals; pleasant multisensory experiences (sound, water, wind); active facades, preferably with small businesses; mixed-use developments; presence of recreational environments and amenities; living spaces; attractive designs, colours, and textures, urban art; safe places to walk and cycle; road reduction, pedestrian streets, pedestrian crossings, traffic calming; sidewalk widths; painting or altering flooring materials; and physical barriers between sidewalks and the street.
First, two data collections were developed in the initial case study (area bounded by Contorno Avenue): one through field data collection and the other by obtaining technical maps provided by the City Hall (SDI - BHMap geoportal - Spatial Data Information). Since the results from the first study were similar in the second study (Papagaio Hill and Santa Lúcia urban slum) when using both field data and technical data from the public platform, it was decided to solely rely on technical maps which were directly obtained from the geoportal BHMap or used as a proxy (when specific data was unavailable, but other data could serve as an alternative). The original data existed as vector files in both studies but were converted into raster format to facilitate integration into the Multi-Criteria Analysis (MCA).
The data available on the geoportal BHMap platform is very comprehensive, enabling all planned measurements and mappings to be completed. These included using influence area models, concentration of occurrence models, or simple classification of legends based on their relevance to the topic, from the most appropriate to the least appropriate.
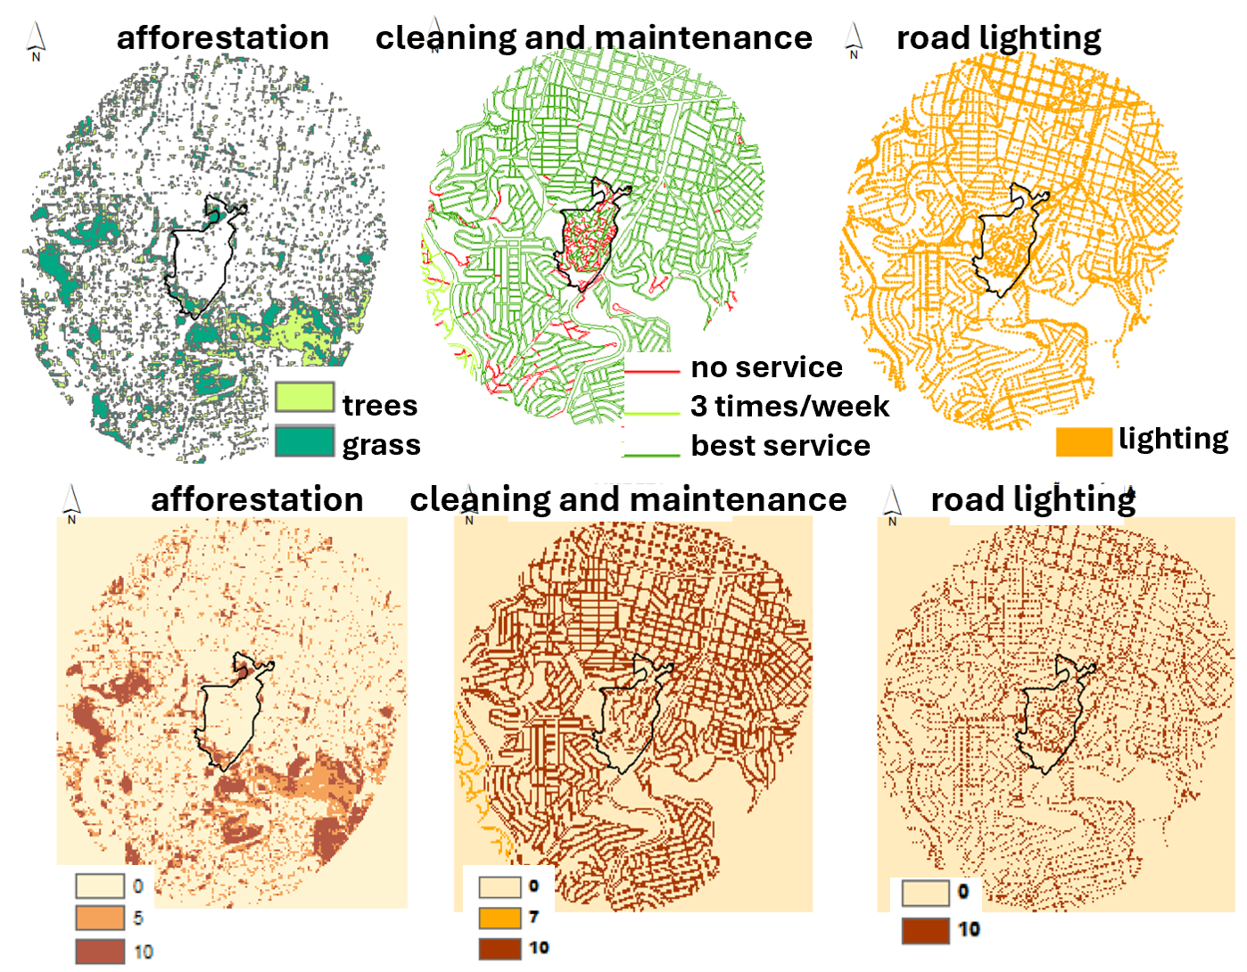
The maps were refined to develop spatial distribution models that indicate the area of influence of occurrences, moving beyond simple cartographic data representation. This involves shifting from representation models to process models (Steinitz, 2012). The thematic maps were converted to raster format, and their legends were reclassified from 0 to 10 based on the degree of relevance to the investigation (Figure 2, Figure 3).
Different methods were used in the initial study of Contorno Avenue to gather opinions from various participant groups regarding the significance of the variables for the investigation. This process resulted in a weights table for use in the multicriteria analysis based on weights of evidence (MCA weighted sum). The same weight ratios obtained in the first case study were applied in the second to facilitate comparison of results (Figure 4).
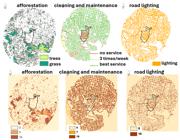
Transformation of representation models into process models, normalized from 0 to 10. Papagaio Hill and Santa Lúcia urban slum
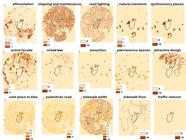
Collection of maps in process models, normalized from 0 to 10. Papagaio Hill and Santa Lúcia urban slum
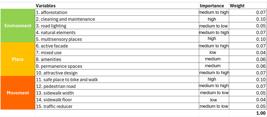
Once the maps were prepared, they were integrated using MCA (multicriteria analysis) based on the relationship between weights and scores. The weights represent the relative importance of each variable, while the scores are normalised values ranging from 0 to 10, reflecting their relevance to the desired synthesis (spatial quality of roads and public places for child mobility).
MCA integration is a quantitative model which presents a classificatory ranking with values from 0 to 10 based on potentialities and vulnerabilities. The SASE model was also applied to verify uncertainties to add quality to the studies, spatialising the locations where the results should be interpreted as less robust. The maps, which were in raster format according to the processes model stage, were converted to points (one point in each raster cell) to use the SASE method, as the algorithm requires identifying units as graphic primitives to associate them with attribute tables and to apply the script. We used the script provided by Prof. P. Jankowski (Moura; Jankwski, 2016).
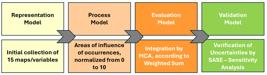
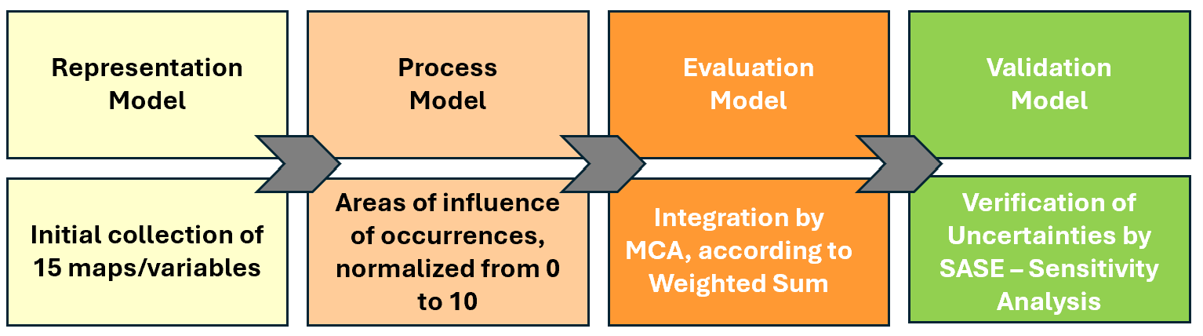
Thus, the methodological framework is summarized in the following the figure:
DEVELOPMENT AND DISCUSSION
Quantitative maps of potentiality and vulnerability to active and children’s independent mobility were produced after synthesising the variables for both the case study of the area delimited by Contorno Avenue (a planned city), which is an early research stage, and for the influence area of the Santa Lúcia slum and Papagaio Hill (an unplanned social vulnerability zone).
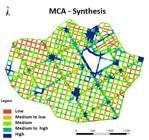
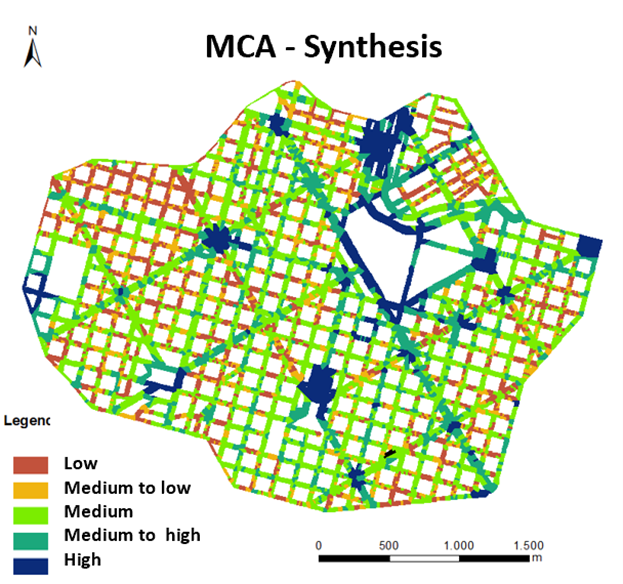
The maps, ranked from 0 to 10, highlight the most and least favourable areas based on the combination of the 15 analysis variables. It is observed that there is a significant presence of spaces classified as high potential in the case study of Contorno Avenue, mainly located in parks, squares, and roads with qualified conditions (Figure 6). In contrast, the case study of the Santa Lúcia slum and Papagaio Hill indicates that the best values close to 10 were not achieved, with the highest being 6.12, suggesting that the area has close to medium potential, with some medium to high points (Figure 7).
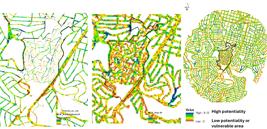
Result of the MCA in the Santa Lúcia slum and Papagaio Hill on roads and public places transformed into points in the surroundings
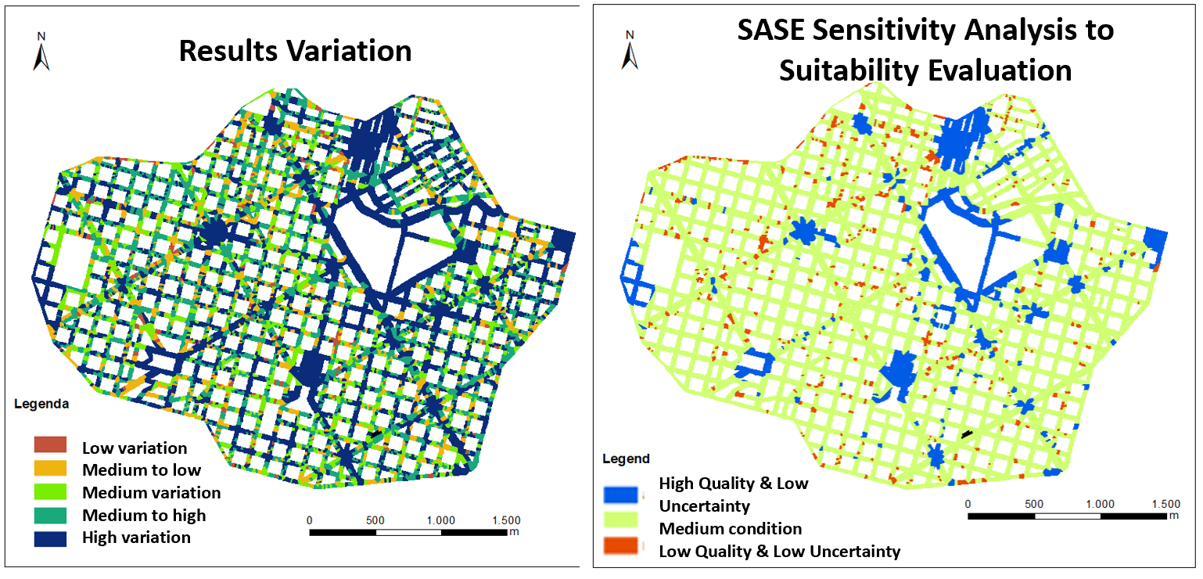
In evaluating the uncertainties through the SASE script, it is observed that there is a predominance of low variation in the behaviour of the variables in the Contorno Avenue area, with little variation or uncertainty in the results. In turn, high-quality places for child mobility are highlighted by combining the classification of potential (MCA analysis) with the verification of uncertainties (SASE analysis), and there is low uncertainty in the results. This indicates that the results are robust; most places identified as very positive are genuinely positive, and the area is suitable for active or children’s independent mobility. Conversely, there are also areas classified as vulnerable or of low potential or quality, with low uncertainty regarding these statements, mapping places which could be targets for improvements or actions (Figure 8).
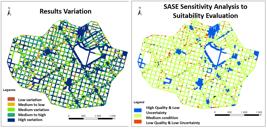
SASE result within the limits of Contorno Avenue highlighting uncertainties and combining potential areas with uncertainty levels
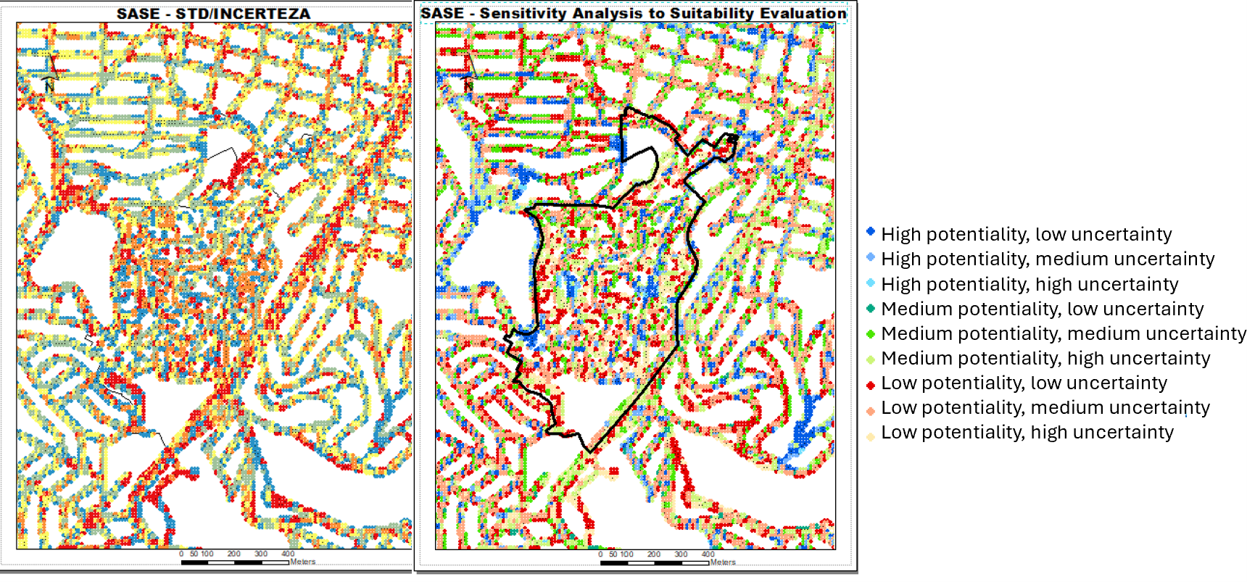
Next, a predominance of uncertainty is observed in the analysis of the distribution of uncertainties in the case study of the Santa Lúcia slum and Papagaio Hill due to the greater variability of existing conditions. It is possible to identify some well-defined areas with low uncertainty by combining potential analysis (MCA) with uncertainty analysis (SASE), which are the positive areas with more reliable results. Conversely, the most negative areas without uncertainty can also be observed where vulnerable zones are present, and there is no doubt about it (Figure 9).

SASE result in the Santa Lúcia Slum and Papagaio Hill highlighting the uncertainties and combining potential areas with uncertainty levels
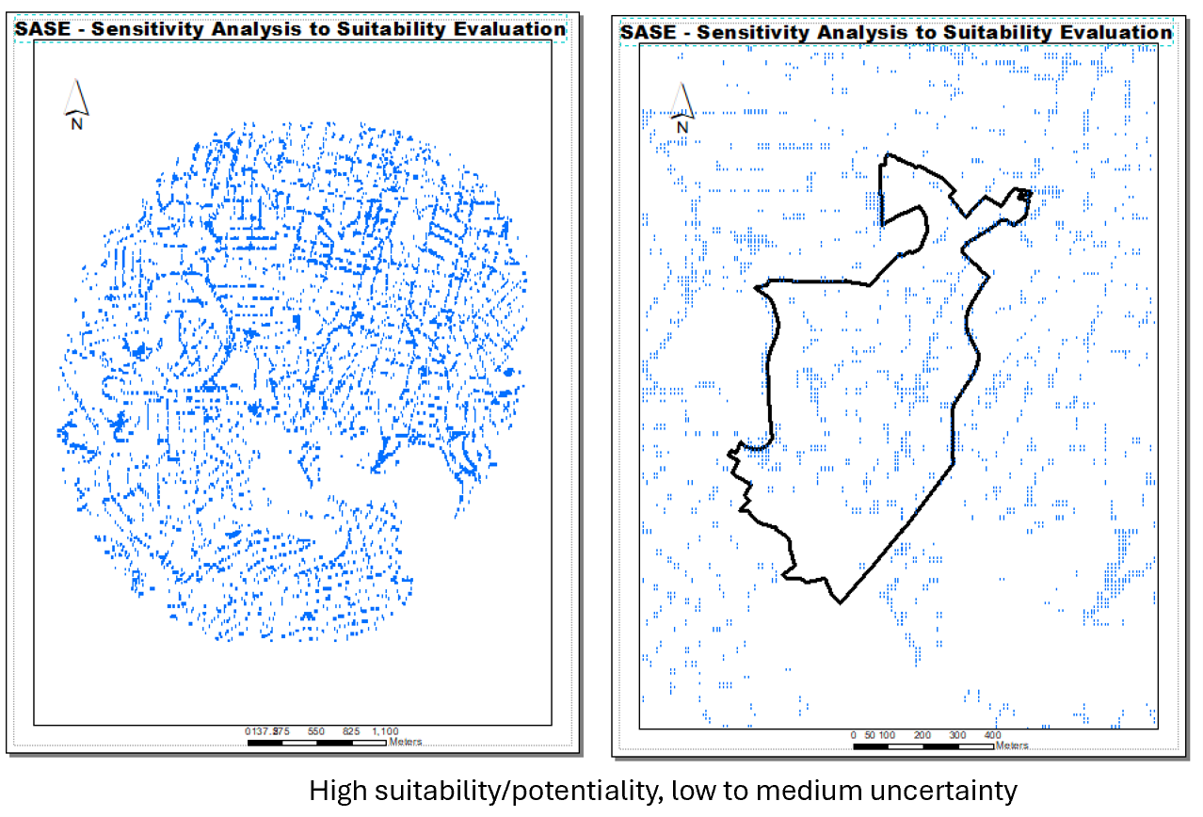
In analysing the evaluation of the Santa Lúcia slum and Papagaio Hill considering an influence area of 1.5 km or a 15-minute walk, it is evident that there is a higher concentration of positive areas in the north. This aligns with the projected city area, highlighting disparities in opportunities and conditions. Potential clusters along a road axis extending from the centre-south to the northeast of the slum indicate a priority zone for implementing initiatives that benefit children, or even for tactical urbanism and playful activities that encourage public space engagement. Additionally, there are two larger spaces at the south/west edge of Jornalista Eduardo Couri Park, Santa Lúcia Dam, and further west in the central part near Santo Antônio Park (Figure 10).
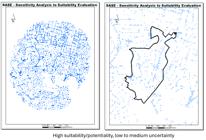
Distribution of the most suitable areas, and where there is less uncertainty in the results around the area and inside it
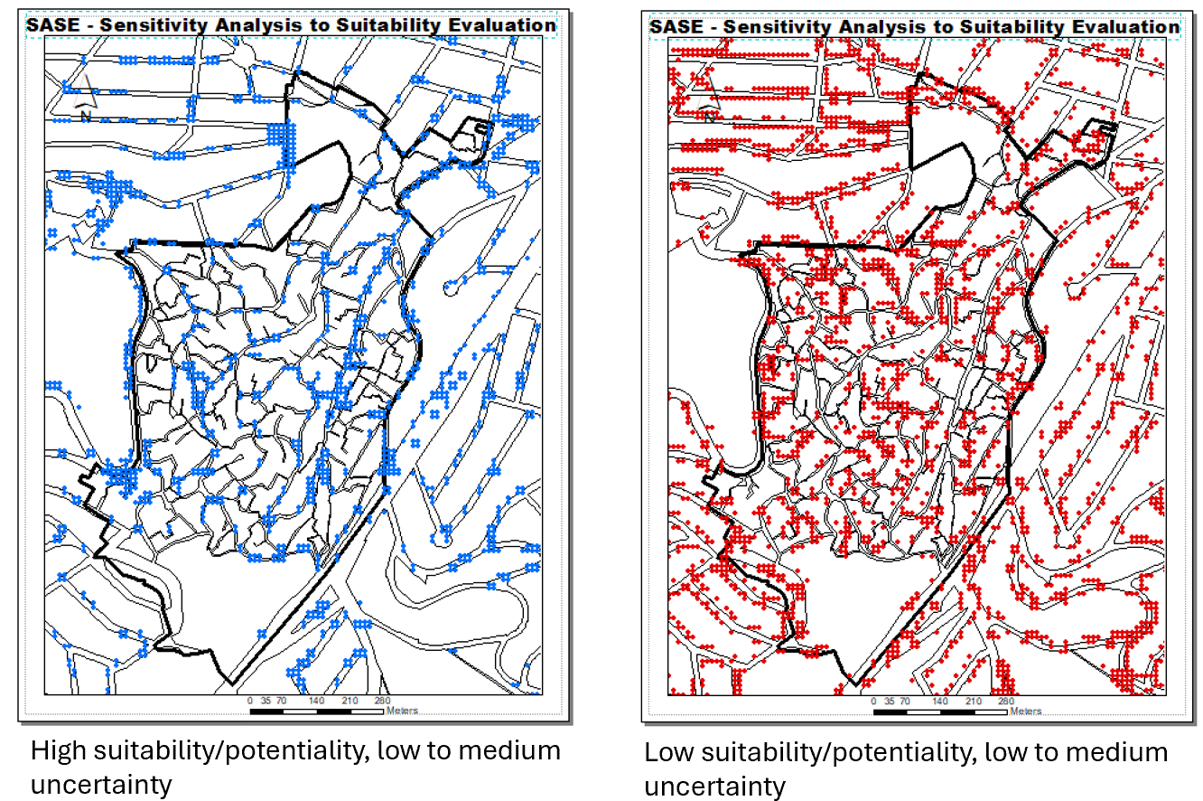
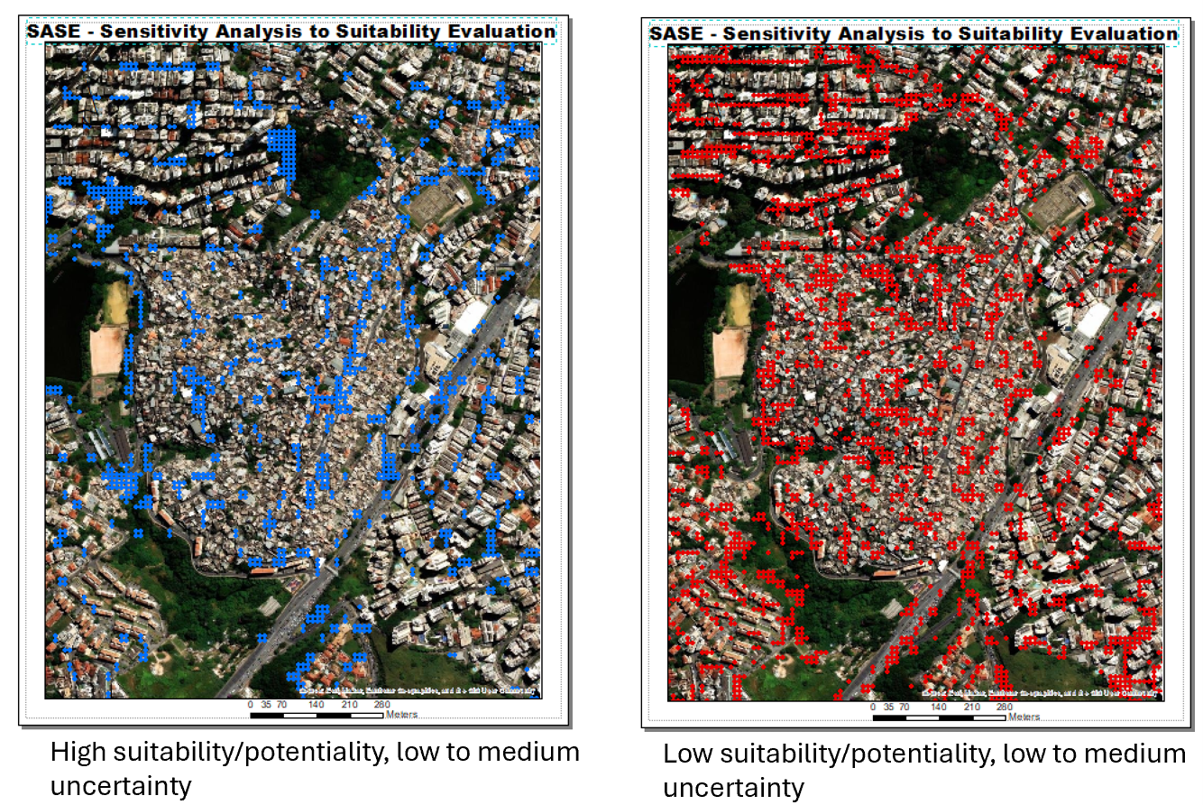
Subsequently comparing the distribution of positive and negative points with high potential and high vulnerability, it is observed that the worst conditions are more numerous and widely spread. The points of low or medium uncertainty were highlighted to analyse the most robust results. The distribution map of positive points, indicating potential, confirms the importance of São Tomás de Aquino Road, as well as the edges of the parks already mentioned, alongside an area at the junction of Principal Road and Tancredo Neves Road (Figure 11, Figure 12).
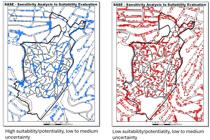
Distribution of the most favourable and least favourable areas, where there is less uncertainty about the results

Distribution of the most favourable and least favourable areas, with less uncertainty about the results in the cluster, with Satellite image in the background
CONCLUSIONS
The studies demonstrate the potential of geoinformation technologies in identifying priority areas for installing activities aimed at children, defined as those with conditions that support active and/or children’s independent mobility.
The work presents a methodological framework with clear, defensible, and reproducible criteria. It begins with a bibliographical review to select the investigation variables; organisation and selection of free, public data for creating the information layers; transformation of data into spatial information through models of the area of influence of occurrences; and normalization of the map layers to allow their integration. This process ultimately results in the spatial distribution of potentialities and vulnerabilities.
The criteria are justifiable because they are clearly explained, step by step, and they are reproducible because they can be repeated for spatial sections with minimal georeferenced data collection. The study goes further than simply integrating variables through multicriteria analysis by validating the results through examining the existing level of uncertainty.
Similar studies can be undertaken in other urban areas, provided there is data on the relevant variables or the researcher is willing to conduct fieldwork to create the maps (an activity which was performed in the first case study, the area around Contorno Avenue).
However, if cartographic data about the variables are available, they can be utilised. Therefore, the results of integrating public data were compared with those of integrating variables collected in the field to validate this approach, and the conclusion was that it was both possible and sufficient to solely work with public data, which proved to be entirely satisfactory.
The process can be repeated using free geoprocessing software for representation, processing, and analysis models; however, the script used for SASE studies is proprietary and functions as an ArcGIS plugin. There are also plans to develop an ETL (Extract, Transform, Load) script, since the logic is open and the code was originally written in Python.
The significance of the SDI (Spatial Data Infrastructure) in Belo Horizonte, BHMap geoportal, published by the City Hall, is noteworthy. Territories that invest in sophisticated geographic information systems, which can be freely accessed by users via wms (web map service) and/or wfs (web feature service), enable researchers or planners to avoid wasting time creating data from scratch, and instead allow them to focus their expertise on qualified spatial analysis.
It is also noteworthy that geoinformation technology transforms data into information when used according to the latest standards, which means acquiring knowledge. The geovisualisation of the entire process allows us to see what was previously invisible, relying on intuition and avoiding unproven statements.
The results of the investigations confirm the socio-environmental quality of the planned urban area, outlined by Contorno Avenue, and highlight the fragility of Papagaio Hill and the Santa Lúcia slum area, where unplanned urbanisation has occurred. Despite the numerous challenges in the unplanned area, some potential development sites were identified, enabling new actions which could foster a more favourable environment.
ACKNOWLEDGMENTS
Article developed as a contribution to the CNPq/MCTI project N 10/2023 - UNIVERSAL; Process Number: 406500/2023-1 (Small-scale interventions for children to reclaim public open spaces: a step towards children’s independent mobility).
We thank Prof. Paula Barros, coordinator of the aforementioned research, for the discussions about children’s independent mobility and for English text composition.
DATA AVAILABILITY
The data that support the findings of this study can be made available, upon reasonable request, from the corresponding author [Ana Clara Mourão Moura].
References
-
ADHIKHARI, D.; HENDERSON, T.; DOLCE, M.; BANKS, A.; ZAIM, H.; ONWUKA, A.; JONES, N. An evaluation of PlayStreets in the South Side neighborhood of Columbus, Ohio. Public Health, n. 141, p. 97-101, 2021. https://doi.org/10.1177/1757913921990411
» https://doi.org/10.1177/1757913921990411 - ATLES, R. K. Playable Street to reclaim independent play for all children. In: DANENBERG, R.; DOUMPA, V.; KARSSENBERG, H. (eds.). The City at Eye Level for Kids. Rotterdam: STIPO, 2018. p. 160-163.
-
BELO HORIZONTE (Município). BHMap - Sistema de Informações Geográficas de Belo Horizonte. Belo Horizonte: PBH, 2024. Disponível em: https://bhmap.pbh.gov.br Acesso em: 17 jul. 2024.
» https://bhmap.pbh.gov.br -
BERRY, B. J. What is a model. GIS World, v. 8, n. 1, p. 26-28, 1995. https://doi.org/10.1088/2058-7058/8/11/25
» https://doi.org/10.1088/2058-7058/8/11/25 -
BIDDULPH, M. Radical streets? The impact of innovative street designs on liveability and activity in residential areas. Urban Design International, n. 17, p. 178-205, 2012. https://doi.org/10.1057/udi.2012.13
» https://doi.org/10.1057/udi.2012.13 - BONHAM-CARTER, G. Geographic Information Systems for Geoscientists: modelling with GIS. Ottawa: Pergamon, 1994. 397 p.
-
CAKIR, S.; HECHT, R.; KRELLENBERGA, K. Sensitivity analysis in multi-criteria evaluation of the suitability of urban green spaces for recreational activities. AGILE: GIScience Series, v. 2, p. 22, 2021. https://doi.org/10.5194/agile-giss-2-22-2021
» https://doi.org/10.5194/agile-giss-2-22-2021 - CANCIOVICI, C. The plinth-A portal to play. In: DANENBERG, R.; DOUMPA, V.; KARSSENBERG, H. (eds.). The City at Eye Level for Kids. Rotterdam: STIPO, 2018. p. 148-151.
- CASTRO, D. M. Corners for kids: Quality spaces small scale. In: DANENBERG, R.; DOUMPA, V.; KARSSENBERG, H. (eds.). The City at Eye Level for Kids. Rotterdam: STIPO, 2018. p. 143-147.
- COWEN, D. GIS versus CAD versus DBMS: what are the differences? In: PEUQUET, D.; MARBLE, D. (eds.). Introductory Readings in Geographic Information Systems. London: Taylor & Francis, 1990. p. 52-61.
- DANENBERG, R.; DOUMPA, V.; KARSSENBERG, H. The City at Eye Level for Kids. Rotterdam: STIPO, 2018. 394 p.
- DANGERMOND, J. A classification of software components commonly used in geographical information systems. In: MARBLE, D.; CALKINS, H.; PEUQUET, D. (eds.). Basic Readings in Geographic Information Systems. Amherst: SPAD Systems, 1983.
-
DIXON, B. N.; UGWOABA, U. A.; BROCKMANN, A. N.; ROSS, K. M. Associations between the built environment and dietary intake, physical activity, and obesity: A scoping review of reviews. Obesity Reviews, v. 22, e13171, 2021. https://doi.org/10.1111/obr.13171
» https://doi.org/10.1111/obr.13171 -
FERREIRA, Inês A.; FORNARA, Ferdinando; PINNA, Vanessa; MANCA, Andrea; GUICCIARDI, Marco. Autonomy as key to healthy psychological well-being: A systematic literature review on children’s independent mobility, cognitive and socio-emotional development. Journal of Transport & Health, v. 38, p. 101837, 2024. https://doi.org/10.1016/j.jth.2024.101837
» https://doi.org/10.1016/j.jth.2024.101837 -
FROHLICH, Katherine L.; COLLINS, Patricia A. Children’s right to the city and their independent mobility: why it matters for public health. Journal of Epidemiology and Community Health, v. 78, n. 1, p. 66-68, 2024. https://doi.org/10.1136/jech-2023-221067
» https://doi.org/10.1136/jech-2023-221067 - HUGGETT, R. Systems analysis in geography: contemporary problems in geography Oxford: Clarendon Press, 1980. 208 p.
-
IBGE - Instituto Brasileiro de Geografia e Estatística. Censo Demográfico 2022: resultados. Rio de Janeiro: IBGE, 2023. Disponível em: https://www.ibge.gov.br Acesso em: 12 dez. 2024.
» https://www.ibge.gov.br -
IGEL, U.; GAUSCHE, R.; KRAPF, A.; LÜCK, M.; KIESS, W.; GRANDE, G. Movement-enhancing footpaths-A natural experiment on street design and physical activity in children in a deprived district of Leipzig, Germany. Preventive Medicine Reports, v. 20, 101197, 2020. https://doi.org/10.1016/j.pmedr.2020.101197
» https://doi.org/10.1016/j.pmedr.2020.101197 -
IKEDA, E.; STEWART, T.; GARRETT, N.; EGLI, V.; MANDIC, S.; HOSKING, J.; WITTEN, K.; HAWLEY, G.; TAUTOLO, E. S.; RODDA, J.; MOORE, A.; SMITH, M. Built environment associates of active school travel in New Zealand children and youth: A systematic meta-analysis using individual participant data. Journal of Transport & Health, v. 9, p. 117-131, 2018. https://doi.org/10.1016/j.jth.2018.04.007
» https://doi.org/10.1016/j.jth.2018.04.007 -
LACHOWYCZ, K.; JONES, A. P.; PAGE, A. S.; WHEELER, B. W.; COOPER, A. R. What can global positioning systems tell us about the contribution of different types of urban greenspace to children’s physical activity? Health & Place, v. 18, p. 586-594, 2012. https://doi.org/10.1016/j.healthplace.2012.01.006
» https://doi.org/10.1016/j.healthplace.2012.01.006 - LEVNER, A. Turning spaces into places. In: DANENBERG, R.; DOUMPA, V.; KARSSENBERG, H. (eds.). The City at Eye Level for Kids. Rotterdam: STIPO, 2018. p. 127-129.
-
LIGMANN-ZIELINSKA, A.; JANKOWSKI, P. A framework for sensitivity analysis in spatial multiple criteria evaluation. In: COVA, T. J.; MILLER, H. J.; BEARD, K.; FRANK, A. U.; GOODCHILD, M. F. (eds.). Geographic Information Science. Berlin: Springer, 2008. p. 217-232. https://doi.org/10.1007/978-3-540-87473-7_14
» https://doi.org/10.1007/978-3-540-87473-7_14 -
MALCZEWSKI, J.; RINNER, C. Multicriteria Decision Analysis in Geographic Information Science. New York: Springer, 2015. https://doi.org/10.1007/978-3-540-74757-4
» https://doi.org/10.1007/978-3-540-74757-4 -
MORENO, C. La ville du quart d'heure: pour un nouveau chrono urbanisme. 2016. Disponível em: https://www.latribune.fr/regions/smartcities/la-tribune-de-carlos-moreno/la-ville-du-quart-d-heure-pour-un-nouveauchrono-urbanisme-604358.html Acesso em: 10 fev. 2024.
» https://www.latribune.fr/regions/smartcities/la-tribune-de-carlos-moreno/la-ville-du-quart-d-heure-pour-un-nouveauchrono-urbanisme-604358.html -
MOURA, A. C. M.; JANKOWSKI, P. Contribuições aos estudos de análises de incertezas como complementação às análises multicritérios - “Sensitivity Analysis to Suitability Evaluation”. Revista Brasileira de Cartografia, n. 68/4, p. 665-684, 2016. https://doi.org/10.14393/rbcv68n4-44274
» https://doi.org/10.14393/rbcv68n4-44274 -
MOURA, A. C. M.; ROSA, A. A.; BARROS, P. Children’s independent mobility in urban planning: geospatial technology with a technical approach and citizens’ listening. Geographies, v. 4, p. 115-140, 2024. https://doi.org/10.3390/geographies4010008
» https://doi.org/10.3390/geographies4010008 -
PAN, X.; ZHAO, L.; LUO, J.; YINHAO, L.; ZHANG, L.; WU, T.; SMITH, M.; DAI, S.; JIA, P. Access to bike lanes and childhood obesity: A systematic review and meta-analysis. Obesity Reviews, v. 22, e13042, 2021. https://doi.org/10.1111/obr.13042
» https://doi.org/10.1111/obr.13042 -
SAVOLAINEN, E.; LINDQVIST, A. K.; FORSBERG, H.; RUTBERG, S. Accompaniment, benefits, and community connection: Voicing children’s perspectives on independent active transport. Journal of Transport & Health, v. 44, p. 102096, 2025. https://doi.org/10.1016/j.jth.2025.102096
» https://doi.org/10.1016/j.jth.2025.102096 - SECONDINI, P. (org.). La conoscenza del territorio e dell’ambiente: il ruolo delle tecnologie dell’informazione. Milano: Enidata, 1988. 269 p. (Coleção Dati & Fatti).
-
SMITH, M.; HOSKING, J.; WOODWARD, A.; WITTEN, K.; MACMILLAN, A.; FIELD, A.; BAAS, P.; MACKIE, H. Systematic literature review of built environment effects on physical activity and active transport-An update and new findings on health equity. International Journal of Behavioral Nutrition and Physical Activity, v. 14, p. 158, 2017. https://doi.org/10.1186/s12966-017-0613-9
» https://doi.org/10.1186/s12966-017-0613-9 - STEINITZ, C. A framework for geodesign: changing geography by design. Redlands: ESRI, 2012.
- TOMLINSON, R. Geographic Information System - new frontier. In: PEUQUET, D.; MARBLE, D. (eds.). Introductory Readings in Geographic Information Systems. London: Taylor & Francis, 1990. p. 18-29.
-
WARD, J. S.; DUNCAN, J. S.; JARDEN, A.; STEWART, T. The impact of children’s exposure to greenspace on physical activity, cognitive development, emotional wellbeing, and ability to appraise risk. Health & Place, v. 40, p. 44-50, 2016. https://doi.org/10.1016/j.healthplace.2016.04.015
» https://doi.org/10.1016/j.healthplace.2016.04.015 -
WEIR, H. Children’s autonomous mobility and their well-being. Wellbeing, Space and Society, v. 4, p. 100134, 2023. https://doi.org/10.1016/j.wss.2023.100134
» https://doi.org/10.1016/j.wss.2023.100134 - XAVIER-DA-SILVA, J. Geoprocessamento e análise ambiental. Revista Brasileira de Geografia, v. 54, p. 47-61, jul./set. 1992.
- ZDIARA, A. The city as playground, museum, cinema & classroom. In: DANENBERG, R.; DOUMPA, V.; KARSSENBERG, H. (eds.). The City at Eye Level for Kids. Rotterdam: STIPO, 2018. p. 139-141.
-
ASSOCIATE EDITOR:
Silvio Carlos Rodrigues. https://orcid.org/0000-0002-5376-1773

 Source: The authors (2024), using
  Source: The authors (2024).
 Source: The authors (2024).
 Source: The authors (2024).
 Source: The authors (2024).
 Source: The authors (2024).
 Source: The authors (2024).
 Source: The authors (2024).
 Source: The authors (2024).
 Source: The authors (2024).
 Source: The authors (2024).
 Source: The authors (2024).