 The 9th Victor de Mello lecture: reflections and speculations
Abstract
The paper reviews the published literature on some aspects of fabric and particle behaviour in cohesionless soils. It uses insights from Discrete Element Modelling and Microcomputed Tomography to speculate on reasons for the difference in behaviour observed between moist tamped and sedimented sands at the same global void ratio and stress state. It is suggested that inhomogeneities in the form of macrovoids in moist tamped samples trigger localisation, collapse and the development of a local scale chain reaction. It questions whether a similar sequence applies at the field scale and whether expansive partial drainage influences the rate of propagation of the chain reaction. The paper offers reasons why the use of critical state based on moist tamped samples to assess the stability of tailings, may not be the best approach, and suggests that identifying instability lines for sedimented samples at appropriate void ratios and principal stress directions, may be preferable. Critical state reflects behaviour at large strains where initial and evolving inhomogeneities affect identification of relevant void ratios; instability lines reflect behaviour at small strains where inhomogeneities probably initiate collapse. The paper emphasises the importance of spatial variations in local void ratios in loose material, the importance of anisotropy of collapse potential and of load-controlled rather that strain-controlled shearing.
Keywords:
Localisation; Steady and critical state; Instability; Anisotropy of collapse potential; Fabric; Spatial variation in local void ratio; Moist tamped and sedimented samples; Chain reaction
1. Introduction
I met Victor de Mello in March 1977 when he spent time at Imperial College, prior to delivering his Rankine Lecture, a lecture that demonstrated his depth of practical and theoretical knowledge, his enthusiasm and his stamina. My recollection is that the lecture lasted 2 hours 20 minutes; the previous dry run, I understand, took 4 hours.
Unlike most of the previous de Mello Lecturers, I have not had the privilege of working with Victor, although we exchanged correspondence about my work at the Bothkennar soft clay test site in the early nineties. I have, however, had the great pleasure of working with and becoming a close friend of his son, Luiz Guilherme de Mello, more than ‘a chip off the old block’ from whom I have learnt much about his father. Of course, I also have the huge benefit of access to the amazing book on Victor (Figure 1), assembled by Luiz and his sister, Lucia. I also have the benefit of the anecdotes and Victor’s quotations presented by the previous Lecturers.

Reflections – inspired by the cover of Victor’s biography and the title of his Rankine Lecture.
1.1 Reflections
The photograph on the cover of Victor’s book, showing him in reflective mood in his reflection in the window of the train carriage, first gave me the idea of ‘reflections’ for my title. Then I remembered the use of ‘reflections’ in the title of Victor’s Rankine Lecture and in the title of John Burland’s First De Mello Lecture in 2008.
In his De Mello Lecture, Michele Jamiolkowski provides the following quote from Victor, ‘We professionals beg less rapid novelties, more renewed reviewing of what is already there’. Like Michele, I use that as the theme of this presentation. It gives me the excuse to go back to my Rankine Lecture in 1998 and, using research information published by others, reflect on some of the developments over the last 25 years, particularly in the area of particulate soil mechanics.
1.2 Speculation
Looking back at my Rankine Lecture, I now realise how much I speculated about the explanation of laboratory and field observations on the basis of fabric - now referred to as ‘explaining macro observations on the basis of micro or particulate mechanics in multi-scale analyses.’. These speculations meant that I strayed unknowingly into areas occupied by specialists, to whom I apologise for the past and present.
My speculating days should be over because of developments in discrete element modelling (DEM) and microcomputed tomography, which eliminate the need for speculation. However, this lecture gives me the opportunity to speculate one last time, using some of the insights from a review of publications on DEM and tomography. I begin with this review before reflecting and speculating.
1.3 Context
Two quotations, one from Victor that is taken from his paper to the International Dam Congress in 1980, and one from Reid & Fanni (2022), provide some context for the presentation.
De Mello (1980): “To sum up, I allow myself to say that in the case of water dams our experience has been so positive that the future invites the indispensable optimization of economics. On the other hand, when it comes to tailings dams, very justified are the concerns that, with time, the raises, and the multiplication of diverse cases, the invitation to unpleasantness and failures is open, and with a free ticket. We are only at the start, which favours us: let us do the re-considerations and revisions that the subject, and the gravity of concern, demand”.
On the basis of the recent history of tailings dam failures, it seems that the necessary re-considerations and revisions have not been done, so what could be improved?
Reid & Fanni (2022): “The critical state approach, based heavily on the use of the moist tamping (MT) reconstitution method, is finding increasing application in tailings engineering practice”.
This statement invites the question – is this really the wisest approach?
In a setting of flow failures and tailings I will reflect and speculate on: localisation, critical state, anisotropy of undrained strength and instability in sedimented sands, void ratio and its spatial distribution, moist tamped samples and chain reactions.
1.4 Definitions
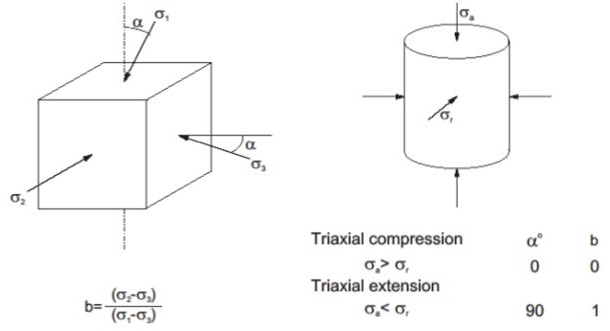
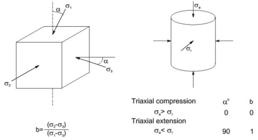
Some definitions first, referring to Figure 2: the angle between the vertical and the direction of the major principal stress is alpha; the relative value of the intermediate stress, σ2, is expressed by the parameter b; in a triaxial compression test, alpha is 0 and b is 0; in a triaxial extension test alpha is 90 degrees and b is 1.
2. Discrete Element Modelling, DEM
Discrete element modelling, DEM, predicts the displacements and rotations of discrete elements which represent idealised rigid soil particles. It provides information on forces at particle contacts and so on the development of strong force chains/load columns. It enables explanations in terms of particulate/microscale behaviour to be put forward for macroscale observations. This has particularly been the case for laboratory tests on soils, providing reassurance on validity of previously controversial observations such as: phase transformation; the effect of the intermediate stress ratio, b, and of the major principal stress direction, alpha, as identified in the hollow cylinder apparatus (HCA); instability and critical state. DEM results support intuition and correct speculation.
DEM permits exploration of behaviour under conditions that are not achievable in the laboratory, particularly at critical state. It enables comparisons to be made between simulated experiments on identical samples that use perfect boundary conditions and imperfect rigid and flexible boundaries that introduce boundary restraints; from these, information on strain localisation is obtained, supplementing that from microcomputed tomography.
Modelling realistic particle shapes is a challenge.
2.1 DEM - force chains
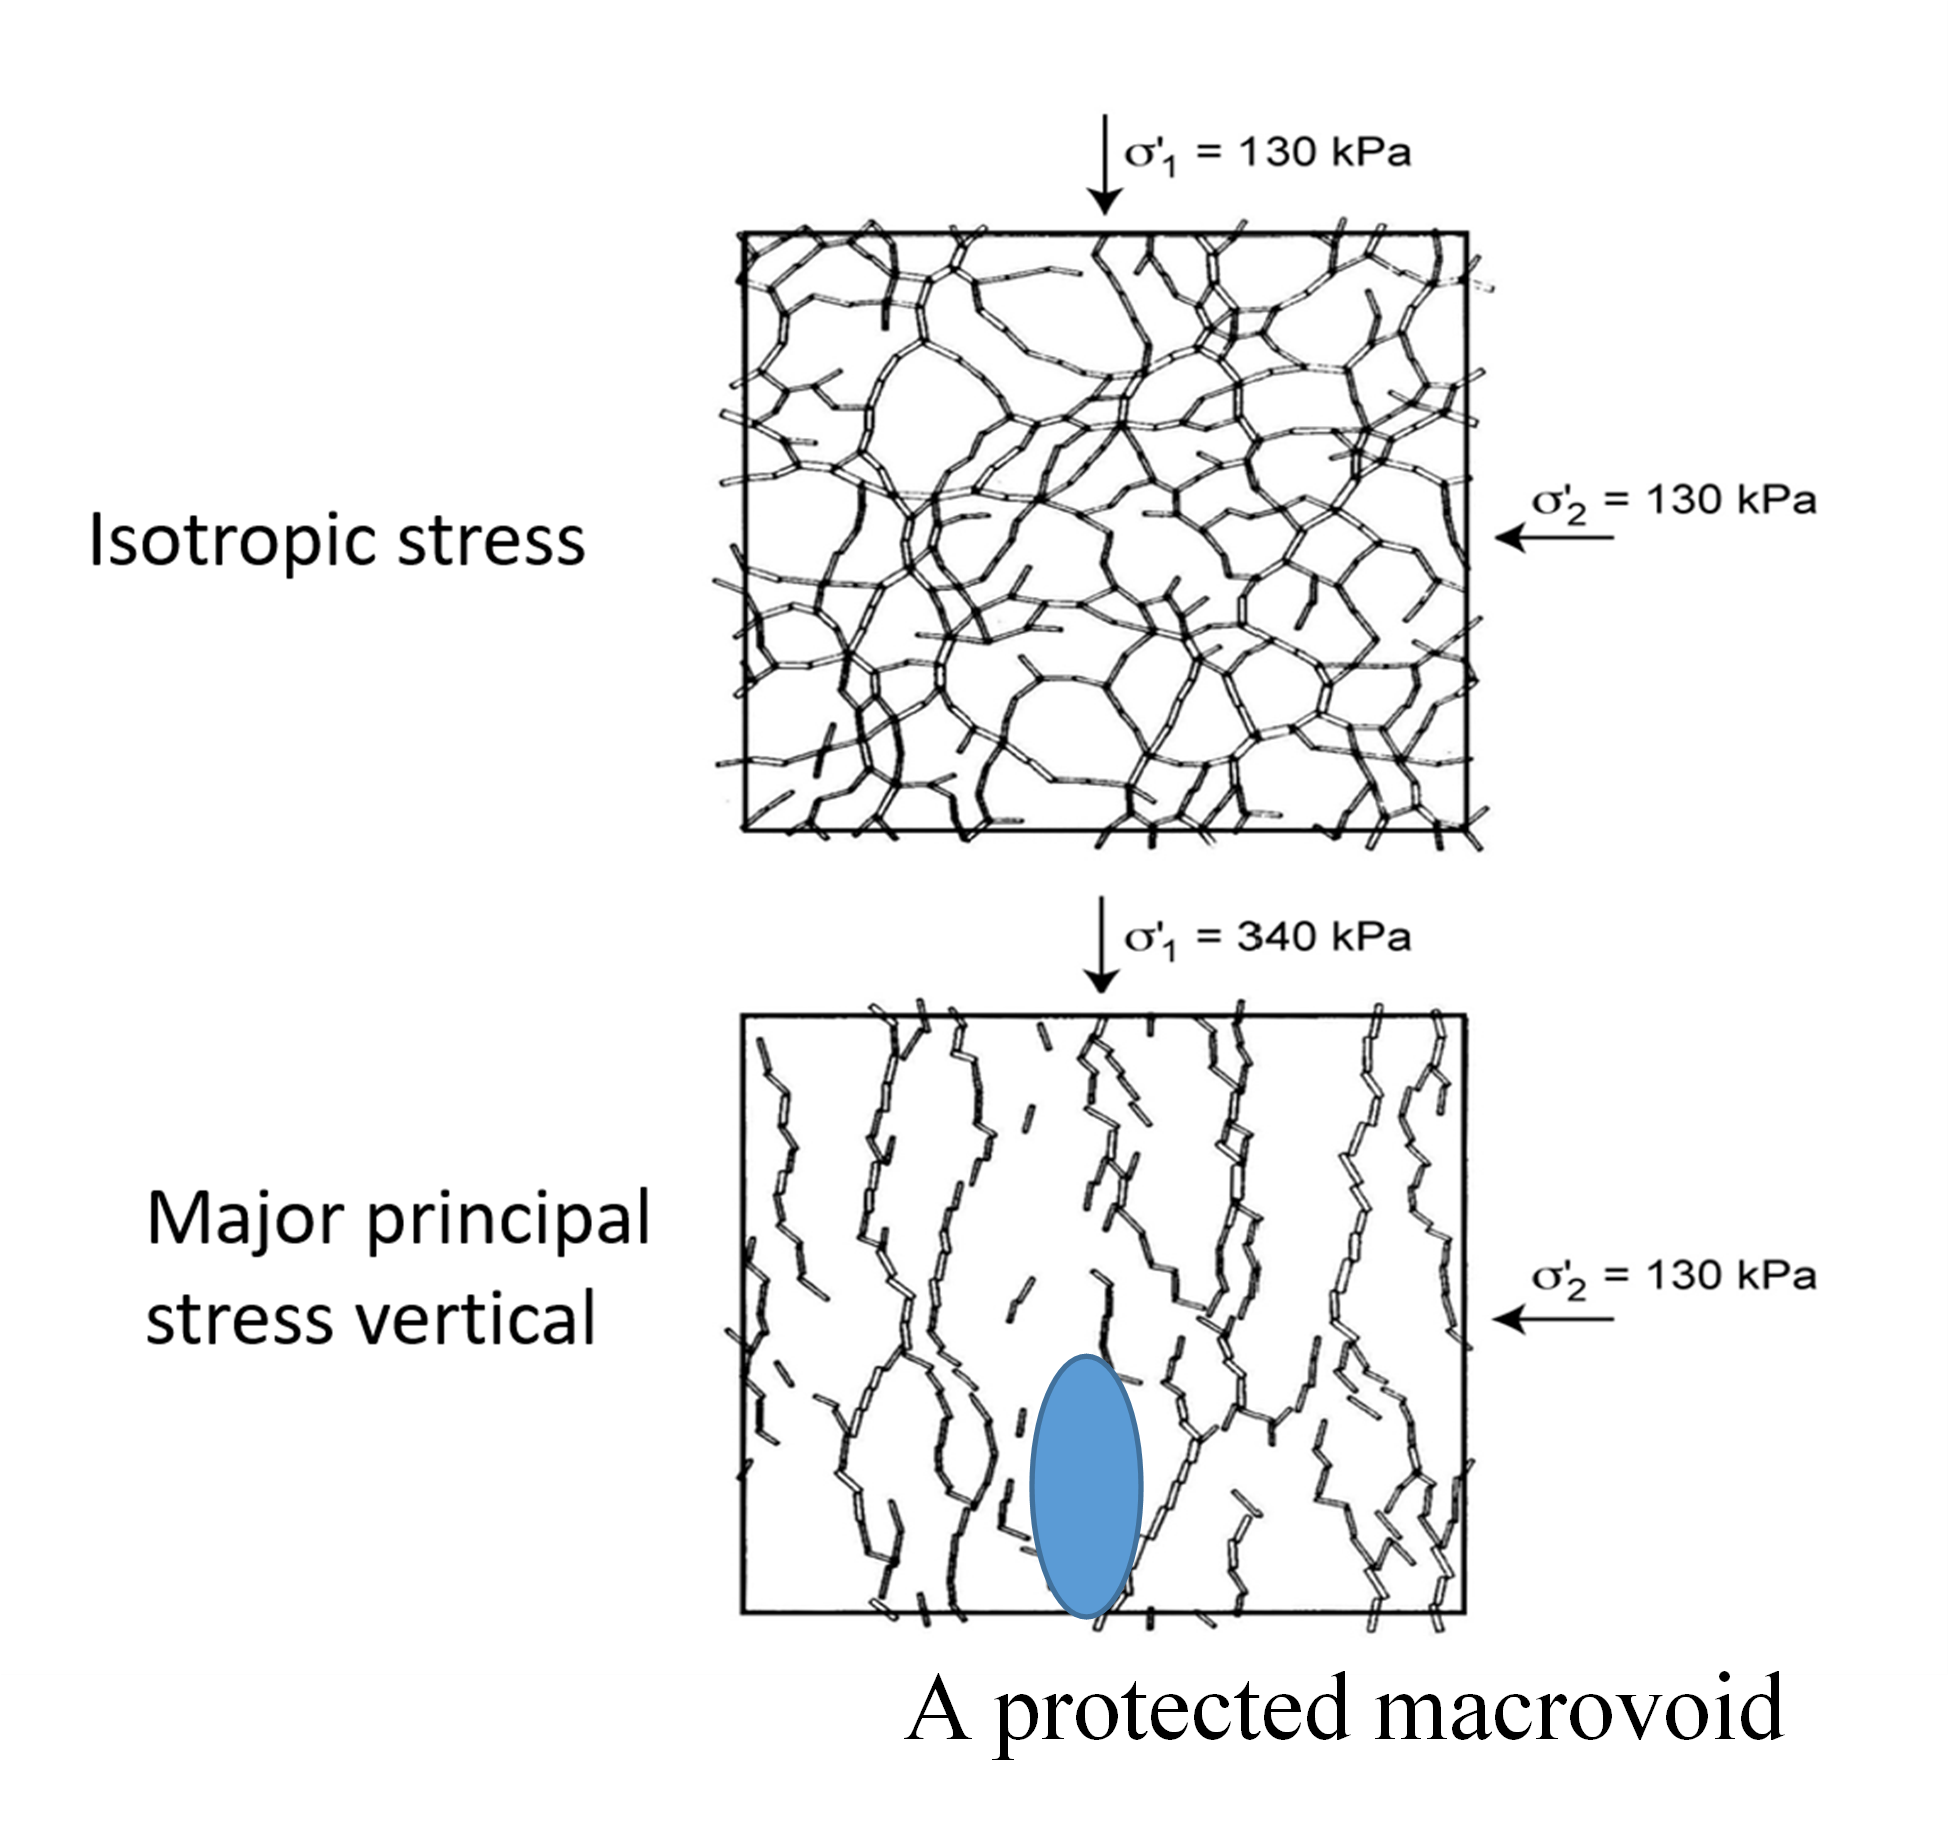
Force chains are networks of contacting particles that are relatively highly stressed (carrying forces higher than the average contact force) and aligned in the direction of the major principal stress (Figure 3). DEM findings confirm earlier investigations using photoelastic discs (e.g. Oda & Konishi, 1974; Drescher & de Jong, 1972).
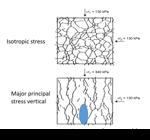
Force chains in the direction of the major principal stress. 2D DEM. Modified from Dobry & Ng (1989).
As a material is loaded, these force chains collapse or buckle and new force chains are formed. A compact particle system, due to its highly redundant nature, quickly adapts to new loading directions by selecting new spatial distributions of favourably orientated contacts for transition of the forces in the strong sub-network. This is presumably not the case in a loose particle system where buckling is more likely to lead to premature failure. Key insights and speculations that are relevant to the theme of the paper are highlighted in bold for ease of reference.
DEM analyses show that the transition from sliding to rolling behaviour at the contact points and resistance to buckling increase as the friction assumed at the contacts increases.
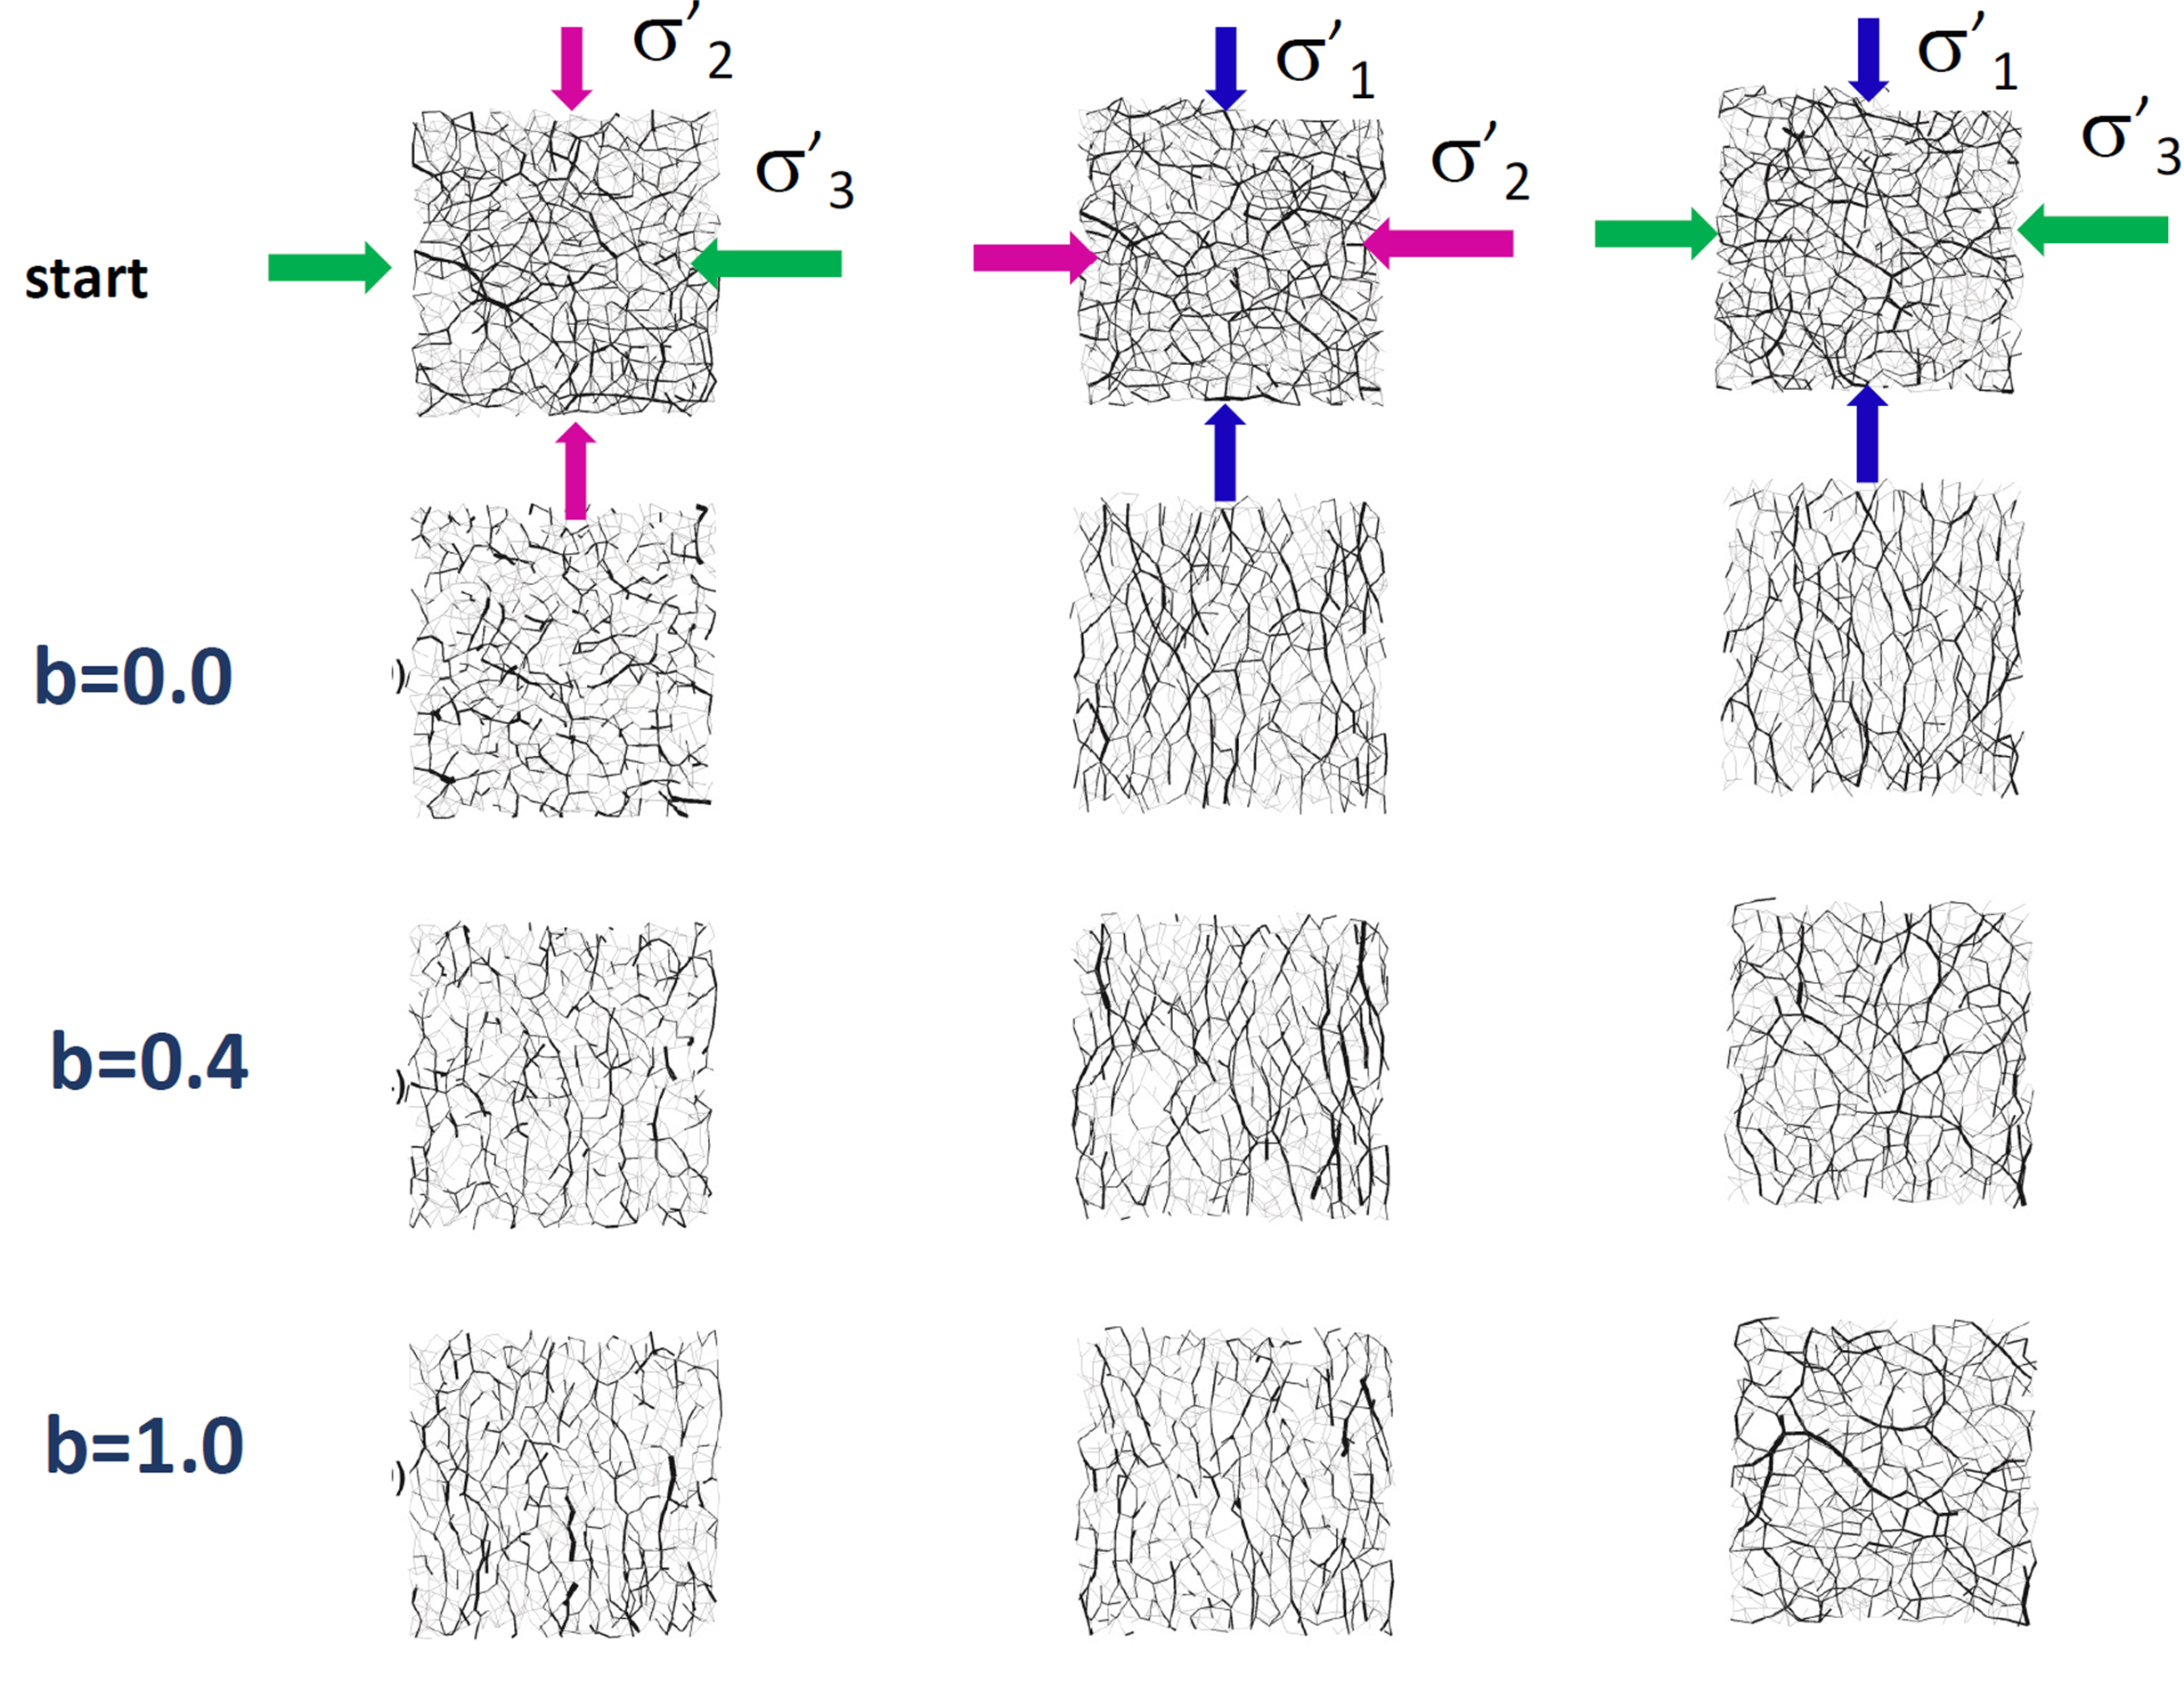
2.2 DEM - force chains and the effect of b (O’Sullivan et al., 2013)
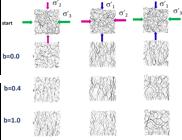
The value of b influences the force chains that develop because of the impact of the intermediate principal stress on the lateral support and resistance to buckling it provides to the force chains that are aligned along the minor and intermediate stress directions. This is illustrated in Figure 4 from Barreto (2009) which shows the force chains that develop with different values of b. The main force chains, that transmit the majority of the load and are aligned along the major principal direction, are supported by secondary force chain structures that stabilise the system.
2.3 DEM - the quasi-steady state and phase transformation
In the 1970s, learned professors were instructing bewildered research students to repeat undrained triaxial compression tests on loose materials that showed what we now refer to as Phase Transformation (Ishihara et al., 1975) or Quasi Steady State – these results did not fit into the understanding of soil behaviour at that time.
The 2D DEM study byYang & Dai (2011)showed that the quasi-steady state reflected real behaviour rather than a test-induced phenomenon. It is a transitional state, in which spatial rearrangement of discrete particles, sheared under the constant-volume condition, leads to the average number of contacts per particle decreasing to a minimum value of around 4 before increasing gradually and after that to an approximately constant value at large deformations associated with the steady state. At the steady state deformation continues at constant volume, constant mean effective stress, constant shear stress and constant velocity.
3. Microcomputed tomography, XCT
X-ray microcomputed tomography imaging allows the evolution of the three-dimensional microstructure/fabric of a small sample of sand to be followed while it deforms, by measuring the attenuation of X-rays that pass through the sample. Individual grains can be distinguished in time-lapse 3D images and the full 3D kinematics of all the grains (i.e. sliding, rolling etc.) can be measured. Current limitations relate to specimen size and complexity of the loading system. I shall refer to the insights that it has provided on strain localisation and particle movements during 1D compression and during shear.
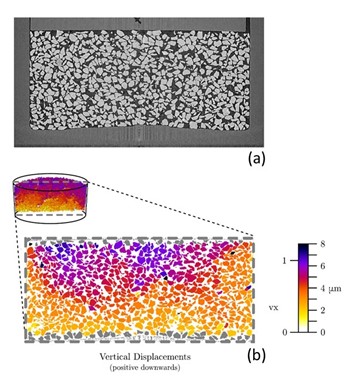
Figure 5a shows a typical image obtained using XCT to observe deformations of a dry non-cemented uniform angular sand (Hostun HN31 sand D50 = 0.328 mm) under 1D oedometric compression loading at 2500 kPa; 3D translations and rotations of grains were tracked. Figure 5b is a vertical slice through the sample in which grains are coloured according to the vertical component of their displacement during on-going creep. Note the variation in pore size and shape, the range of particle shapes, the variation in displacements on any horizontal surface and the boundary effects.
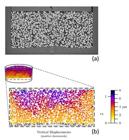
(a) vertical slice before creep phase; (b) vertical displacements of grains over the creep phase. Modified from Ando et al. (2019).
3.1 Microcomputed Tomography: particle movements during shear of natural fine sand (Garcia et al., 2024)
XCT provides extremely valuable insights into particle displacements during shear, including, importantly, natural sands. The following description is taken verbatim from Garcia et al. (2024) who performed triaxial compression of a sample from a shoal of fine sand. In this description, as usual, coordination number is defined as the average number of contacts per particle.
“Up to the mobilisation of the peak strength, the grains undergo a relatively small amount of rotation. The volumetric compression during this pre-peak phase manifests itself by increases in the grain coordination number throughout the entire shoal sample. The initial volume-change behaviour turns to dilation as the grains begin to rotate in the zone of the eventual shear band and the sand approaches the peak strength . Following the peak stress, the shear band develops through a mechanism of highly localised grain rotations. Volumetric expansion continues during the strain-softening phase and shear band development, and the number of contact points between adjacent grains and areas of each contact within the shear band decreases. At the same time, the grains orient toward a unique critical state shearing fabric characterised by the long grain axes aligning parallel to the direction of shearing and pointing on the order of 15° to 20° above the shear plane ”.
3.2 Microcomputed tomography and particle rotation
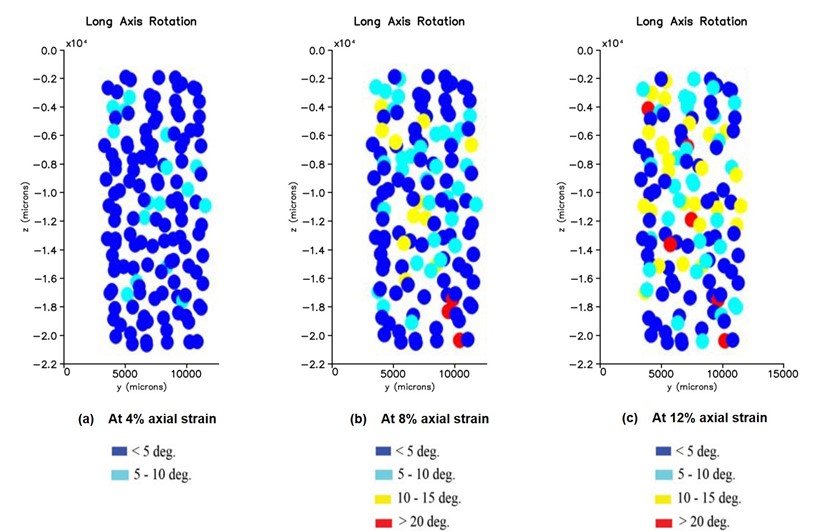
The development of particle rotation as shearing proceeds has been very neatly captured in XCT experiments on an angular sand undergoing triaxial compression (Alshibli et al., 2015). Figure 6 shows that some particles rotated more than 20 degrees from the loading direction, with a higher rotation about the short diameter of the particle than its long diameter.
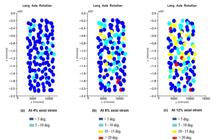
Cumulative values of orientation of particle long diameter measured from the direction of the global major principal stress. Modified from Alshibli et al. (2015).
Of particular interest to the theme being developed in this paper is the observation that there was “[…] a high variation in local dilatancy distribution where some particle groups exhibited high dilatancy angles while others showed negligible dilation or contractive behavior ”. In more detail, some particle groups “[…] show a drastic change from one strain increment to another which is caused by neighbor particle interactions that very often force a collapse of a large void between particles which results in a generation of a high volume change in another particle group ”. “[…] very angular sand particles exhibit a heterogeneous spatial distribution of particle translation, rotation and dilatancy angle ”.
3.3 Microcomputed tomography and validation of DEM
Pan et al. (2023) present the results of triaxial compression tests on green lentils prepared with different inclination angles at deposition, and so with different initial anisotropic states, as the anisometric particles settle with their short axis parallel to gravity. The tests were run with X-ray tomography imaging.
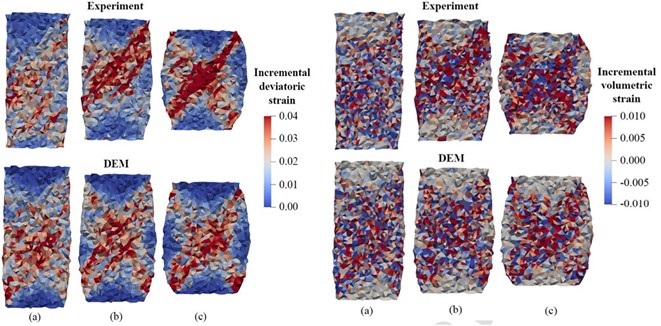
DEM simulations of the triaxial tests were run with particles in a thin layer near the top and bottom walls restricted from horizontal displacement to simulate the constraint caused by the frictional caps and adjacent membrane in the triaxial experiments. By simulating the particle shape, initial state, (including similar distributions of local void ratio.and boundary conditions of the physical experiments, and with careful selection of contact parameters, good agreement was found between DEM predictions and experimental observations, in terms of macro scale stress-strain response, meso-scale strain localization and micro-scale fabric anisotropy evolution. Examples of the similarity of incremental deviatoric and volumetric strains are shown in Figure 7.
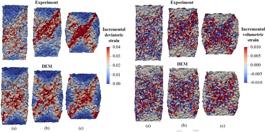
Experiment and simulation: local incremental deviatoric strain and local incremental volumetric strain in δ = 60° specimen between axial strains of (a) 4 to 5%; (b)14 to 15%; (c) 29 to 30%. Modified from Pan et al. (2023).
4. Localisation of strains
The results in Figure 7 provide perfect examples of strain localisation in cohesionless soils undergoing triaxial compression in tests with end restraint, and illustrate the value of both microcomputed tomography and DEM in investigating the phenomenon.
4.1 Localisation in laboratory tests.
Desrues et al. (1996, 2018) make the following important and profound statements on the subject of localisation, based on their work with microcomputed tomography imaging of triaxial compression tests on dry sands:
“[…] strain localisation is unavoidable and is ineluctable and omnipresent when sand is sheared".
“[…] all other tests analysed so far, show the same pre-peak structuration of the deformation process, and this in a variety of different experimental conditions, initially dense and loose specimens, slenderness ratios of 1 or 2, with or without end lubrication”.
“[…] localization structures inside the specimens were clearly revealed by the density maps in the dense case. Conversely, in the loose specimens it was difficult to observe localization structures, because the density in the localized strain zones did not change significantly”.
“[…] Even when taking all possible precautions to perform the “cleanest” (i.e., most mechanically perfect) triaxial tests, which appear to have no external sign of strain localisation, the ability to look inside deforming specimens revealed complex structures of localised changes of porosity whose integrated kinematics appear externally as a uniform deformation […]”.
Strain localization in triaxial tests can occur in different localization patterns depending on test conditions, such as end restraint, platen rotation, eccentricity in vertical alignment, loading directions and mixed boundaries. The use of lubricated ends and 1:1 sample height appears to delay the onset of localisation in triaxial compression tests.
Figure 8, taken from Pan et al. (2023), compares the incremental deviatoric strain distribution in DEM specimens between 29% to 30% axial strain, one with flexible lateral boundaries and one with rigid wall boundaries. Pan et al. (2023) explain that “[…] explicit conjugate shear bands are observed with the flexible boundaries, whereas for the rigid wall boundary, the strain field is diffuse even at large axial strain”. The initial stiffness is increased and the peak strength is reduced with rigid wall boundaries and this is mostly attributed to the difference in the constraint enforced on particles near the boundaries.
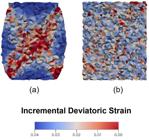
Incremental deviator strain distribution for the δ = 60° specimen between 29% to 30% axial strain with (a) ‘force line’ boundary; (b) rigid wall boundary. Modified from Pan et al. (2023).
The changing constraints on particle movement when moving from triaxial compression to plane strain compression, increasing b from zero, appears to result in shear banding becoming visible externally at an earlier stage in the shearing.
Localisation in hollow cylinder tests is dealt with later after introduction of relevant terms.
4.2 Localisation triggers
Santamarina & Cho (2003), who also regard localisation of strains to be omnipresent in particulate materials, consider localisation to be promoted by: “[…] drained dilation, contractive tendency in undrained loading, imposed strain non-uniformities, boundary conditions,heterogeneity in situ or in laboratory prepared specimens”; and to be triggered “[…] by cavitation in undrained dilative shear, platy particle orientation, bond failure in cemented soils, menisci failure in unsaturated soils, and possibly particle crushing”. Heterogeneity in situ or in laboratory prepared specimens includes initial and evolving spatial variations in void ratio.
Grain rotations appear to be key for detecting the onset of localisation.
4.3 Implications of strain localisation
-
Strain localisation in triaxial compression tests involves bands of 10 to15 grains width, which dominate the material’s macroscopic response and lead to global failure.
-
Localisation means that tests cannot be analysed as uniform elements. The concept of strain as an average quantity is invalid.
-
According to experimental results by Saada et al. (1999) using a digital image processing technique, when the global shear strain is 8%, the local shear strain in the shear band is 160%. “Therefore, localization in drained tests restricts the determination of large strain volume data but facilitates the determination of the large strain strength” (Santamarina & Cho, 2003).
-
Measured parameters become specimen-size and boundary condition dependent.
4.4 Localisation in dilatant soils
-
In dense soils, dilatancy concentrates in the shear band, causing weakening in drained and in slow undrained tests when pore water is drawn into the shear band. In fast undrained tests pore water migration does not occur and undrained strengths are higher (Sandroni, 1975).
-
In drained tests involving dilation, decreasing stability is accompanied by reducing coordination number (Yang & Dai, 2011).
-
Strain localization prevents the global dilation of a dense specimen.
4.5 Localisation in contractant soils
So, localisation does develop in loose contractant soils but is difficult to observe and is self-healing in drained and slow undrained shearing, when locally higher pore pressures can dissipate out of the shear band. Under rapid undrained loading, the shear band cannot drain, straining is concentrated in the band and strength is reduced.
4.6 Localisation in the field as opposed to the laboratory
Strain localisation in contractant and dilatant plastic clays are readily observed in the field. This is not the case in cohesionless soils and there are few examples of in situ localisation being reported. This begs the question, is localisation in a laboratory test representative of localisation and progressive failure in situ?
5. Steady/critical state
5.1 Steady state/critical state. Is it non-linear in e-log p’?
Steady state was defined herein as the ultimate state achieved under undrained conditions, whilst critical state was defined as the ultimate state achieved under drained conditions. This distinction does not appear to have been retained in the literature and the terms will be used interchangeably herein.
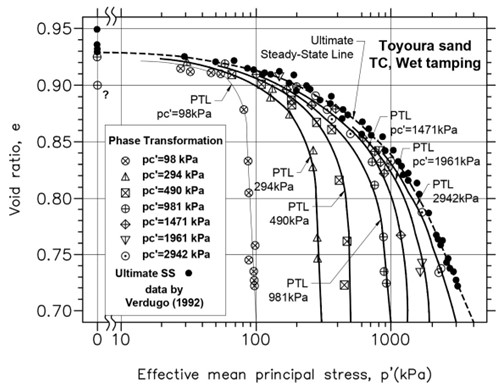
One of the most complete investigations of steady state and phase transformation in undrained triaxial compression of sands (Toyoura sand) was carried out by Verdugo (1992) and reported by Verdugo & Ishihara (1996). Verdugo’s work, refer to Figure 9, showed clearly that in e-log p’ space the steady state was non-linear, with marked curvature of the steady state line (SSL) at low stresses. This level of non-linearity has also been found in investigations of the Stava tailings (Carrera et al., 2011) and has been confirmed in DEM studies, see, for example, Figure 10 from Nguyen et al. (2017).
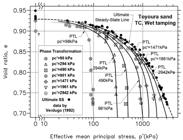
Phase transformation and ultimate steady state in triaxial compression. Modified from Verdugo & Ishihara (1996).
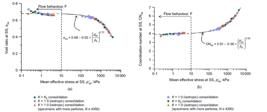
Steady-state data points obtained from isotropic and Ko-consolidation simulations: (a) e-log p’space; (b) CN-log p’ space. Modified from Nguyen et al. (2017).
Verdugo also showed that phase transformation became less likely to occur at high global void ratios and high stresses. Note that Verdugo prepared his samples using ‘wet tamping’, and Carrera et al. by ‘moist tamping’, with comparisons using wet and dry pluviation.
5.2 Steady/critical state. Does it depend on b?
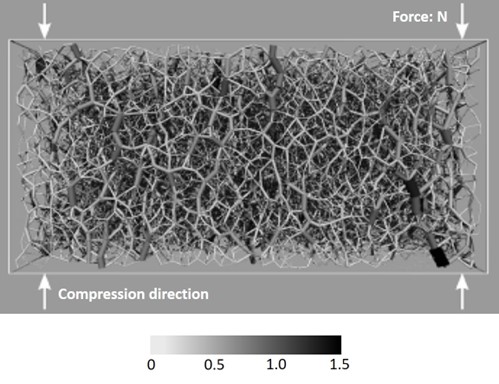
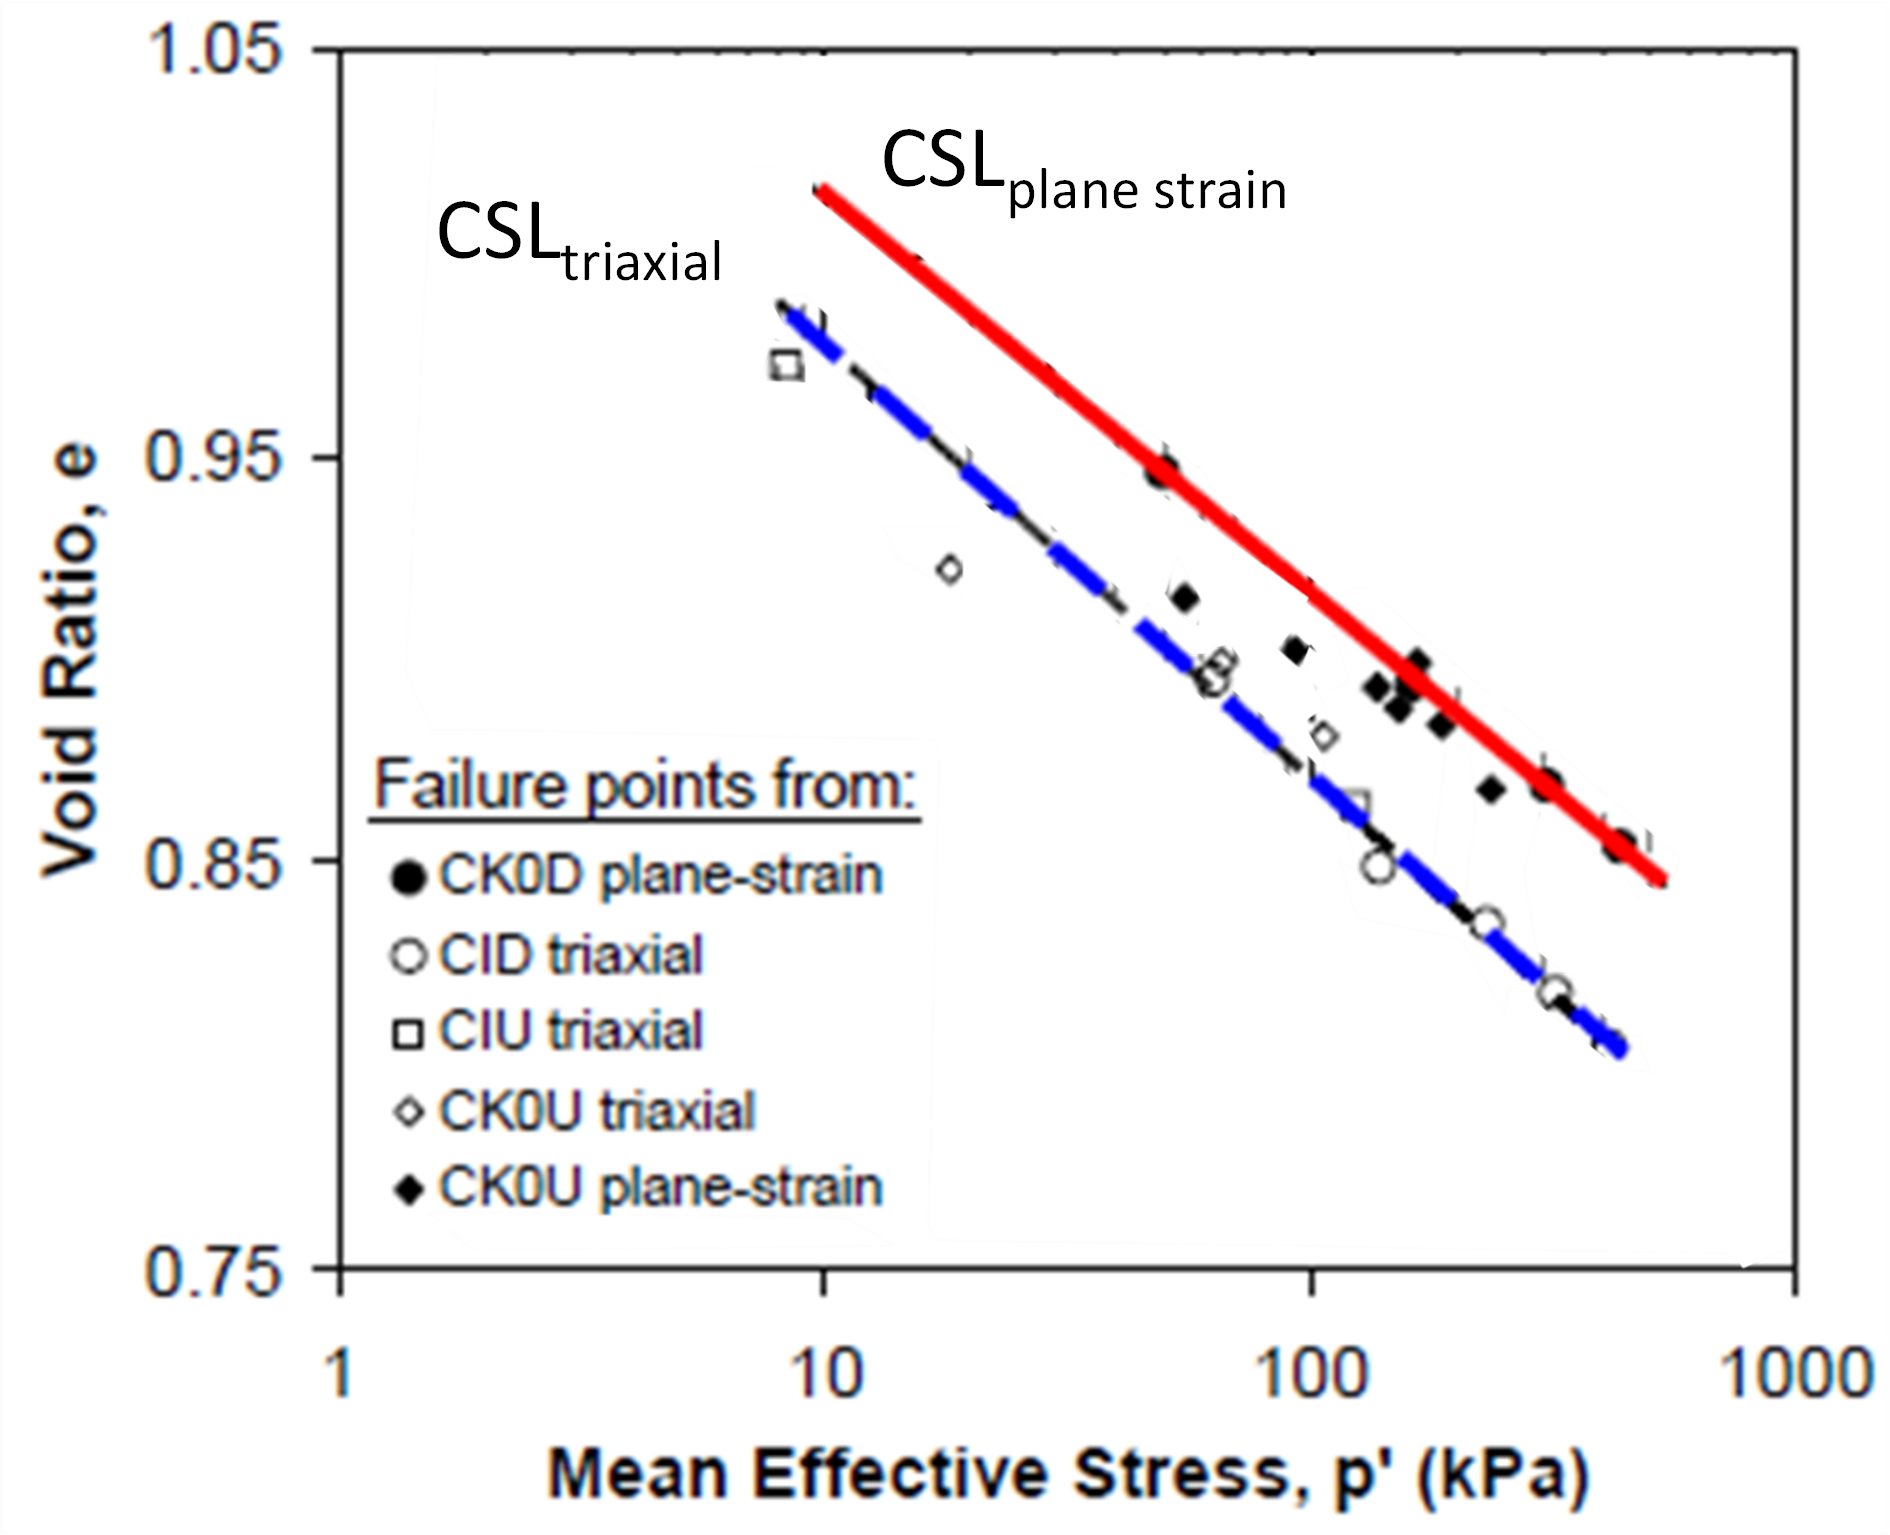
Force chains have been shown to exist at critical state, see, for example, Figure 11 from Zhao & Guo (2013). On the basis of the discussion put forward in Section 2.2, on the dependence of force chains on b, It is reasonable to assume that critical state depends on b, as suggested by Chu & Wanatowski (2008), refer to Figure 12. It is also reasonable to assume that there is simultaneous dilation and contraction at critical state as force chains continuously form – collapse – and re-form.
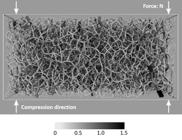
Force chains at critical state in DEM simulation of triaxial compression of a medium dense sand. Modified from Zhao & Guo (2013).
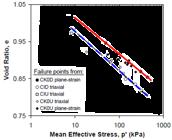
Undrained triaxial and plane strain compression of moist tamped Changi sand (CSL: critical state line). Modified from Chu & Wanatowski (2008).
5.3 Steady/critical state. Is it attainable? - Localisation
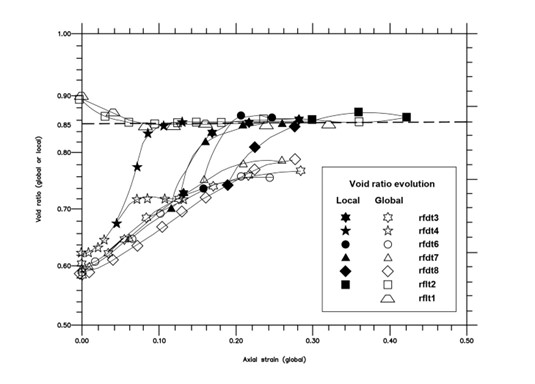
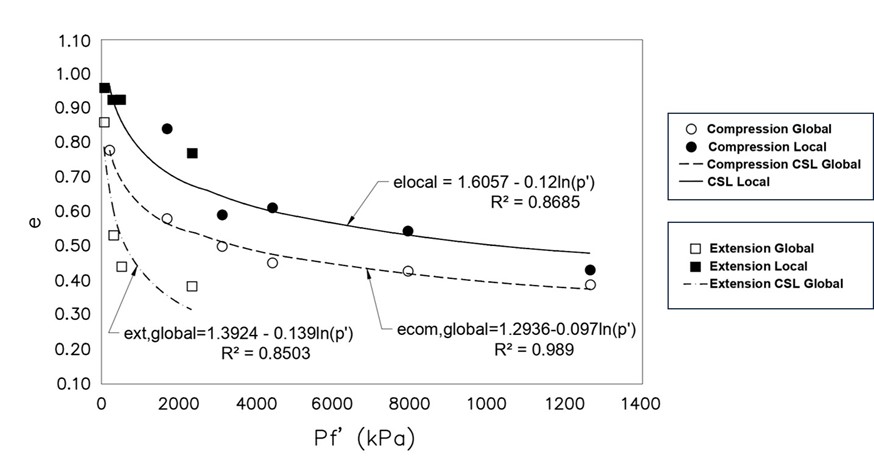
It follows from the discussion on localisation that a critical state cannot be defined using boundary measurements of volume change after the development of shear bands. Using microcomputed tomography, however, Desrues et al. (1996) showed that it was possible do demonstrate that a critical state developed in the shear bands in triaxial compression tests on sands (Figure 13), stating: ‘Critical state is particularly well-verified inside the observed localised band of deformation, rather than the average of a complex strain field.’
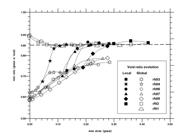
Global and local evolution of the void ratio in loose and dense Hostun RF sand specimens submitted to axisymmetric triaxial test under 60kPa effective confining pressure. Modified from Desrues et al. (1996).
To minimise the effects of localisation, several authors recommend that the most reliable test to determine critical state parameters should be on homogeneous contractive specimens subjected to drained shear. In these, localisations are self-healing.
5.4 Steady/critical state. Is it attainable? - Layering
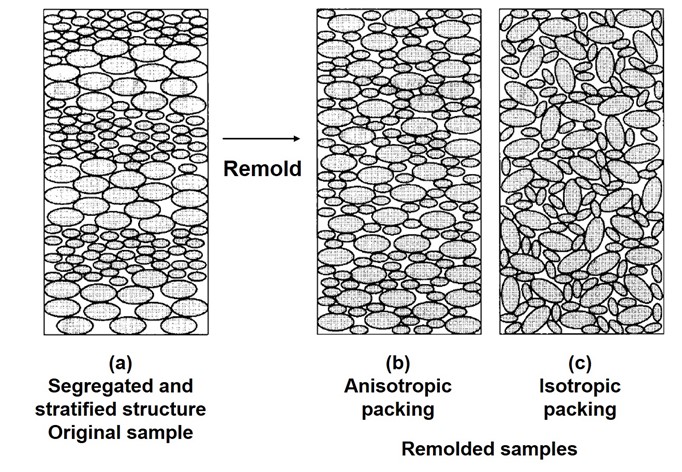
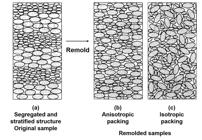
Many sedimented cohesionless soils with a range of particle sizes, including tailings, are layered. Figure 14a, from Yoshimine & Koike (2005), illustrates a layered or stratified fabric, which when reconstituted in the laboratory, will have a totally different fabric, two examples of which are shown in Figures 14b and c.
Using a well-graded but clean sand that was sieved and separated into four components with different particle size ranges, Yoshimine & Koike (2005) created layered specimens by sedimenting each component successively. Figure 15a illustrates the resulting fabric. Uniform homogeneous specimens having the same grading were also prepared (Figure 15b). Undrained triaxial compression tests were run on both types of specimens and the steady state and phase transformation lines were established for each (Figure 15c). Despite being of the same overall particle size distribution, these lines occupied very different positions in e-log p’ space for the two fabrics.

Illustration of sand fabrics (a) layered/stratified; (b) homogeneous and uniform; (c) phase transformation and steady state in undrained triaxial compression tests on uniform and stratified sand. Modified from Yoshimine & Koike (2005).
Obliteration of initial fabric at large strains/displacements in triaxial or plane strain tests is not always feasible, particularly in layered soils, hence the introduction of a class of soils referred to as ‘transitional soils’.
5.5 Steady/critical state. Is it attainable? – Bedding surfaces
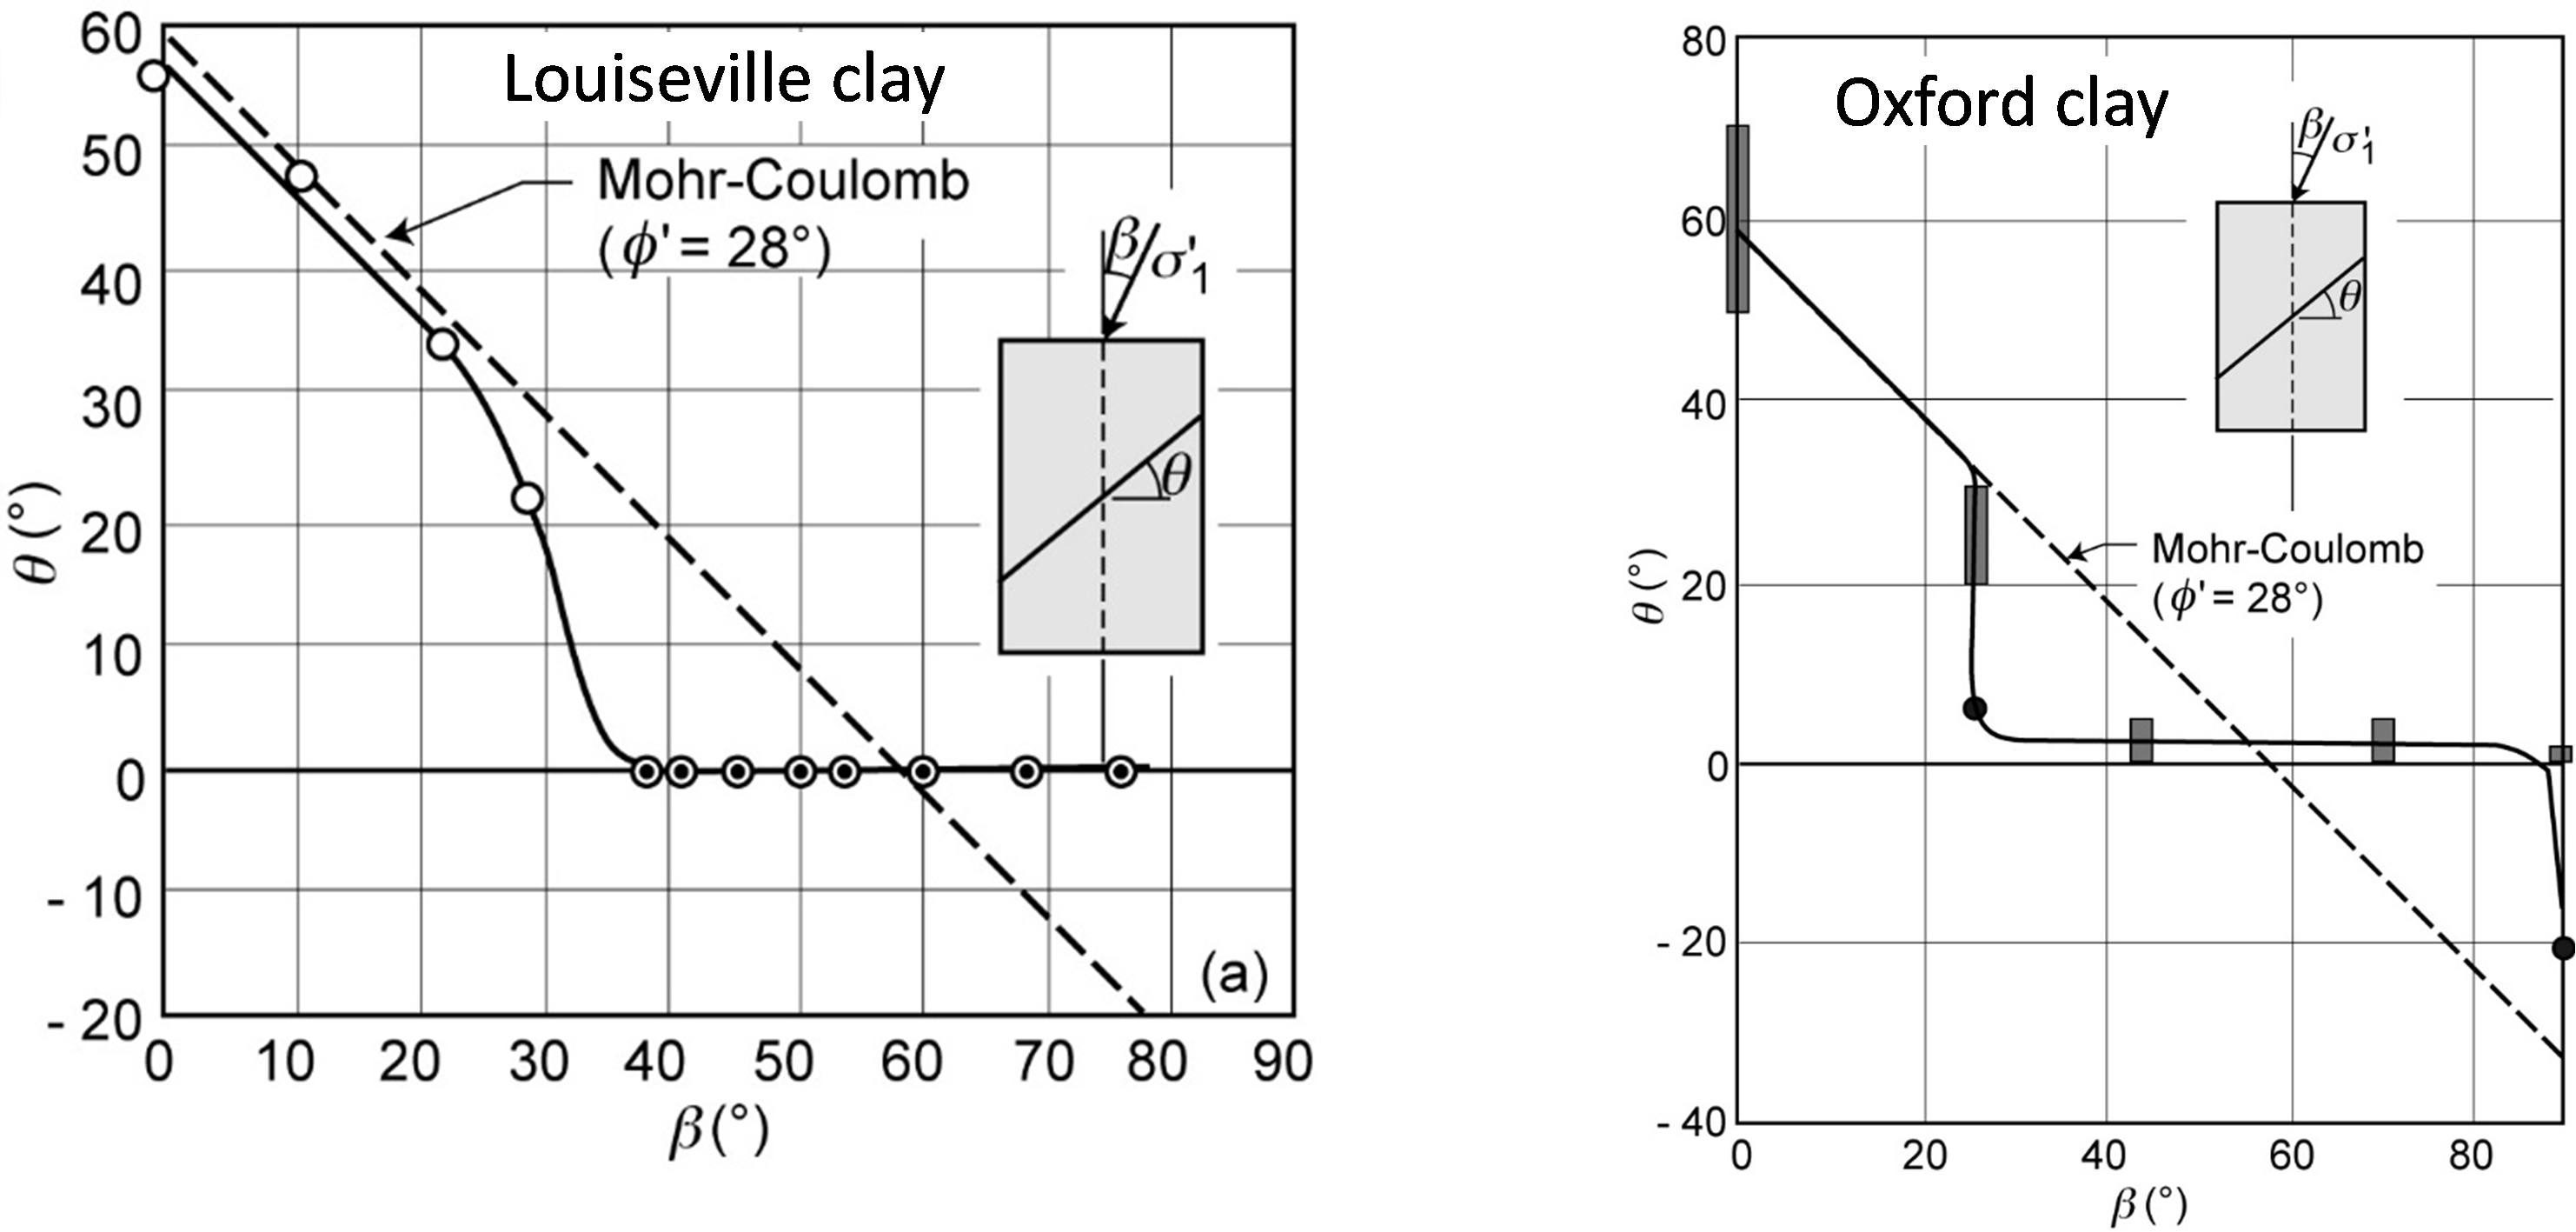
Pre-existing bedding surfaces in clays and cohesionless soils with platey particles, dominate behaviour, including behaviour under varying principal stress directions. Two examples are shown in Figure 16. Once sliding on the bedding surface takes over during shear, mixing and removal of initial fabric cannot take place.
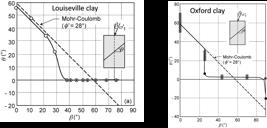
Inclination of failure plane with the horizontal, q, versus the angle of major principal stress axis rotation, β. Modified from Leroueil et al. (2024).
5.6 Steady/critical state. Does it depend on alpha?
At critical state, an anisotropic fabric can develop. Elongated/platy particles align relative to loading direction (Figure 17), as do load columns (Figure 11), even in shear zones. If the loading direction is changed at critical state, i.e. if there is principal stress rotation and change in alpha, particles must re-orientate and the soil must undergo volumetric deformation to reach a new critical state. Is this feasible? Pre-existing particle alignment can dominate subsequent behaviour, consider the effect of bedding, referred to above.
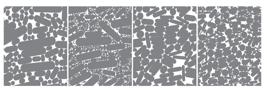
Orientation at 400% shear strain of particles of different shapes and size ranges. Simulations performed using the discrete-element approach known as contact dynamics. From Carrasco et al. (2023).
5.7 Steady/critical state. Does it differ between triaxial compression and extension?
Laboratory testing specialists have concluded that steady state is different between triaxial compression and triaxial extension. Referring to Figure 18, Vaid et al. (1990):
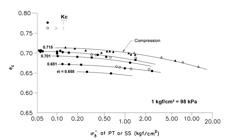
Steady state and phase transformation lines for Ottawa sand in triaxial compression and extension. Modified from Vaid et al. (1990).
“[…] while a single steady state line is found for compression loading, extension loading yields several lines, each characteristic to a given deposition void ratio. All the extension lines lie to the left of the compression line in void ratio - effective stress space. Thus at a given void ratio, steady state strength is smaller in extension than in compression, the difference increasing as the sand becomes looser”.
The dependence of critical state on b would suggest there could be a difference, and the fact that fabrics will be different in terms of particle orientation strengthens the argument. However, localisation in triaxial tests is rife, as confirmed by XCT, and XCT is suggesting, surprisingly, that within the shear bands the same critical state is reached in triaxial compression and extension tests; refer to Figure 19 from Salvatore et al. (2017). Whether critical state is different between triaxial compression and triaxial extension remains an open question.

Global and local volumetric states at the end of triaxial compression and extension tests. Modified from Salvatore et al. (2017).
5.8 Steady/critical state. Is it rate dependent?
Displacement controlled shearing is usually adopted in laboratory testing on the basis of its simplicity and that it provides data on the post-peak behaviour, strain softening, of the soil. However, that is post peak behaviour under displacement control, which is not necessarily the same as post-peak behaviour under dead or maintained loading, the form of loading which usually applies in field instability problems. Vaid et al. (1999) consider that: ‘Only an inertial system can capture the true strain softening response of sand,’ and that ‘steady state deformation in an inertial loading system occurs at constant acceleration not constant velocity.’
A critical difference between the two forms of loading is the ultimate/steady state strength available. Two sources of rate dependency at high rates of shear, particularly those associated with load control/maintained load, can be considered:
-
Time for pore water migration into or out of shear bands when there is localisation. In contractant soil, no time for pore water migration out of the shear band leads to reduced undrained strength, as concluded earlier.
-
Collision of particles at high displacement rates leads to increased spacing of particles and a reduction in their number of contacts (see Iverson & Denlinger, 2001).
Figure 20 presents a comparison of undrained plane strain tests on very loose Changi sand under deformation and load-controlled shear: (a) stress-strain; (b) effective stress paths; (c) deviator versus time. The ultimate strength after collapse under maintained load, although not well defined, is more than halved compared to the strength measured under deformation control.
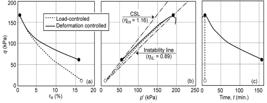
Comparison of undrained plane strain tests on very loose Changi sand under deformation and load-controlled shear: (a) stress-strain; (b) effective stress paths; (c) deviator versus time. Modified from Chu & Wanatowski (2009).
Speculating on the basis of the findings by Yang and Dai described above, it seems reasonable to expect that behaviour at phase transformation could be affected by this difference in the form of loading and so in the rate of displacement; above a certain global or local void ratio, the phase transformation seen under displacement control may not apply under load control.
6. Instability
6.1 Tolerance to undrained disturbance under simple shear
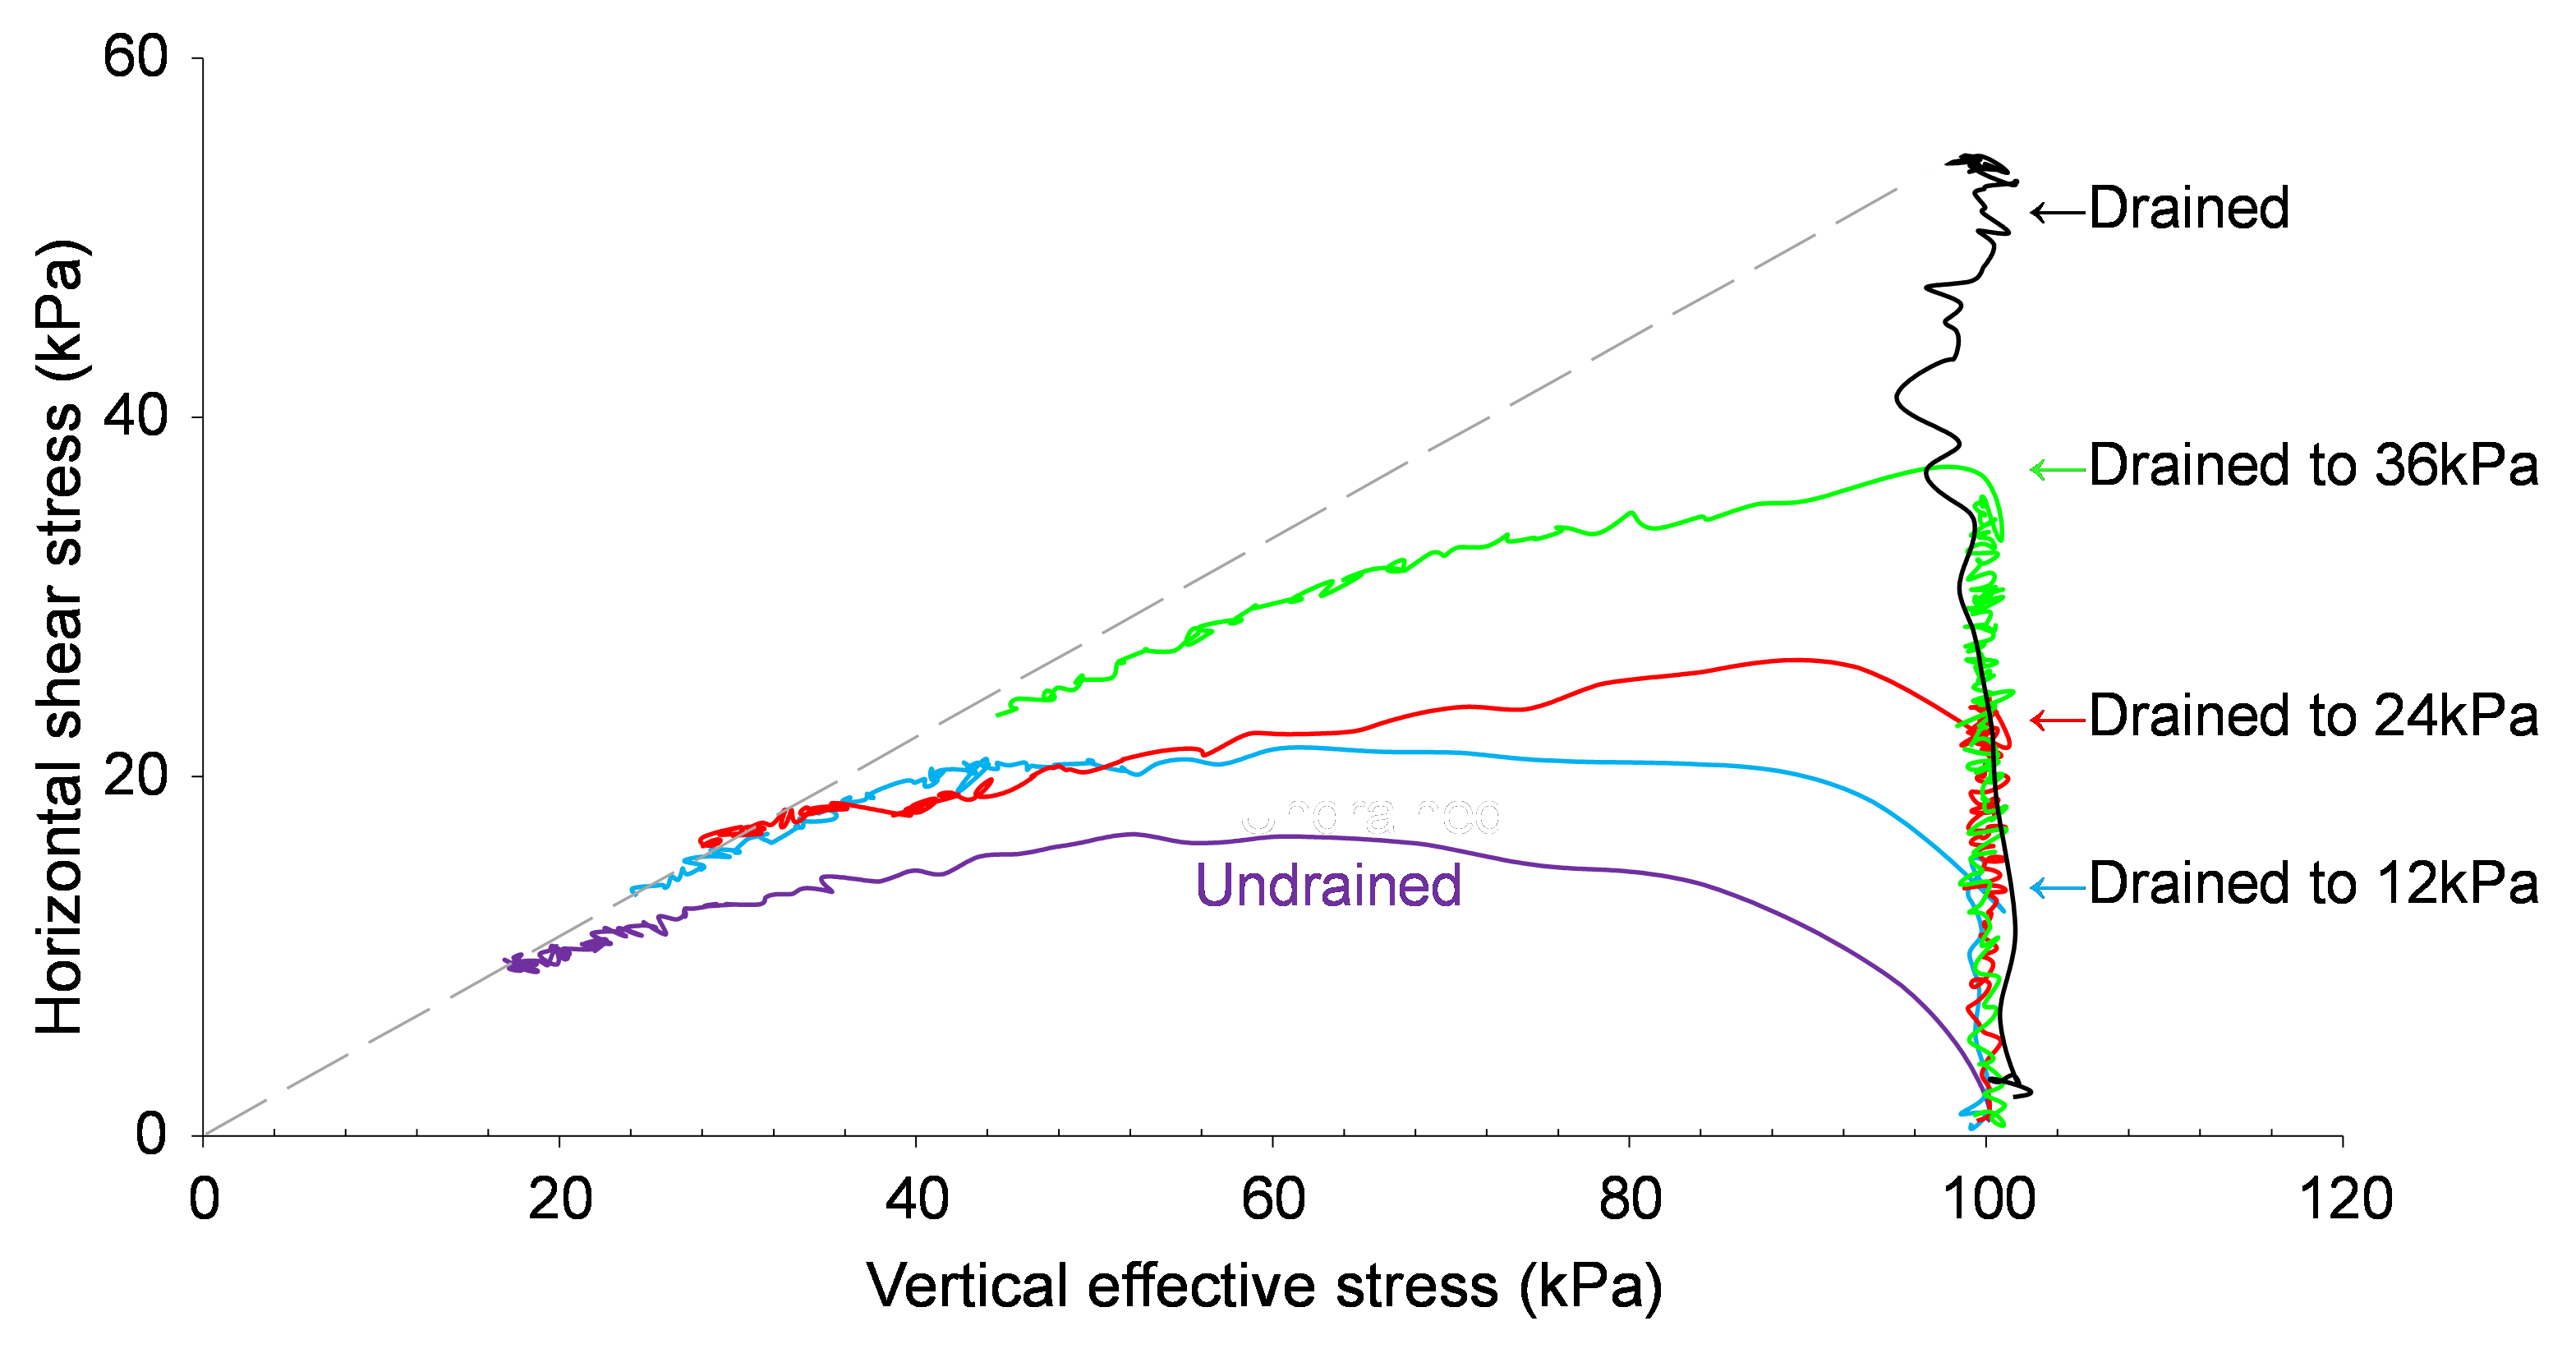
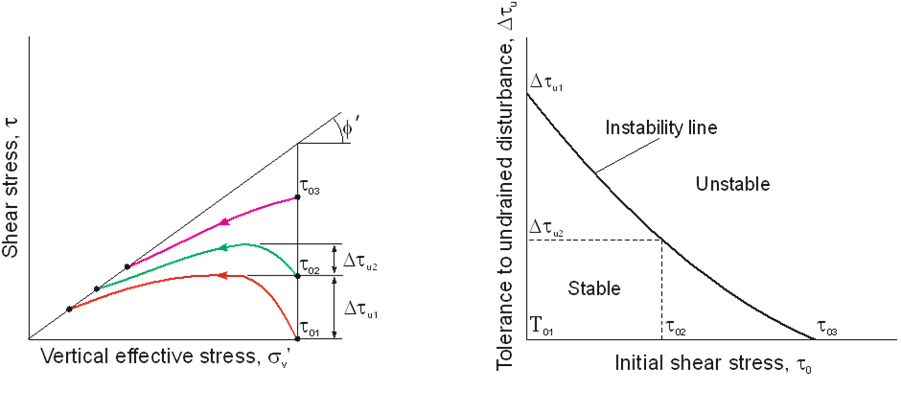
Flow sliding in micaceous sands during construction of river training works on the Jamuna River, Bangladesh, was one of the focuses of my Rankine Lecture. Investigating these flow slides, and identifying a slope angle that would prevent further slides, led us to the concept of ‘tolerance to undrained perturbation/disturbance’, which involved defining a line in stress space relevant to DSS testing, above which there was no tolerance to undrained disturbance (refer to Figures 21 and 22). Direct simple shear, DSS, testing was selected on the basis of its simplicity, particularly for running constant volume tests, and for its greater relevance to conditions in a slope, rather than triaxial compression. In our naivety, we referred to this line as a collapse line, having previously suggested the existence of a collapse surface when examining the effects of principal stress rotation (PSR) on an anisotropic sand (see later). Inadvertently we had entered the world of instability, a topic which, I later realised, was being fiercely debated in the nineties and subsequently.
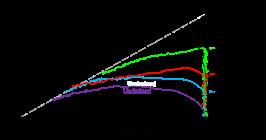
Drained-undrained simple shear tests on micaceous sand, horizontal shear stress versus vertical effective stress.
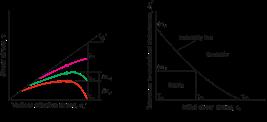
6.2 Instability/collapse in triaxial compression
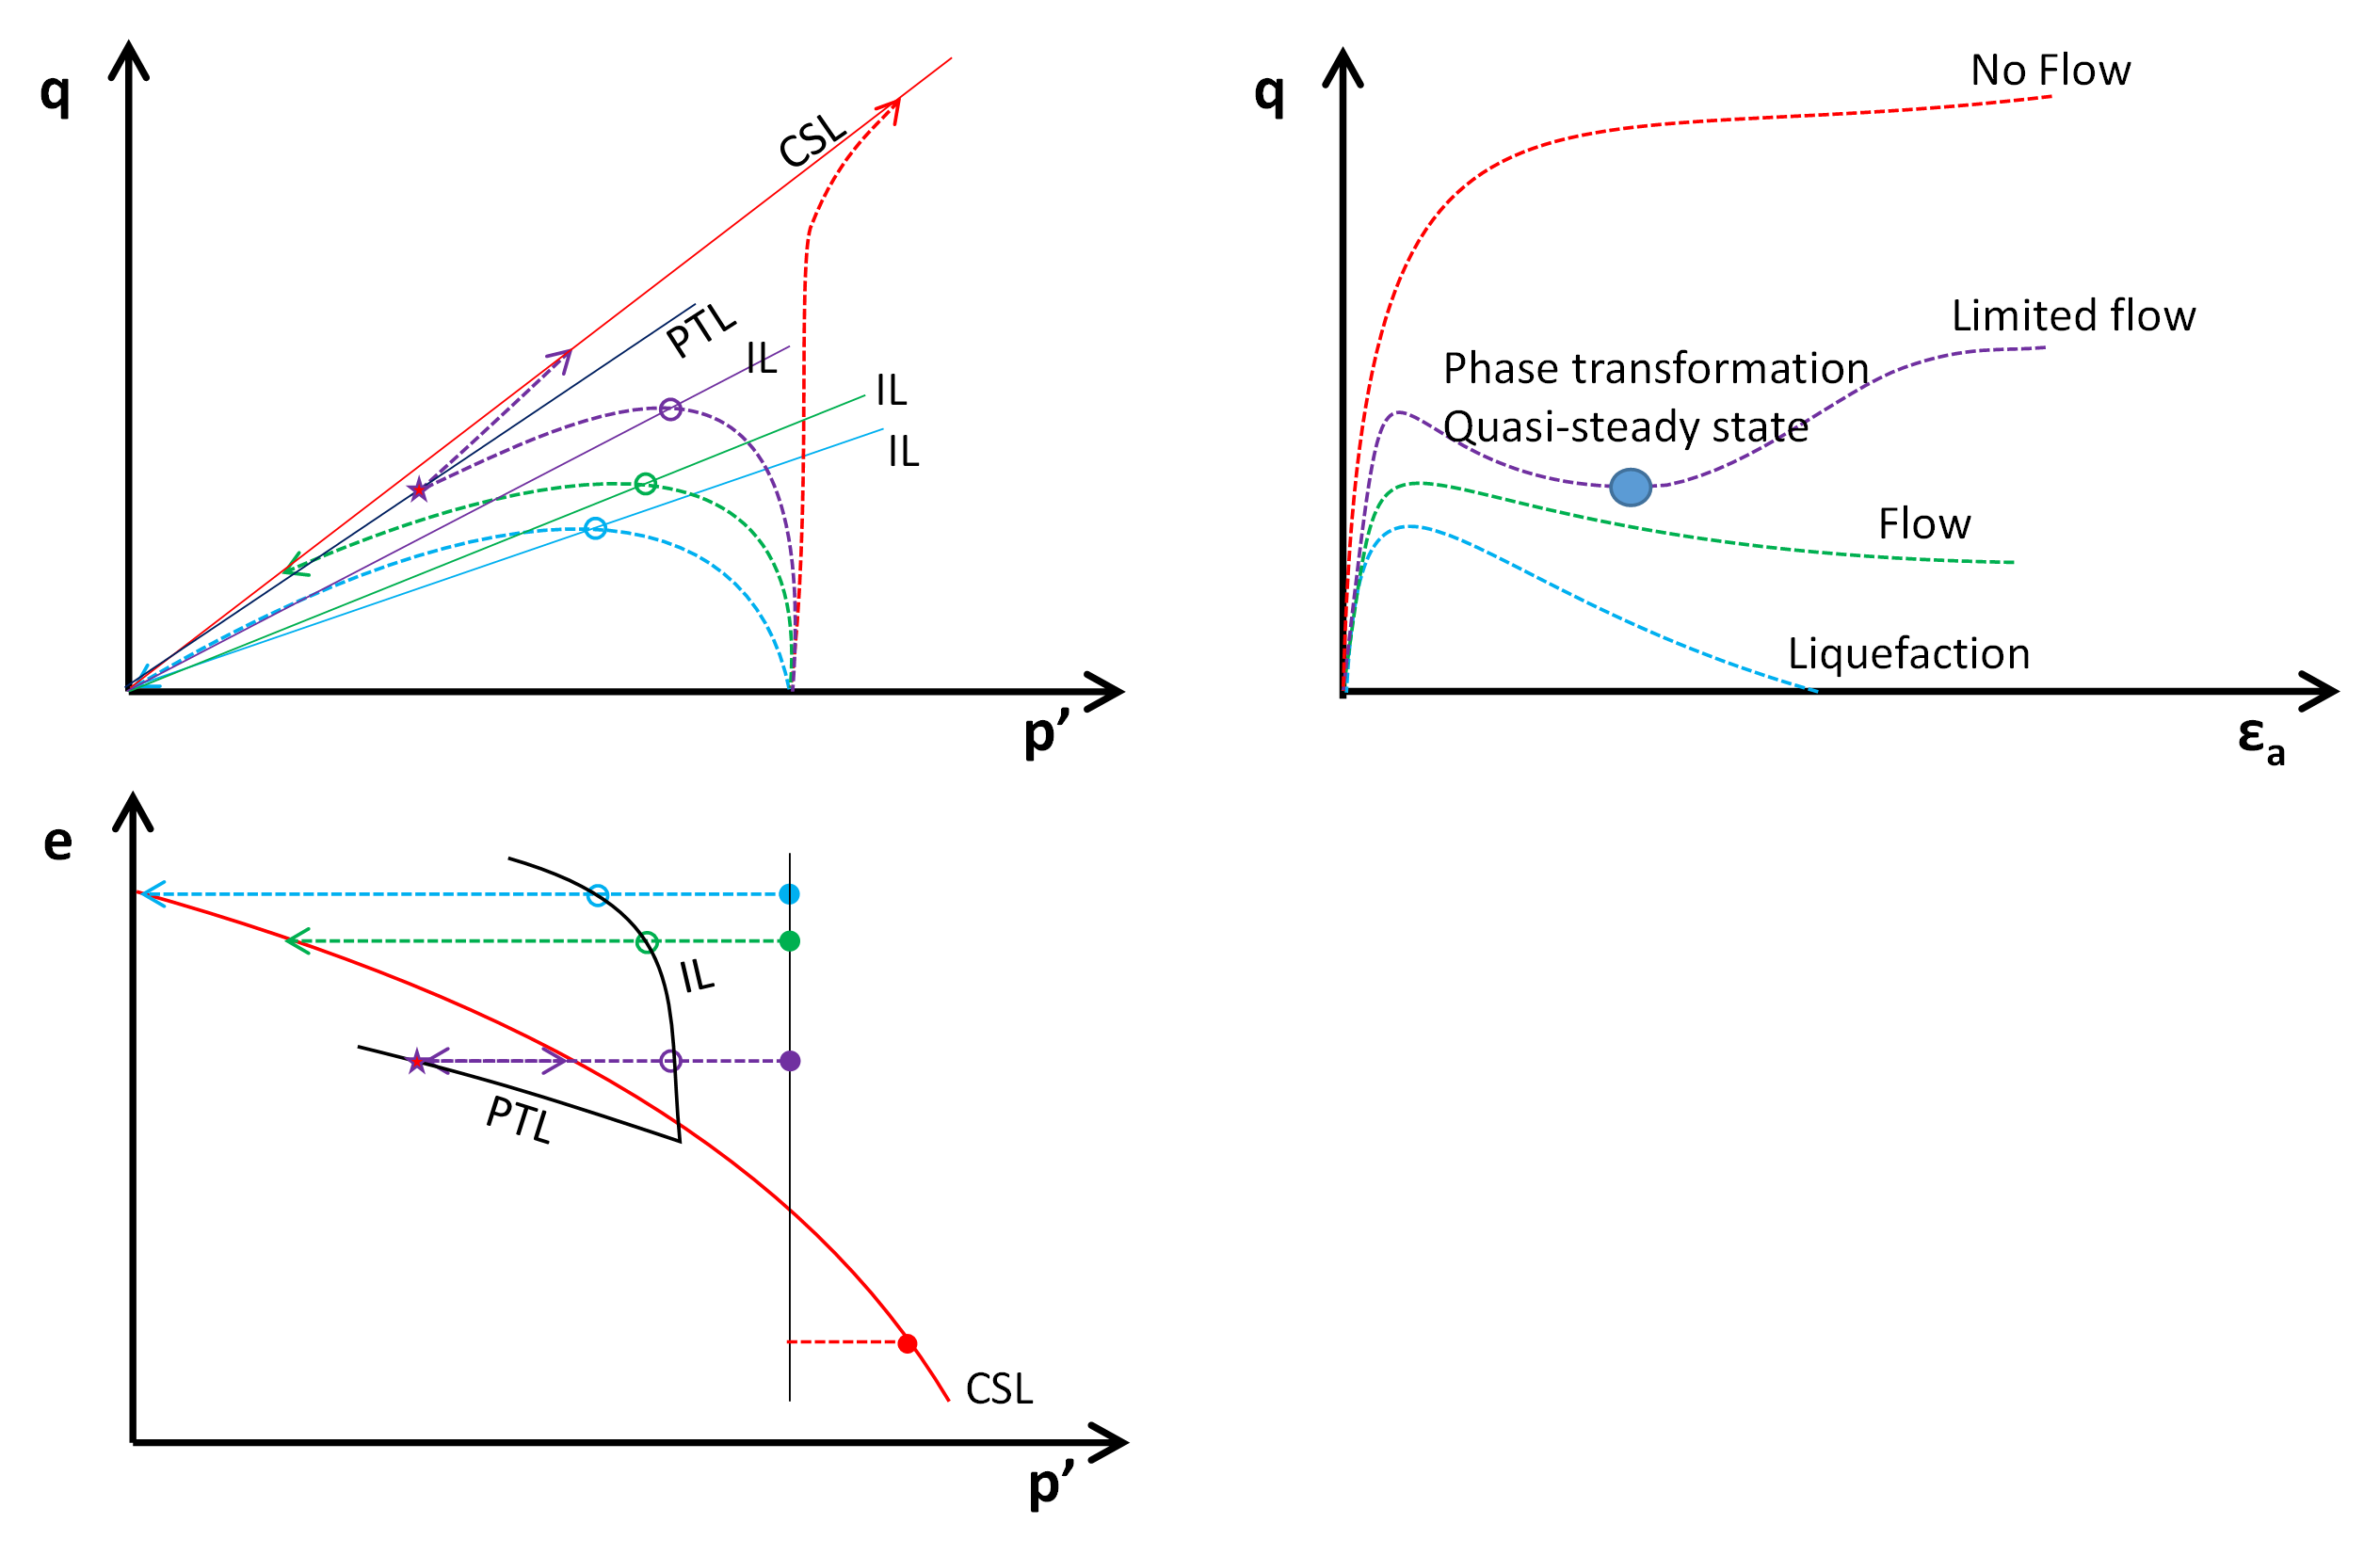
The phenomenon of instability, sometimes now referred to as diffuse instability, is the initiation of a sudden increase in strain, before the full frictional strength of the soil has been mobilised. In undrained shear, behaviour is brittle beyond the point of instability. Under load-maintained conditions, strains develop extremely rapidly, and it seems reasonable to refer to this as collapse. In Figure 23, showing behaviour in undrained triaxial compression, I distinguish between flow and non-flow conditions, restricting the term liquefaction to the case of zero strength at large strains. According to Wang et al. (2016), “Once the material is in a liquefaction state, the material is overall in a “semi-suspended particle” regime, in which the coordination number is associated with random transient contact between particles instead of load-bearing structure”.
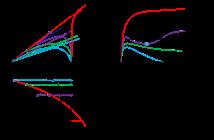
Patterns of behaviour in undrained triaxial compression. IL=instability line, PTL=phase transformation line (CSL: critical state line).
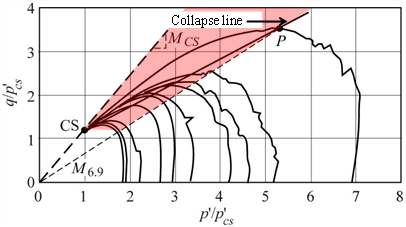
To assist in the explanation of the collapse of a hydraulically placed subsea sand berm, which occurred at Nerlerk in the Canadian Beaufort Sea, Sladen et al. (1985a, b) had introduced the concept of a ‘collapse surface’ in loose sedimented sands. The ‘collapse surface’, or more correctly a ‘collapse line’, was found by drawing a line through the peak points on effective stress paths from isotropically consolidated undrained, CIU, triaxial compression tests on specimens prepared at the same post consolidation void ratio by a form of moist tamping, and connecting this to the steady state or critical state point. Vaid & Chern (1985) used the term ‘the Flow Liquefaction Surface (FLS)’ to refer to a similar surface to the collapse surface. Experiments show that the peak strengths fall on a straight line in stress space. An example of a ‘collapse line’ for loose Leighton Buzzard sand is presented in Figure 24.
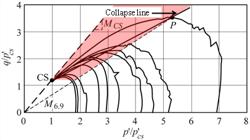
Undrained triaxial compression tests on isotropically consolidated loose Leighton Buzzard sand showing the collapse or instability line, the critical state (CS) and the zone of potential instability (shaded pink). Modified from Leroueil et al. (2009) and Sladen et al. (1985b).
Lade (1993) explored these ideas, and the cause of the Nerlerk failure, referring instead to static instability and to instability lines, IL, which, in Lade’s case had been identified in CIU triaxial compression tests on Valgrinde sand samples prepared by moist tamping (Bjerrum et al., 1961). Lade (1999) summarised his views in a landmark paper.
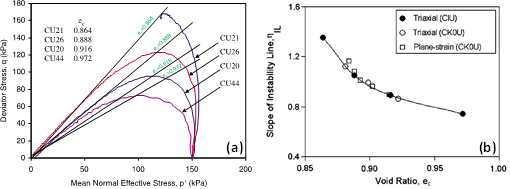
Chu et al. (2003) and Chu & Wanatowski (2008) carried out a comprehensive investigation of instability lines, running CIU triaxial and plane strain compression tests on moist tamped samples of Changi sand. Their tests illustrated how the slope of the instability line varies with void ratio (Figure 25a). Interestingly, Chu & Wanatowski (2008) found that the relationship between the slope of the instability line and void ratio was not affected by whether the specimen was isotropically or Ko consolidated or whether tested in triaxial or plane strain compression (Figure 25b).
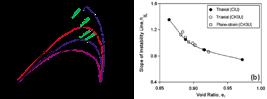
Instability lines and their dependence on void ratio. Typical loose sand behaviour in undrained triaxial compression. Modified from Chu & Wanatowski (2008).
Chu et al. (2003) and Leroueil et al. (2009) introduced a framework which made use of instability lines and critical state to anticipate the response of loose and dense sands to drained and undrained perturbations in slopes. This included the response to reducing mean effective stress at constant shear stress (CSD test), a common situation in slopes undergoing infiltration or rising groundwater level. The framework for loose sand, our interest here, is illustrated in Figure 26.
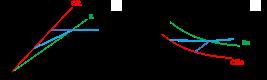
Schematic illustration of instability conditions for loose sand along a CSD path. Modified from Leroueil et al. (2009). (CSD: drained constant shear).
6.3 Summary re instability in triaxial compression
Features of soil behaviour that emerge from these findings for triaxial compression are summarised below.
-
Instability occurs before there is full mobilisation of shearing resistance. Lade (1993): “Instability occurs inside the failure surface and so is not synonymous with failure, although both lead to catastrophic events”. Lade (1999): “In loose sands and sensitive clays in which the pore pressures increase monotonically during shear, the maximum stress difference is reached before the maximum effective stress ratio…. The condition of maximum stress difference does not correspond to a true failure condition, but rather to a condition of minimum stress difference at which instability may develop inside the true failure surface”.
-
Lade (1999): “Instability is not produced along a particular slip surface, but rather in a volume of soil within the slope, and classical slope stability methods cannot be used to produce a factor of safety.’ ‘Instability can potentially be triggered in any region of the slope in which the stress states are above the instability line”.
-
For a granular material to become unstable, the state of stress must be located on or above the instability line, in a zone bounded by the IL and the critical state line, CSL, and referred to as the zone of potential instability or instability zone (Figure 24).
-
Instability can occur under drained, undrained and partially drained conditions.
-
Under undrained and partially drained conditions, only very loose sand can become unstable and this can lead to static liquefaction or collapse if the driving shear stress is and remains significantly higher than the ultimate or critical state strength.
-
Drained instability in both loose and dense sands only occurs when there is a reduction in the mean effective stress that may result from a decrease in total mean stress (e.g. an excavation) or from an increase in pore pressure (e.g. rising groundwater level).
-
The difference between undrained and drained conditions is illustrated using the framework in Figure 26. When a loose sand is sheared along a constant deviator stress path, starting from point I, instability occurs at point Y, on the IL. If the pore water pressure can dissipate freely (i.e. under drained conditions), the stress path will eventually reach the failure state at point C1, on the critical state line. which is also the failure line for loose sands. During this process, large axial and volumetric strains will develop, and the void ratio of the soil will decrease. If the pore water pressure cannot dissipate, the stress path will move towards the critical state associated with its current water content, i.e. C2, under undrained conditions.
-
A triggering mechanism for collapse is one that causes the pore pressure to increase faster than it can dissipate when the stress state is in the instability zone or has been brought to the instability line. Once initiated, collapse can propagate progressively and rapidly, particularly into areas where the stress state lies in the instability zone. Triggers for the flow slides in the micaceous sands at Jamuna included drained and undrained excavations by dredging, which were accompanied by principal stress rotation, and cyclic loading during storms which increased pore pressures.
-
Strains to reach the instability line are small, making it difficult to use displacement monitoring to predict incipient instability. The small strains probably explain the insensitivity to the value of b when comparing triaxial and plane strain compression tests (Figure 25b). Again, because strains are small, and so before particle rotation, the instability line is not affected strongly by localisation.
7. Anisotropy of undrained shear behaviour, including instability, of water and air pluviated loose sand
7.1 Hollow cylinder apparatus tests
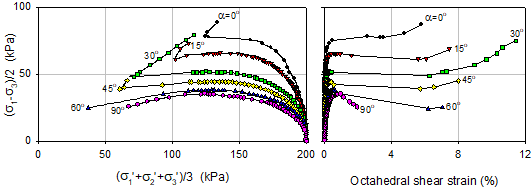
In 1998 I presented Figure 27 from Professor Shibuya’s 1985 thesis, showing the anisotropy of undrained behaviour in sedimented, isotropically consolidated Ham River sand, sheared with different orientations of the major principal stress to the vertical, alpha, in the hollow cylinder apparatus (HCA); these tests were run with the intermediate principal stress ratio, b, being equal to zero. 1998 turned out to be a vintage year for data from tests in different hollow cylinder apparatuses on different sedimented sands, with different values of b – see Figure 28 for data from Yoshimine at al (1998) on Toyoura sand and Figure 29 for data from Uthayakumar & Vaid (1998) on Fraser River sand. There was also an HCA based paper by Nakata et al. (1998) on Toyoura sand at different relative densities and confining stress levels. The pattern was consistent, and, reassuringly, the same pattern has been captured in more recent HCA studies and in DEM experiments (e.g. Yamada et al., 2023; Farhang & Mirghasemi, 2017).
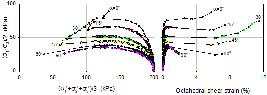
Undrained behaviour of water pluviated Ham river sand in HCA tests, b= 0, alpha varying. Modified from Shibuya (1985).
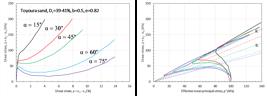
Undrained behaviour of water pluviated Toyoura sand in HCA tests, b= 0.5, alpha varying, Dr=39-41%. Modified from Yoshimine et al. (1998).

Undrained behaviour of water pluviated Fraser River sand in HCA tests, b= 0, alpha varying, Dr=30%. Modified from Uthayakumar & Vaid (1998).
7.2 Anisotropy of instability and brittleness
The similarity between the observed undrained behaviours in different clean and sub-angular sands and different testing equipment is striking:
-
Sedimented sands are non-brittle when the major principal stress is vertical (alpha = 0 degrees). This is consistent with the findings in triaxial compression tests on sedimented sands and contrasts with the extreme brittleness that is found in the same sand at the same global void ratio when prepared by moist tamping.
-
Sedimented sands become brittle when sheared with the major principal stress rotated away from the vertical, i.e. from the direction of deposition (alpha > 15 to 30 degrees). This is perfectly logical when considering the fabric that develops during sedimentation (e.g. Oda, 1972) and the anisotropic load transfer framework that develops in sands, having the ability to protect macrovoids (Figure 3), until principal stresses are rotated.
-
Peak undrained strengths at the point of instability reduce with increasing values of alpha.
-
Strains to peak are small for all values of alpha.
The anisotropy observed in these HCA tests is that existing after sedimentation and so before any subsequent stress or strain history. It could be indicative of the anisotropy of relatively recently sedimented silty sand tailings but one must consider the potential impact of fines.
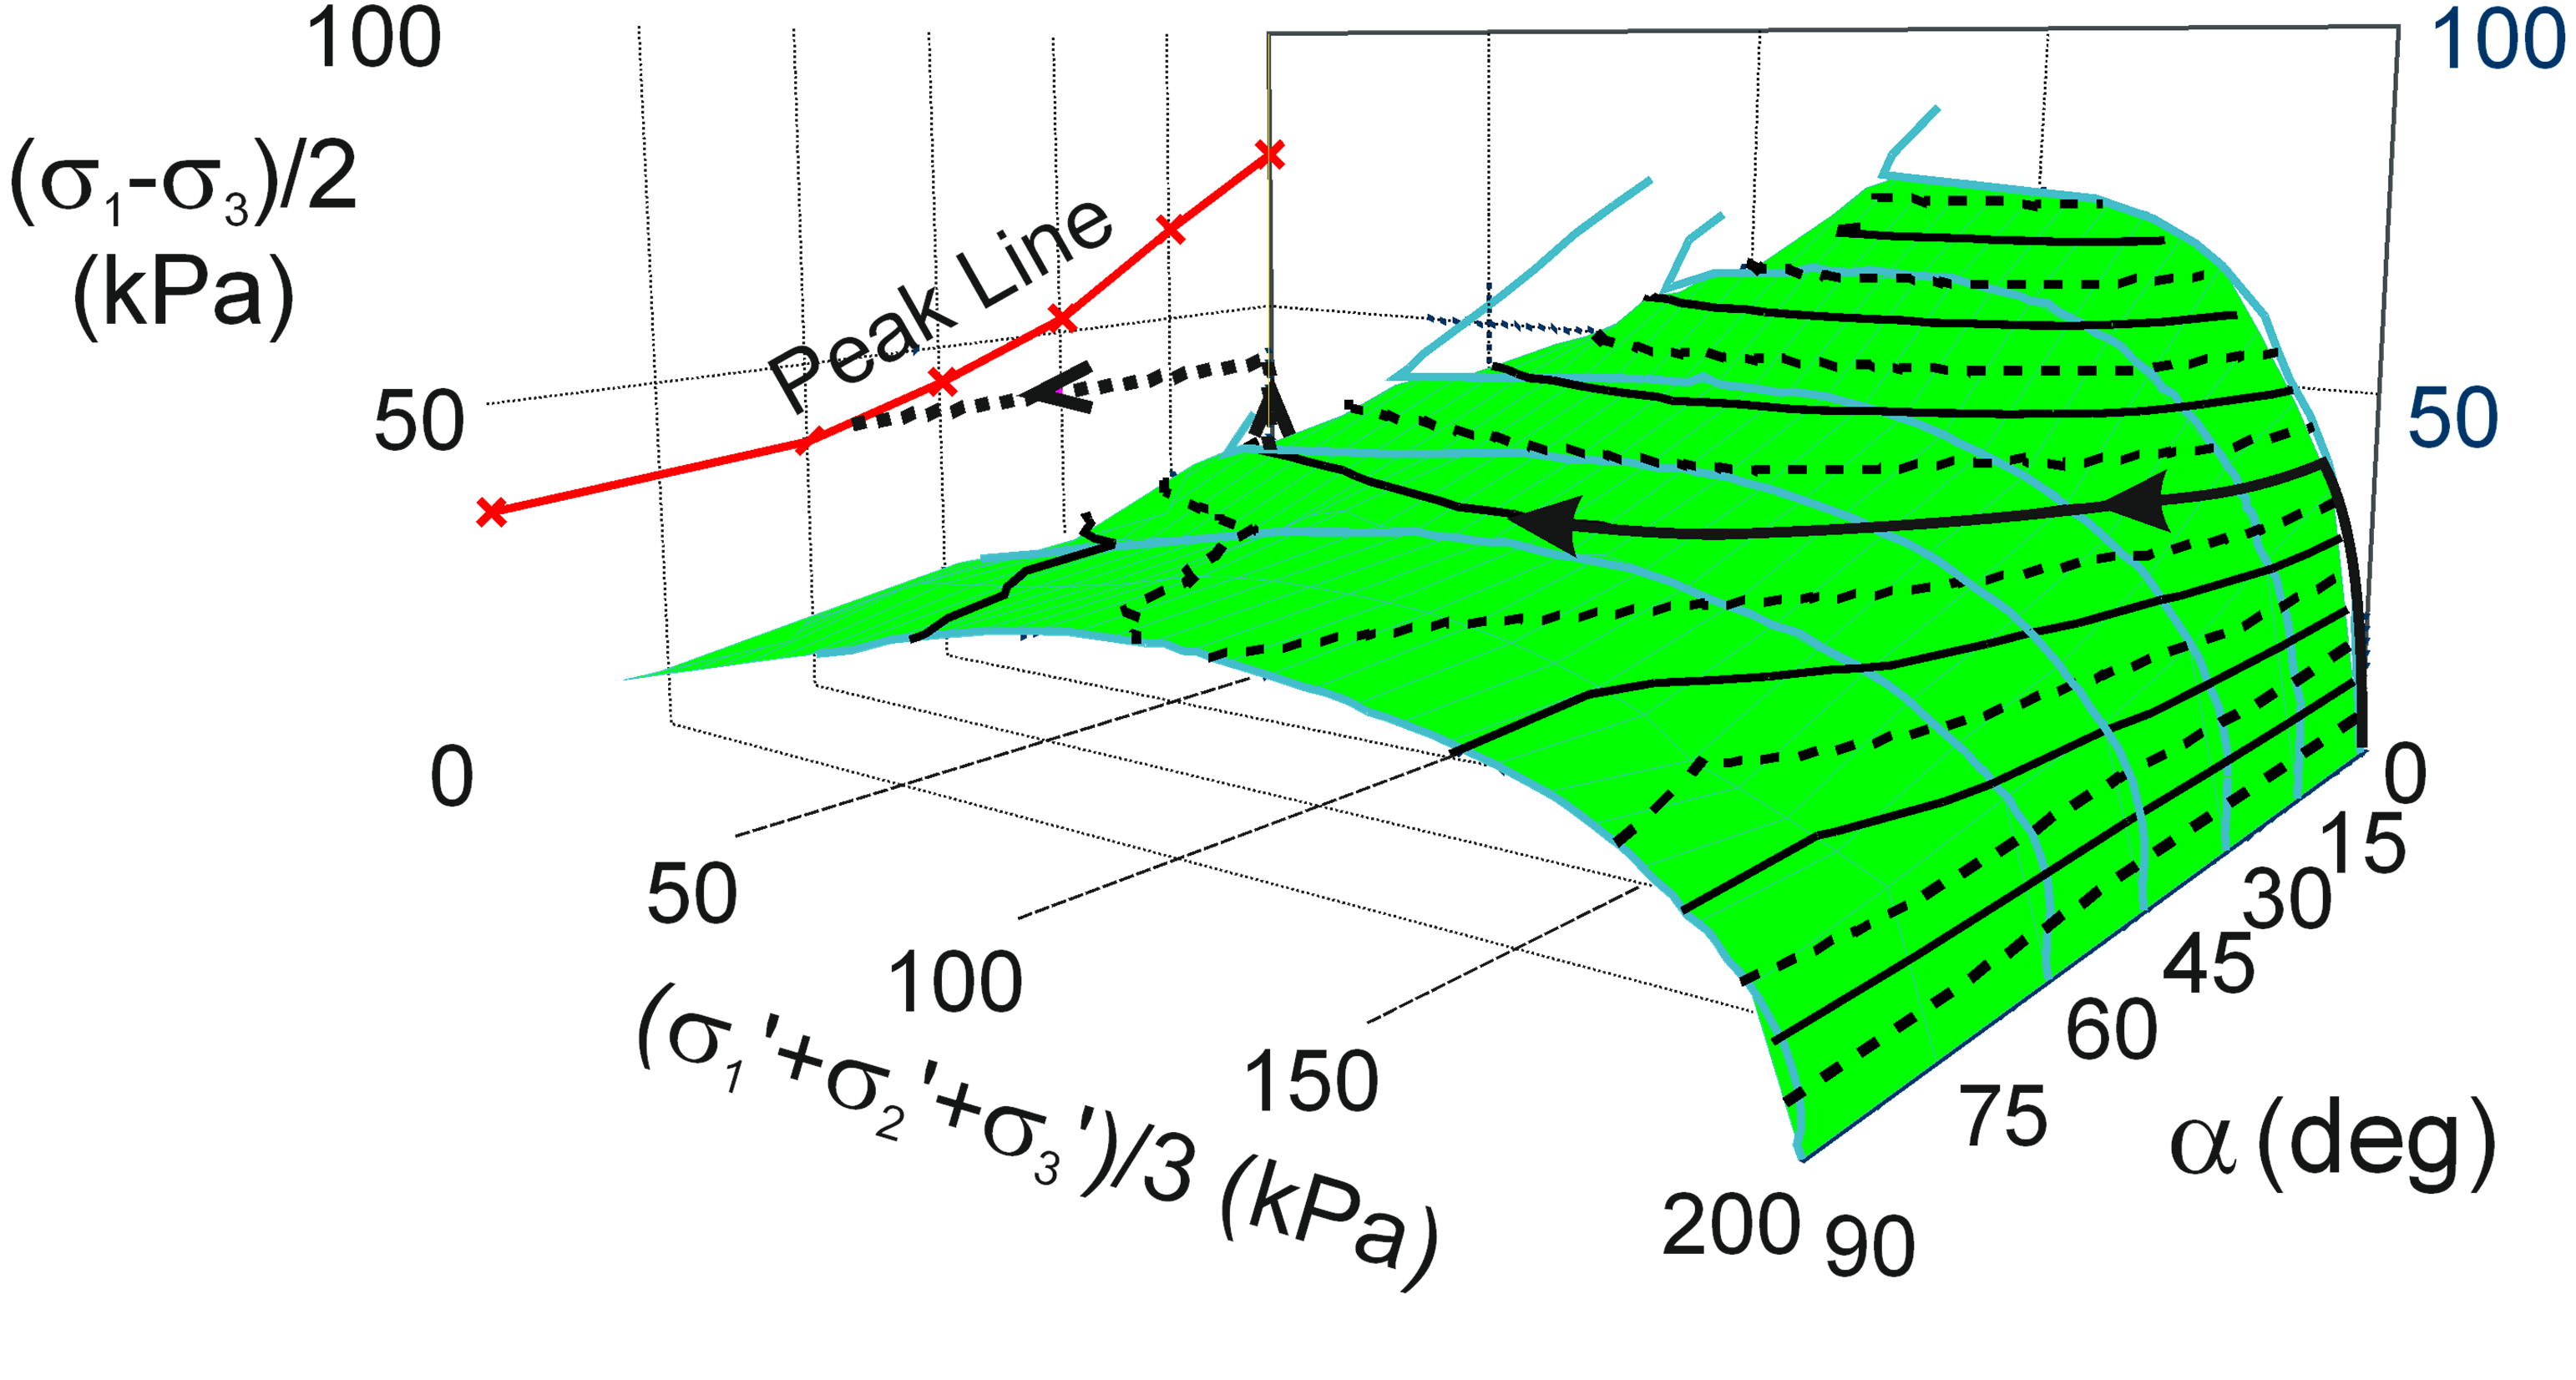
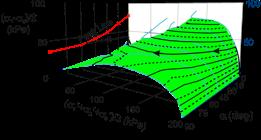
Stacking the effective stress paths from CIU HCA tests on sedimented Ham River Sand in q-p’-e space (Figure 30), the initial anisotropy of the sand can be portrayed, and the resulting surface can be used to identify when collapse could occur under rotation of principal stresses at constant deviator stress. Slices through this surface at constant alpha, can, with the addition of the relevant instability line and critical state line, be used to define the instability zone and to anticipate when instability could develop, for example as in a CSD test at different or constant alpha values (Figure 30).
7.3 Localisation in HCA tests
Beyond the point of instability, HCA samples of loose sand develop spiral shear bands, removing any possibility of identifying critical states at different values of alpha. Localisation is inevitable in view of the non-uniformity of stresses across the wall of the HCA sample, when torsion is applied, or different inner and outer pressures are maintained. In HCA tests run wholly under stress control, contractancy after the point of instability initiates a runaway failure that can probably, at sufficiently low mean effective stress, over-ride phase transformation.
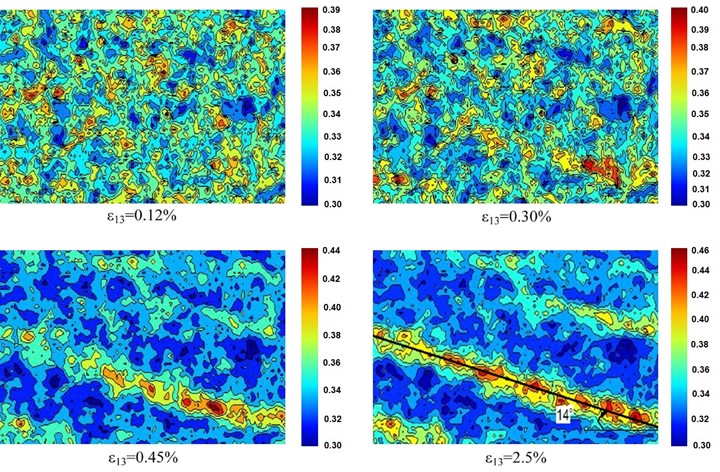
A DEM investigation of localisation in HCA tests was described by Li et al. (2015). Li et al. (2015) demonstrated in their DEM, that ‘a dominant shear band is initiated in the vicinity of the peak strength and fully develops as the loading moves toward the critical state. …The inclination of the shear band appears to depend on both friction angle and the dilation angle.’ In this case, the peak strength was determined at a strain of 0.3% to 0.45%.
This is good news in that up to the strains at which instability occurs, conditions in the hollow cylinder sample are reasonably uniform (Figure 31).
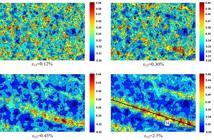
Localisation in a hollow cylinder sample with alpha at 45 degrees. Porosity evolution at increasing deviatoric strain. Peak strain between 0.3 and 0.45%. Modified from Li et al. (2014).
7.4 Anisotropy of instability lines
For the reasons of localisation explained above, the critical state in HCA tests cannot be defined and so the instability line cannot be connected to the critical state. To illustrate the dependence of instability on principal stress direction, instability lines have been added to Figures 28 and 29, passing through the origin and the peak point of the undrained effective stress path. Adding instability lines in this way shows that the IL inclinations reduce as alpha increases. The fan of instability lines for different alpha values is similar to the fan for different void ratios in triaxial compression (Figure 32).
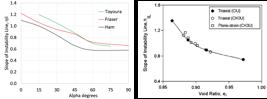
Extending our summary of the features of instability to other than triaxial compression we can say:
-
Instability line inclination varies with void ratio, shearing mode and direction, alpha.
-
Zone of potential instability increases with increasing alpha and global void ratio.
-
Instability can also be triggered by undrained rotation of principal stress directions at constant or increasing shear stress.
8. Spatial variation in void ratio, specimen preparation, localisation, instability, partial drainage and a chain reaction
8.1 Void ratio
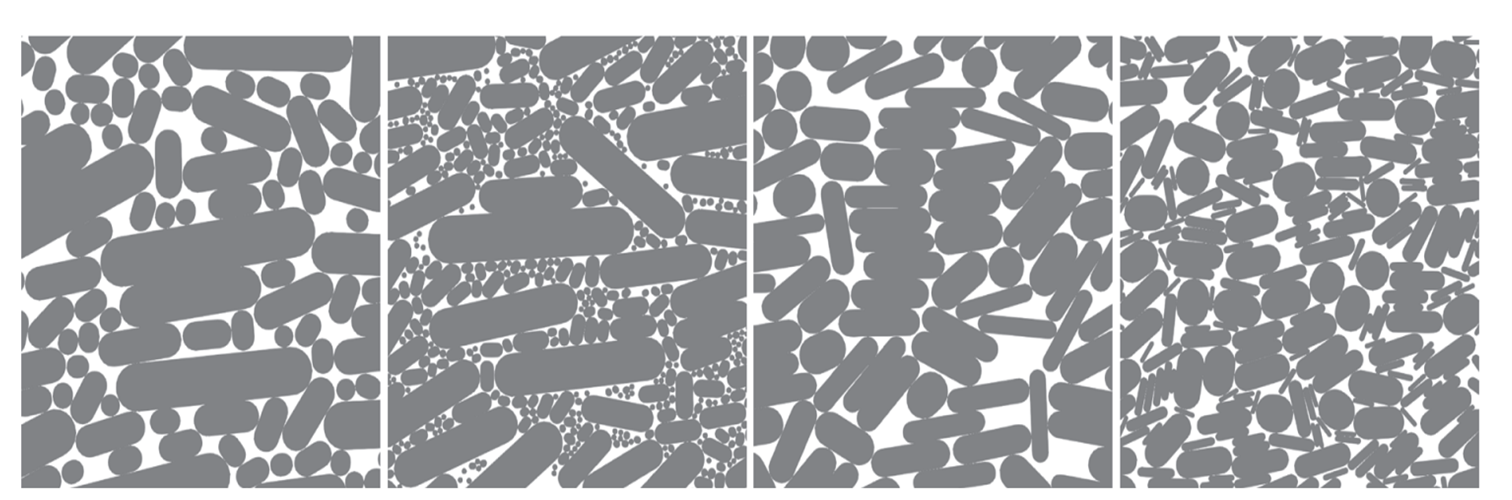
Void ratio is the average ratio of void space to the volume of solid particles in a specimen or mass of soil. Void ratio cannot convey the fabric of the soil, in particular the particle arrangement in terms of the distribution of the different particle sizes. Figure 33 makes this point, showing different particle arrangements at the same nominal void ratio.

Illustration of potential ranges in the arrangement of identical particles at the same relative density.
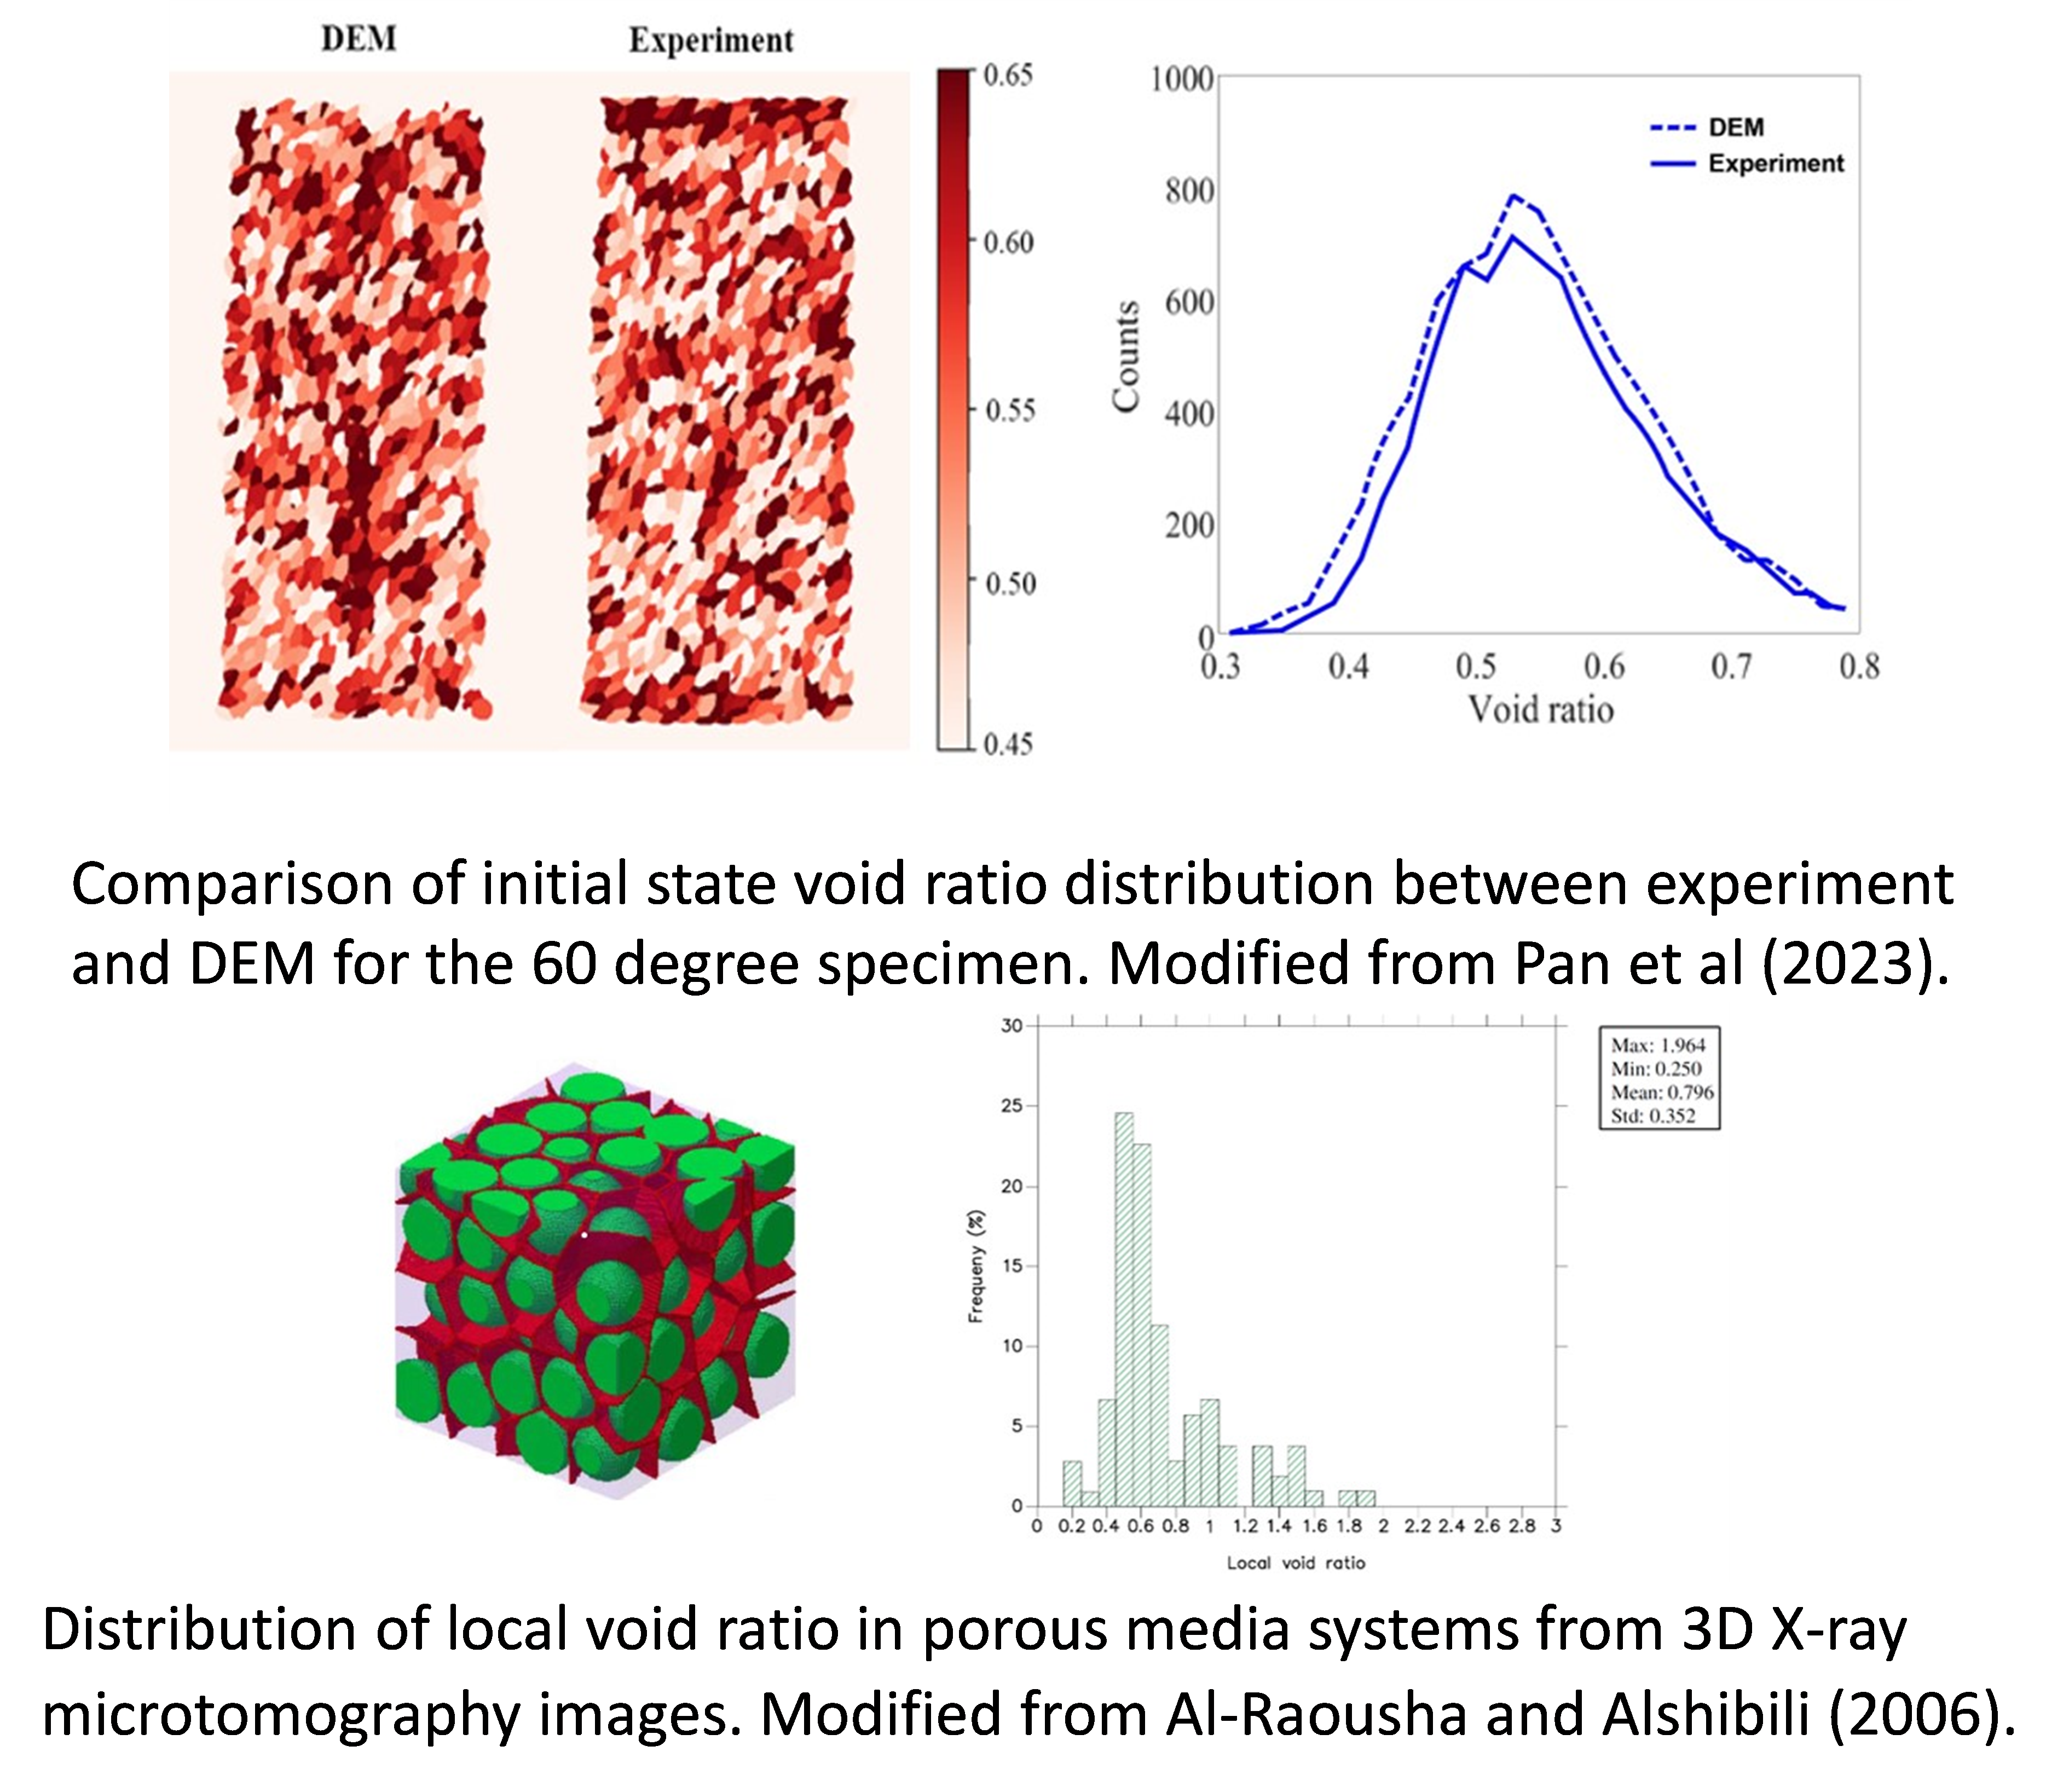
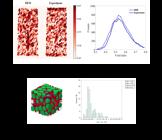
The problem with void ratio is that it is a global measure of density of packing, yet in natural and reconstituted soils, local void ratios can and do vary widely. In this context, local void ratio of a particle is defined as the ratio of the volume of the void space associated with the particle divided by the volume of the particle. My attention was drawn to this shortcoming in void ratio by the painstaking work published by Jang & Frost (1998) from whom I took Figure 34 and included it in the Rankine Lecture. The work was unable to deal with loose sands because it depended on being able to infiltrate the specimens with resin, but without disturbing their packing. The results showed clearly: the variations in local void ratio in graded sand; the dependence of that variation on the method of specimen preparation, in this case moist tamped and air pluviated specimens; and the fact that the scale of variation, higher in moist tamped specimens, increased with increasing global void ratio.

Relation between mean and standard deviation of local void ratio distributions. Modified from Jang & Frost (1998).
One of the by-products of the developments in observing individual particles in specimens, in this case micro-computed X-ray tomography, is confirmation of this variation in void ratio. Two examples from the literature are shown in Figure 35, both illustrating the wide range of local void ratio.
8.2 Dependence of macro behaviour of loose sands on method of specimen preparation. (How can samples prepared in different ways to the same global void ratio be dilatant and stable or contractant and unstable?)
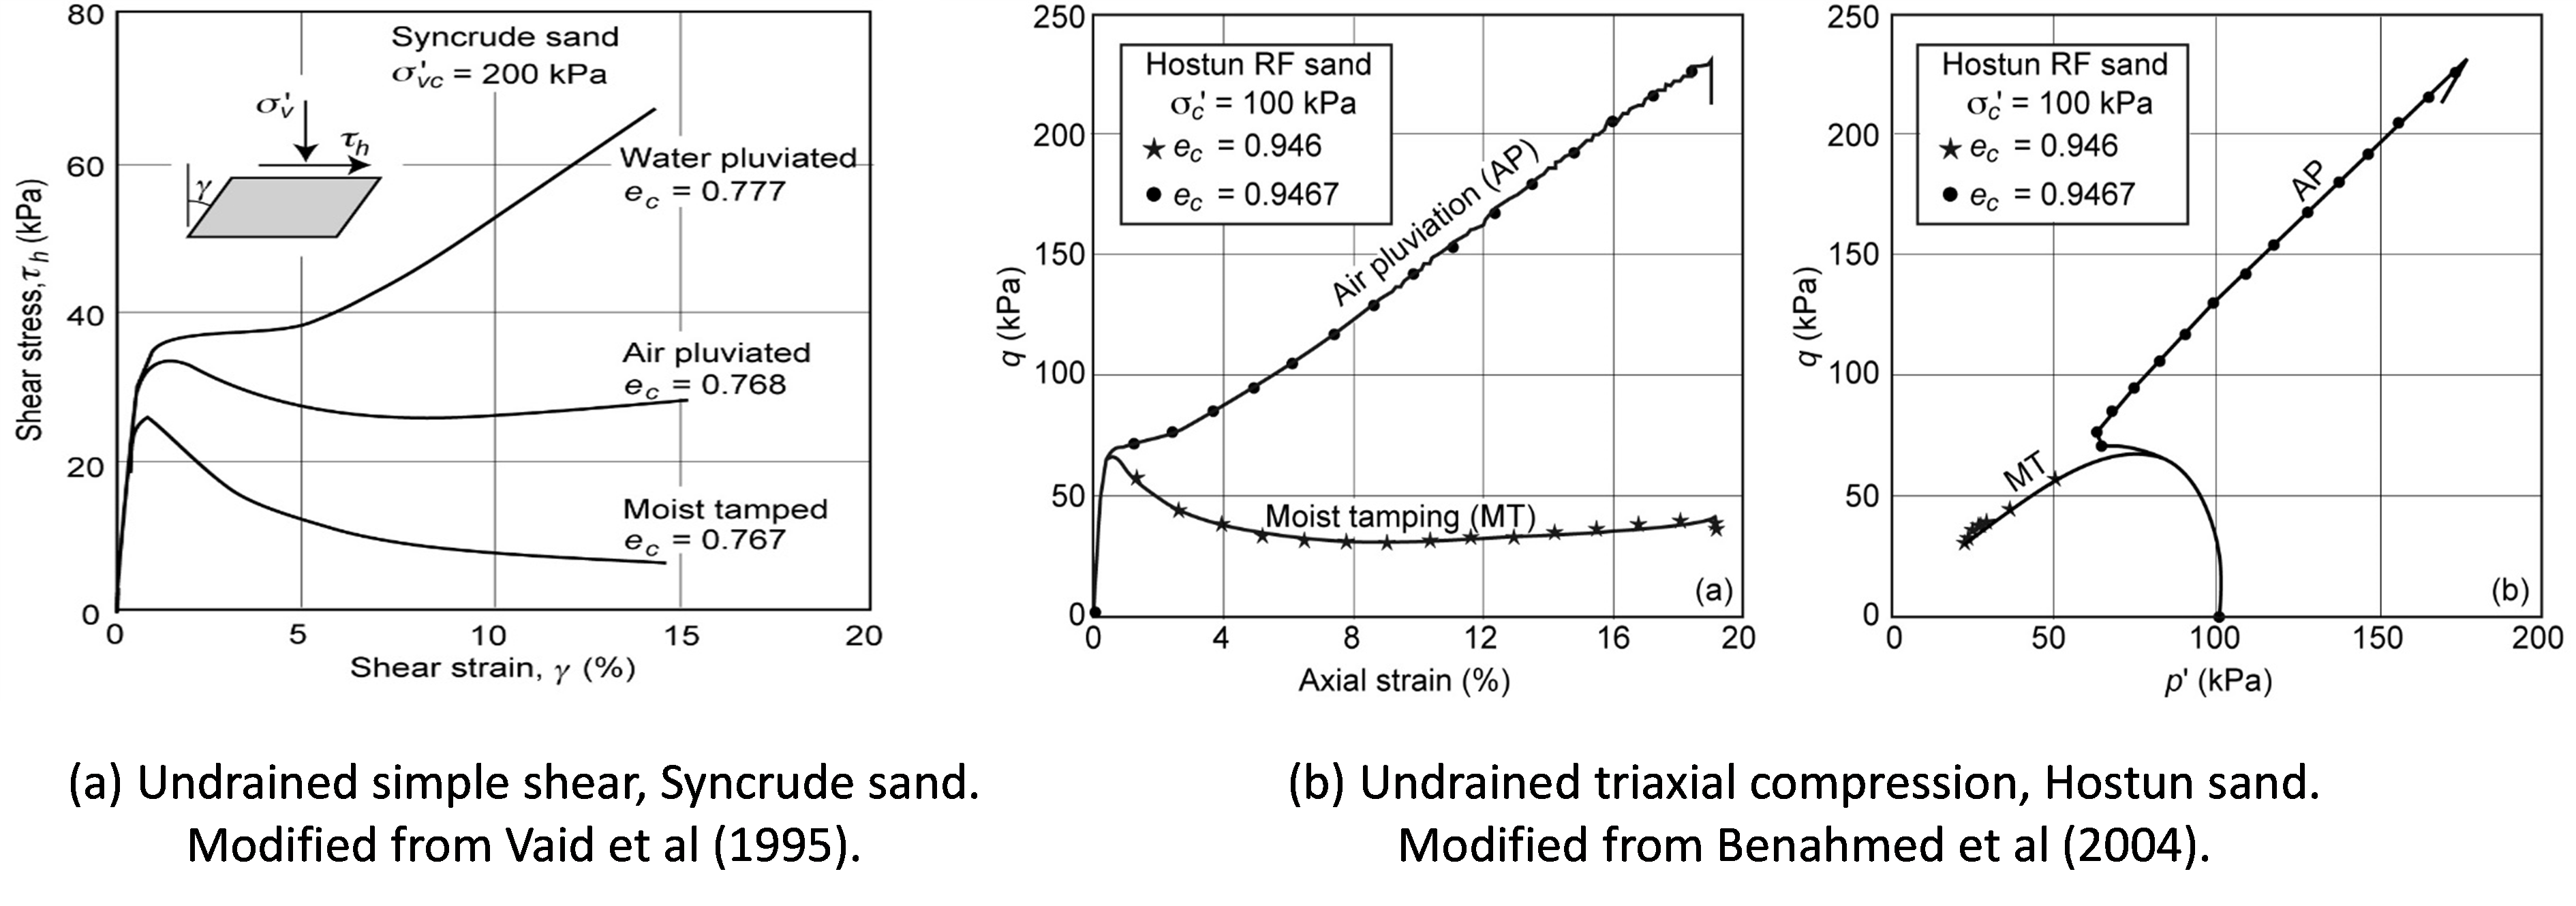
There are many examples of the difference in undrained shear behaviour of loose sands which have been prepared to the same global void ratio, but in different ways, and consolidated to the same stresses. The differences between the behaviour of specimens prepared by moist tamping and by pluviation, wet or dry, are illustrated in Figure 36; Figure 36a shows the different stress strain data from constant volume simple shear tests on Syncrude sand, and Figure 36b shows the different stress-strain and effective stress paths in triaxial compression tests on Hostun sand.
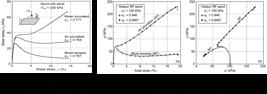
The differences are superficially ascribed to differences in fabric, but which aspects of fabric? Note that differences are seen at small strains, at instability, and at large strains, approaching critical state. The moist tamped specimen collapses and flows, with no sign of phase transformation and so no suggestion that it will reach the same critical state as that to which the pluviated specimen is heading.
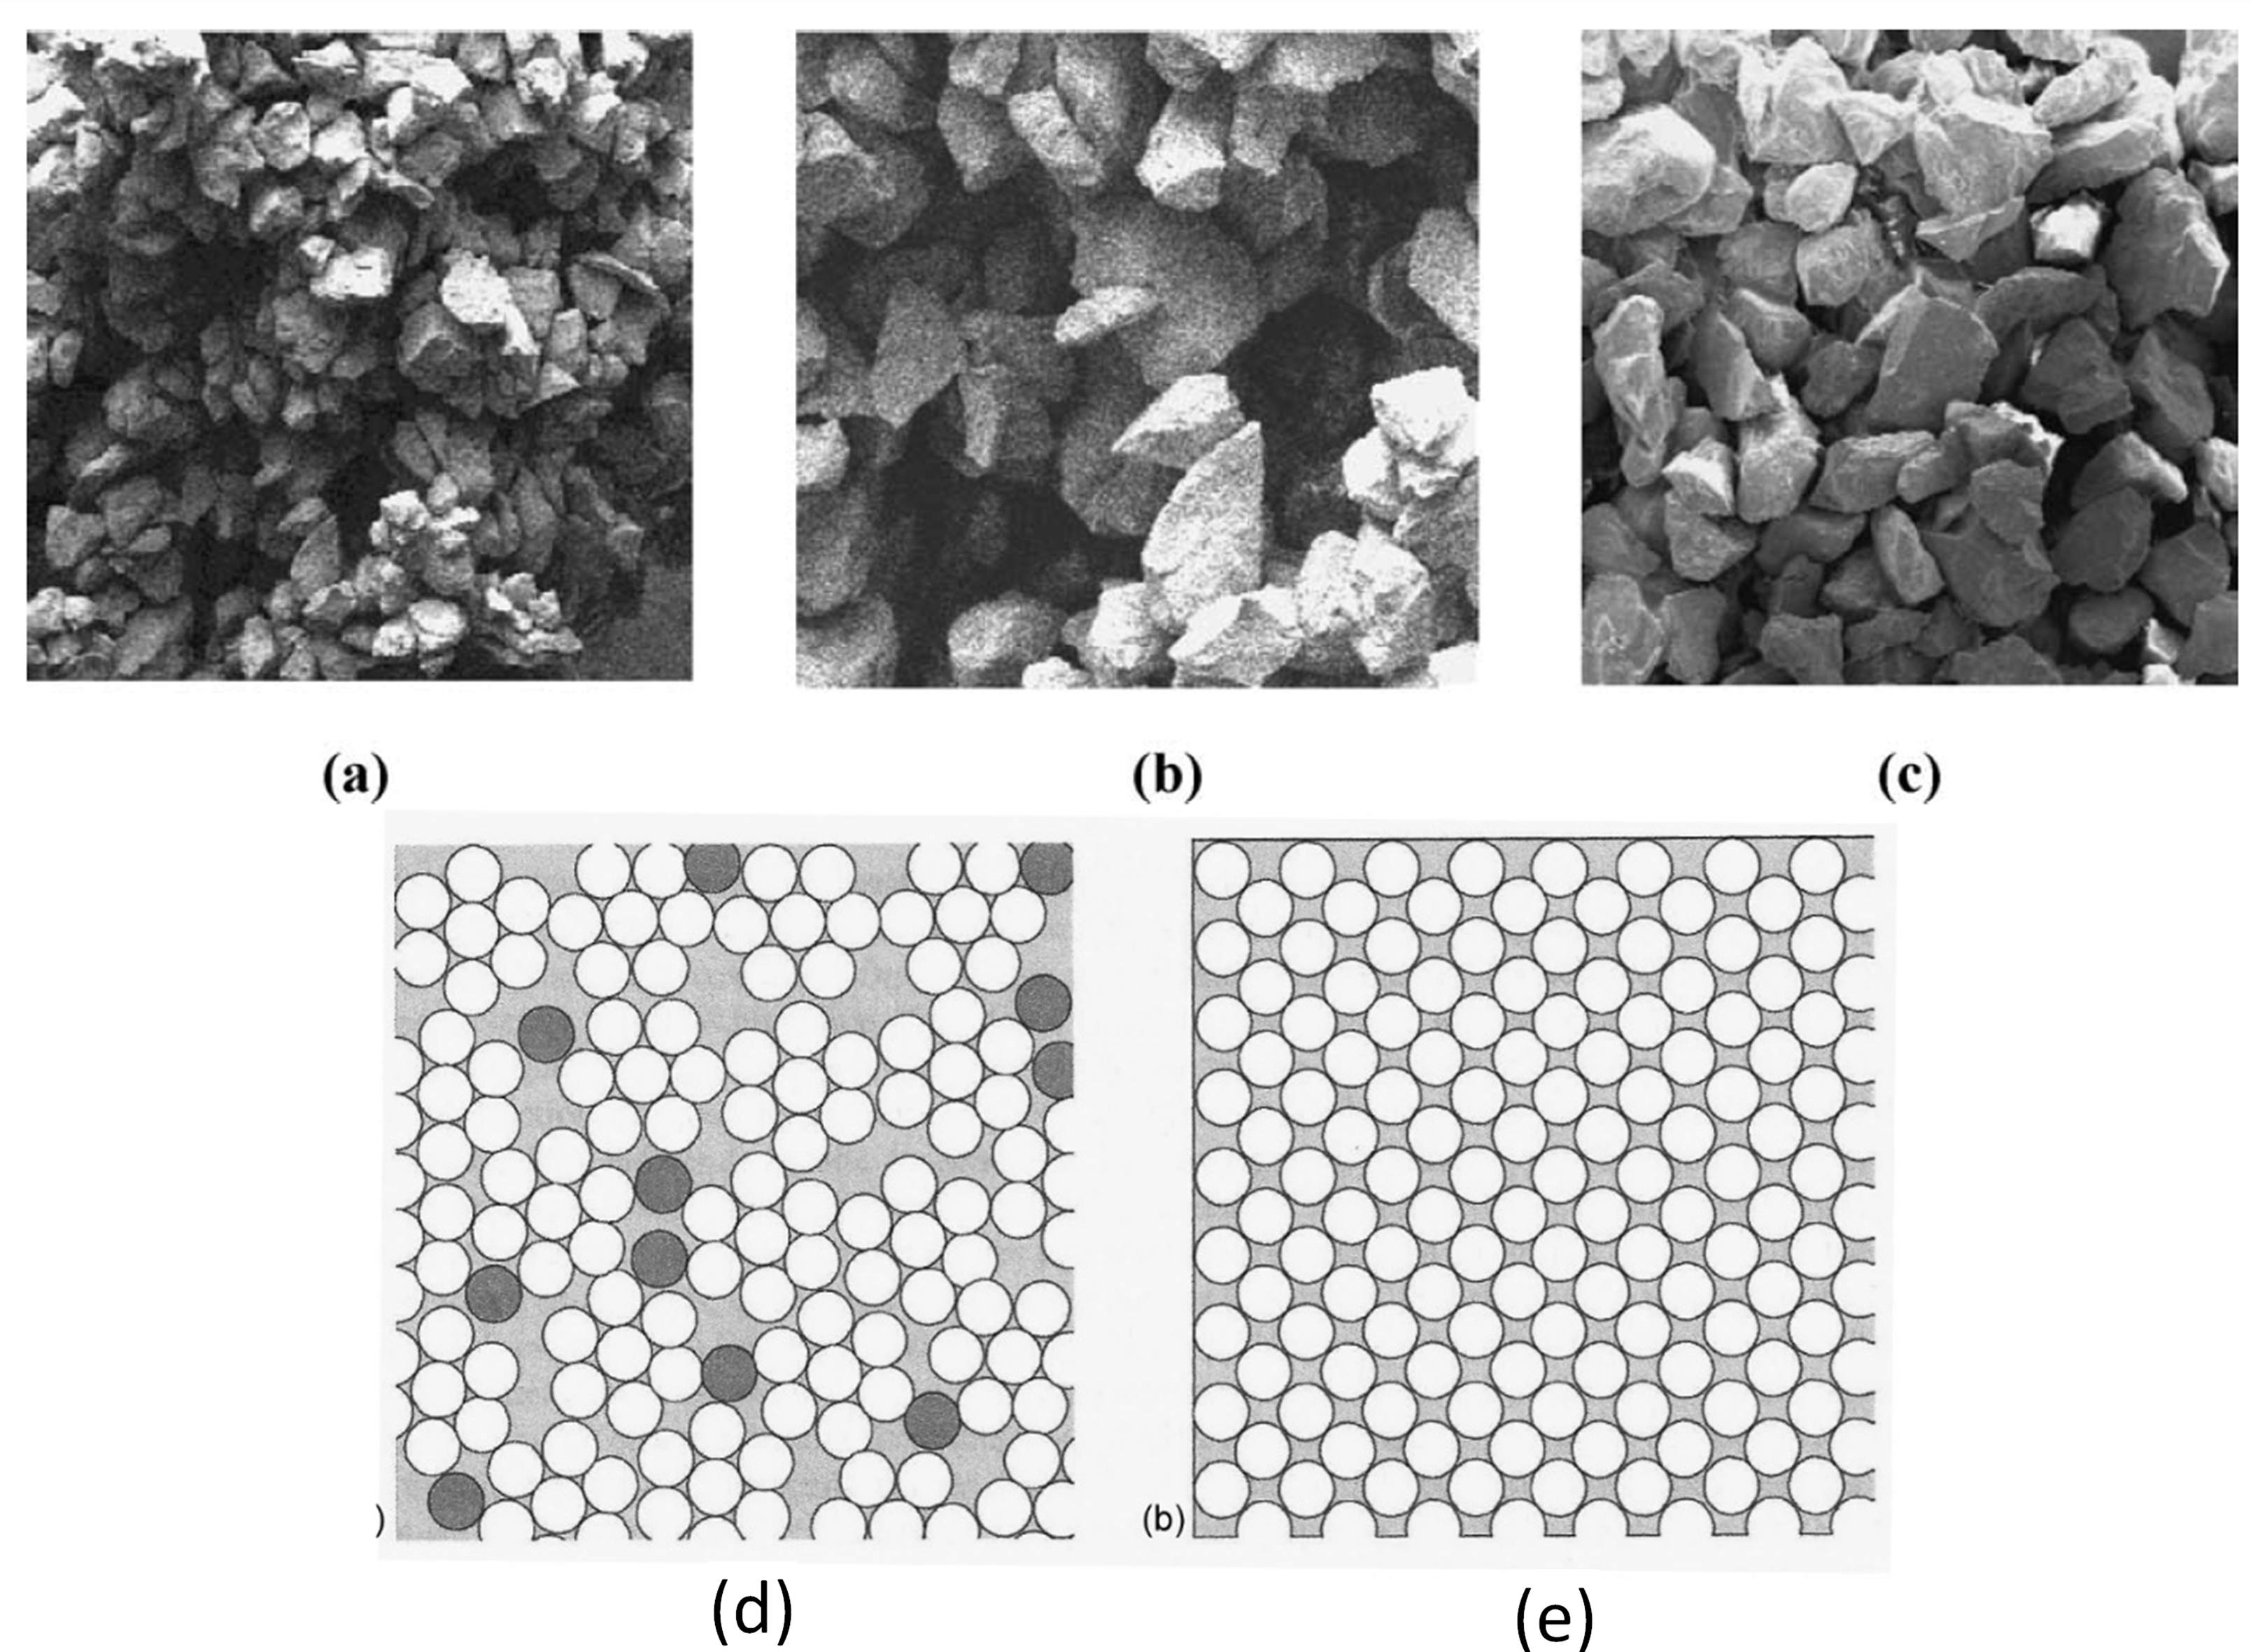
Benahmed et al. (2004) provide valuable insight into the mesofabric of the moist tamped sample of Hostun sand. Based on the photographs in Figure 37a and b and recognising the clustering of particles encouraged by menisci forces, they suggest the conceptual picture of void distribution shown in Figure 37d. Work on localisation described above tells us that inhomogeneities of this form can trigger localisation and that behaviour in a shear zone determines observed macro/global behaviour.

Photographs of moist tamped (a and b) and air pluviated (c) samples. Conceptual bidimensional representation (d) aggregated fabric (e) homogeneous fabric at same void ratio. Modified from Benahmed et al. (2004).
8.3 A chain reaction
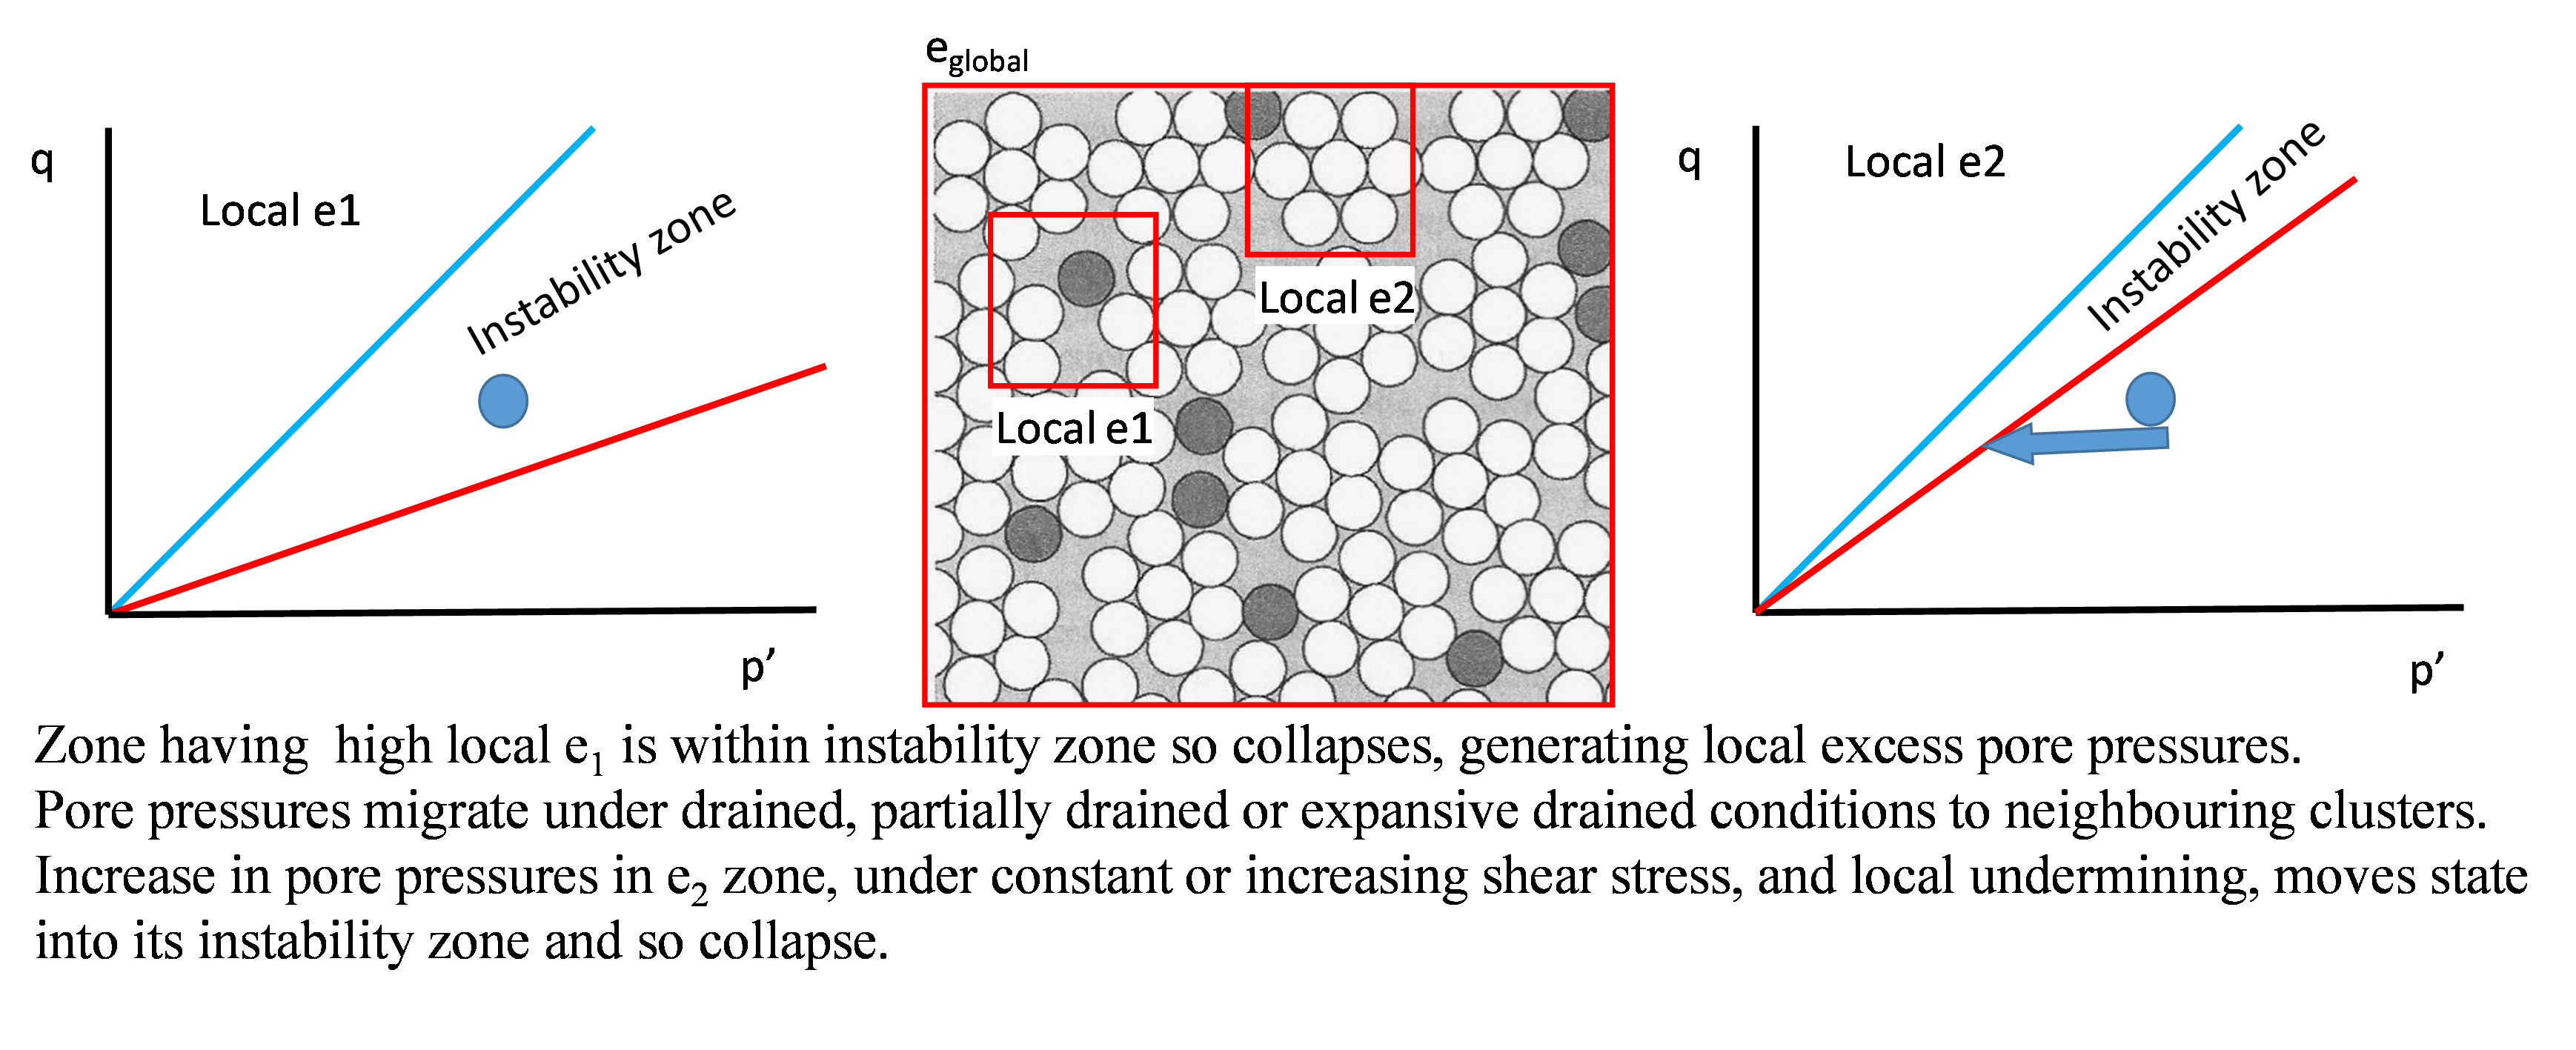
A chain reaction inside the specimen, triggered by an initial local collapse, can be envisaged, referring to Figure 38:
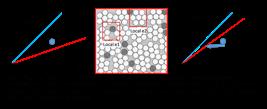
Chain reaction in globally undrained moist tamped sample with spatial; y varying local void ratios. Illustrative figure.
-
The zone having a high local void ratio, e1, is within the instability zone and so collapses under loading, generating local excess pore pressures. This is localisation at a particle level.
-
Pore pressures migrate under drained, partially drained or expansive drained conditions, discussed below, to neighbouring clusters.
-
Increase in pore pressures in the e2 zone, under constant or increasing shear stress, and local undermining, moves the state into its instability zone and so that zone collapses.
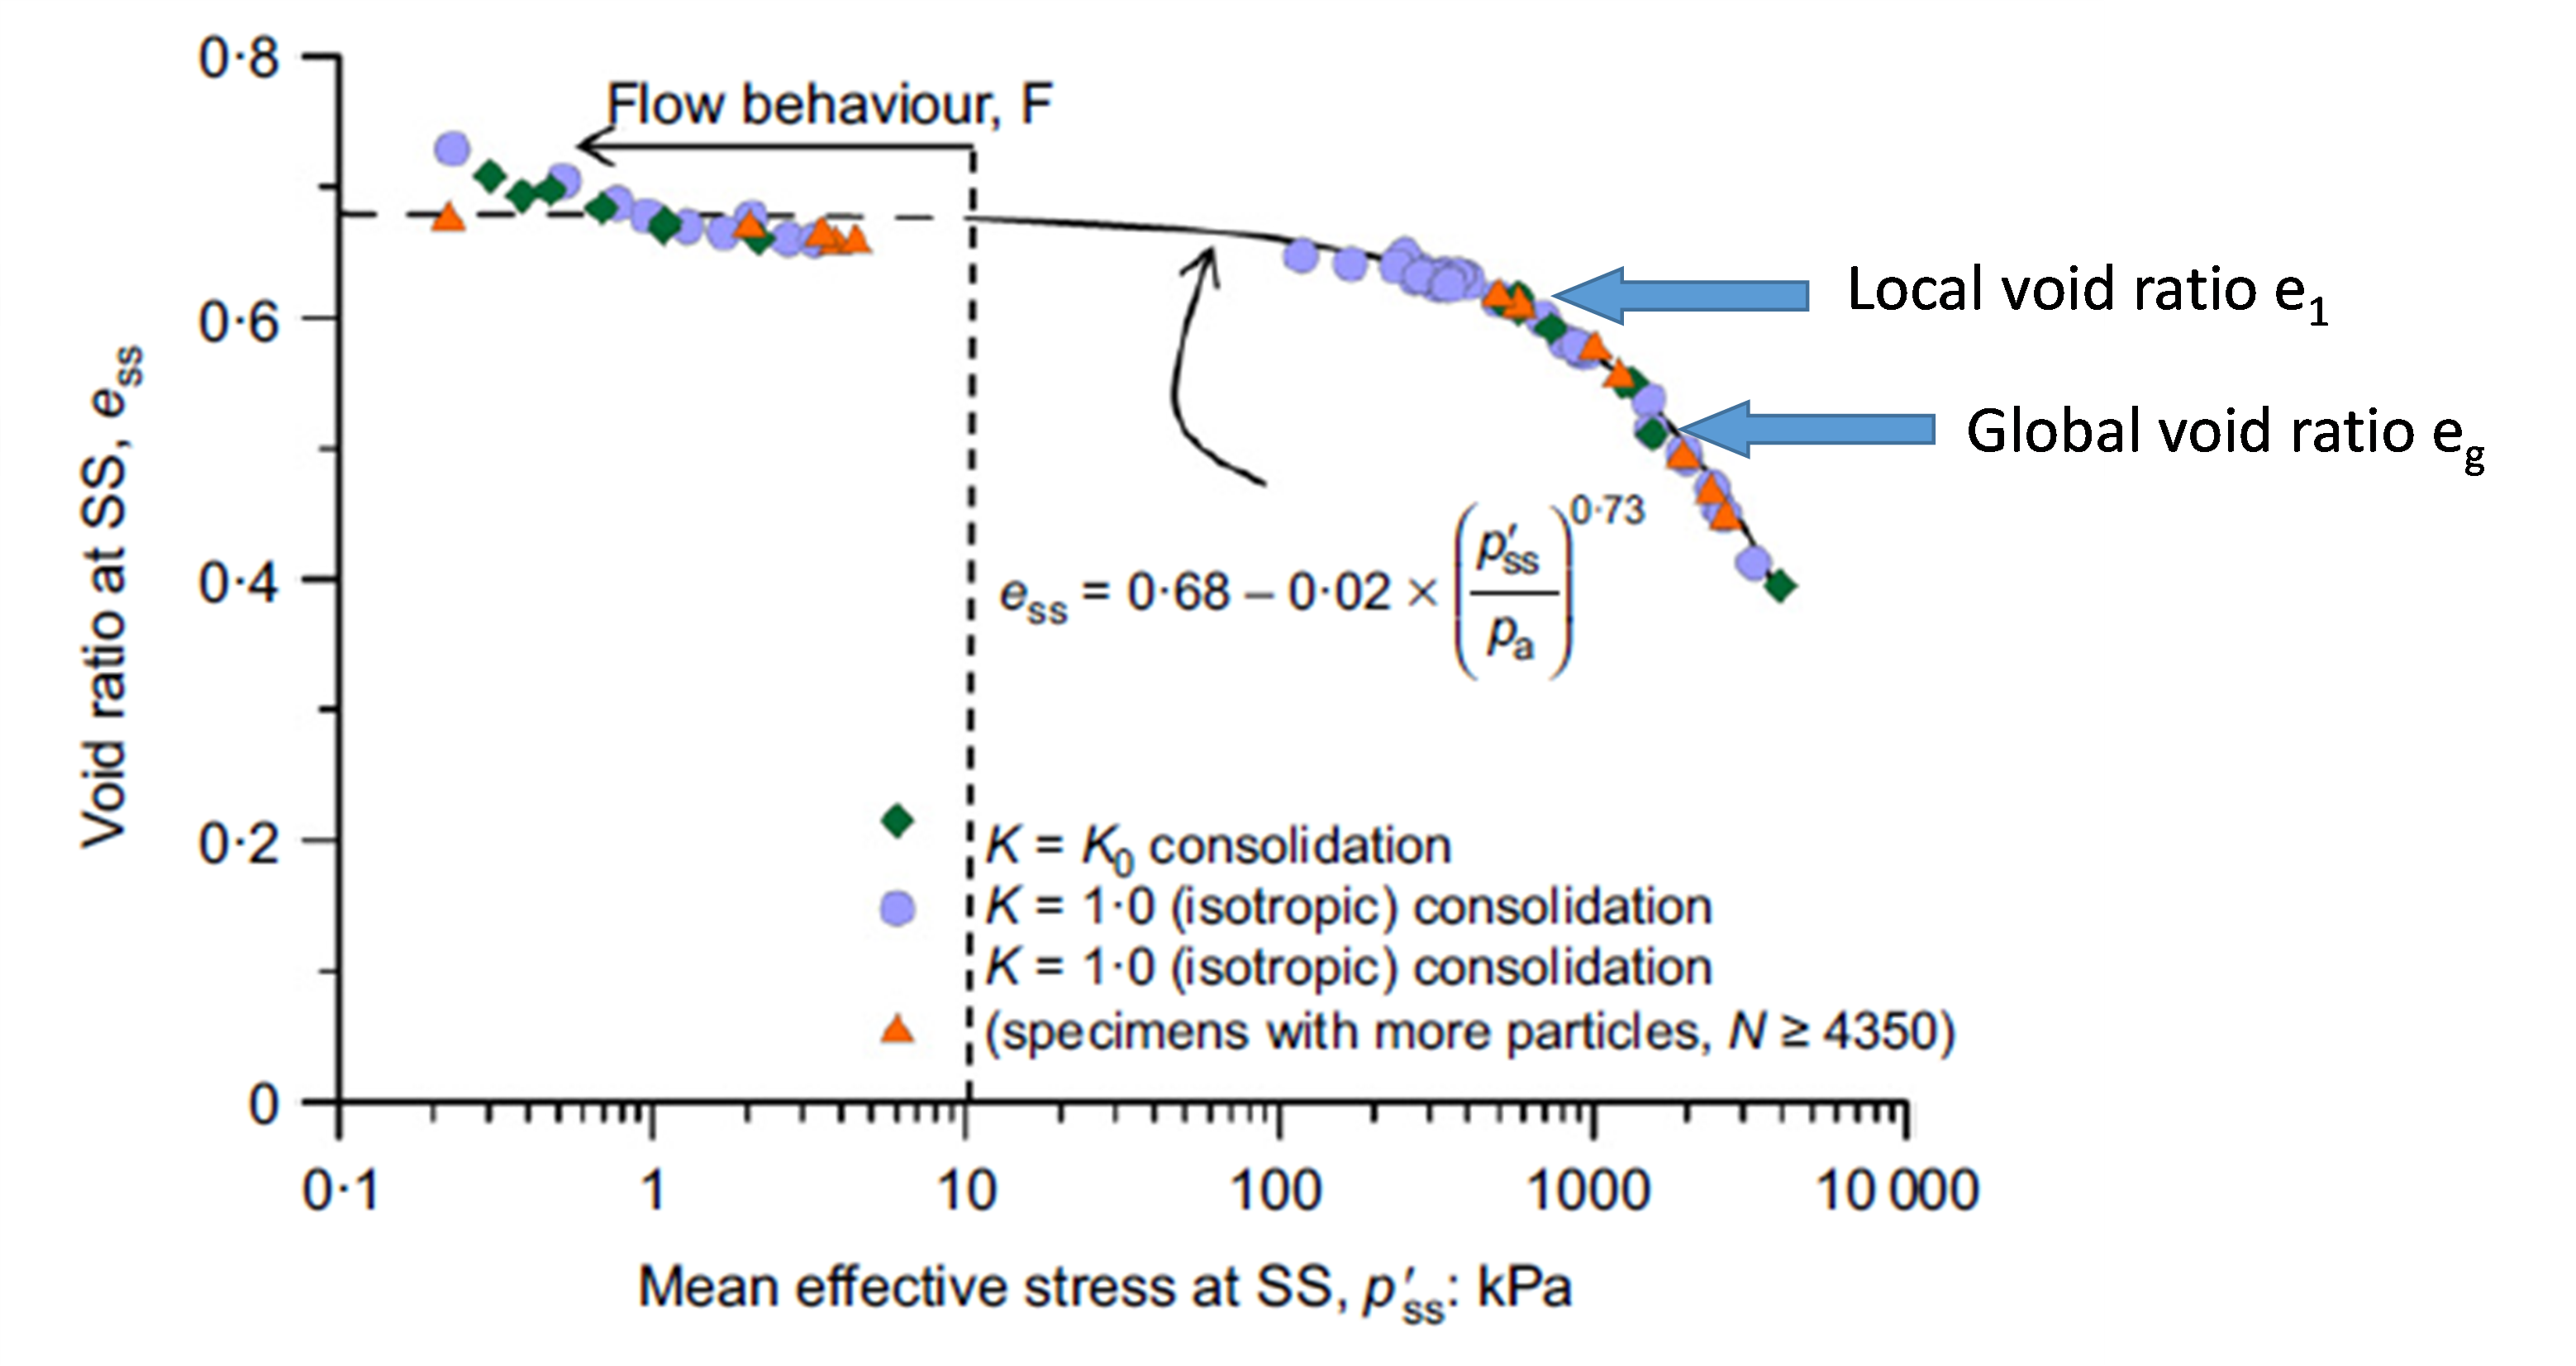
It follows that the behaviour of the moist tamped specimen is determined by its spatial variation in void ratio and the presence of macrovoids which trigger localisation and the formation of shear bands The shear bands control the macro behaviour and the local void ratio in the shear band is high enough to be consistent with flow failure in the critical state concept (Figure 39).

Local void ratio e1 initiates chain reaction and is consistent with CS predictions. Illustrative figure.
The putative development of shear bands in loose moist tamped samples is confirmed by Cao et al. (2020) who observed banding in the moist-tamped samples, while bulging was observed in the middle portion of the air-pluviated samples.
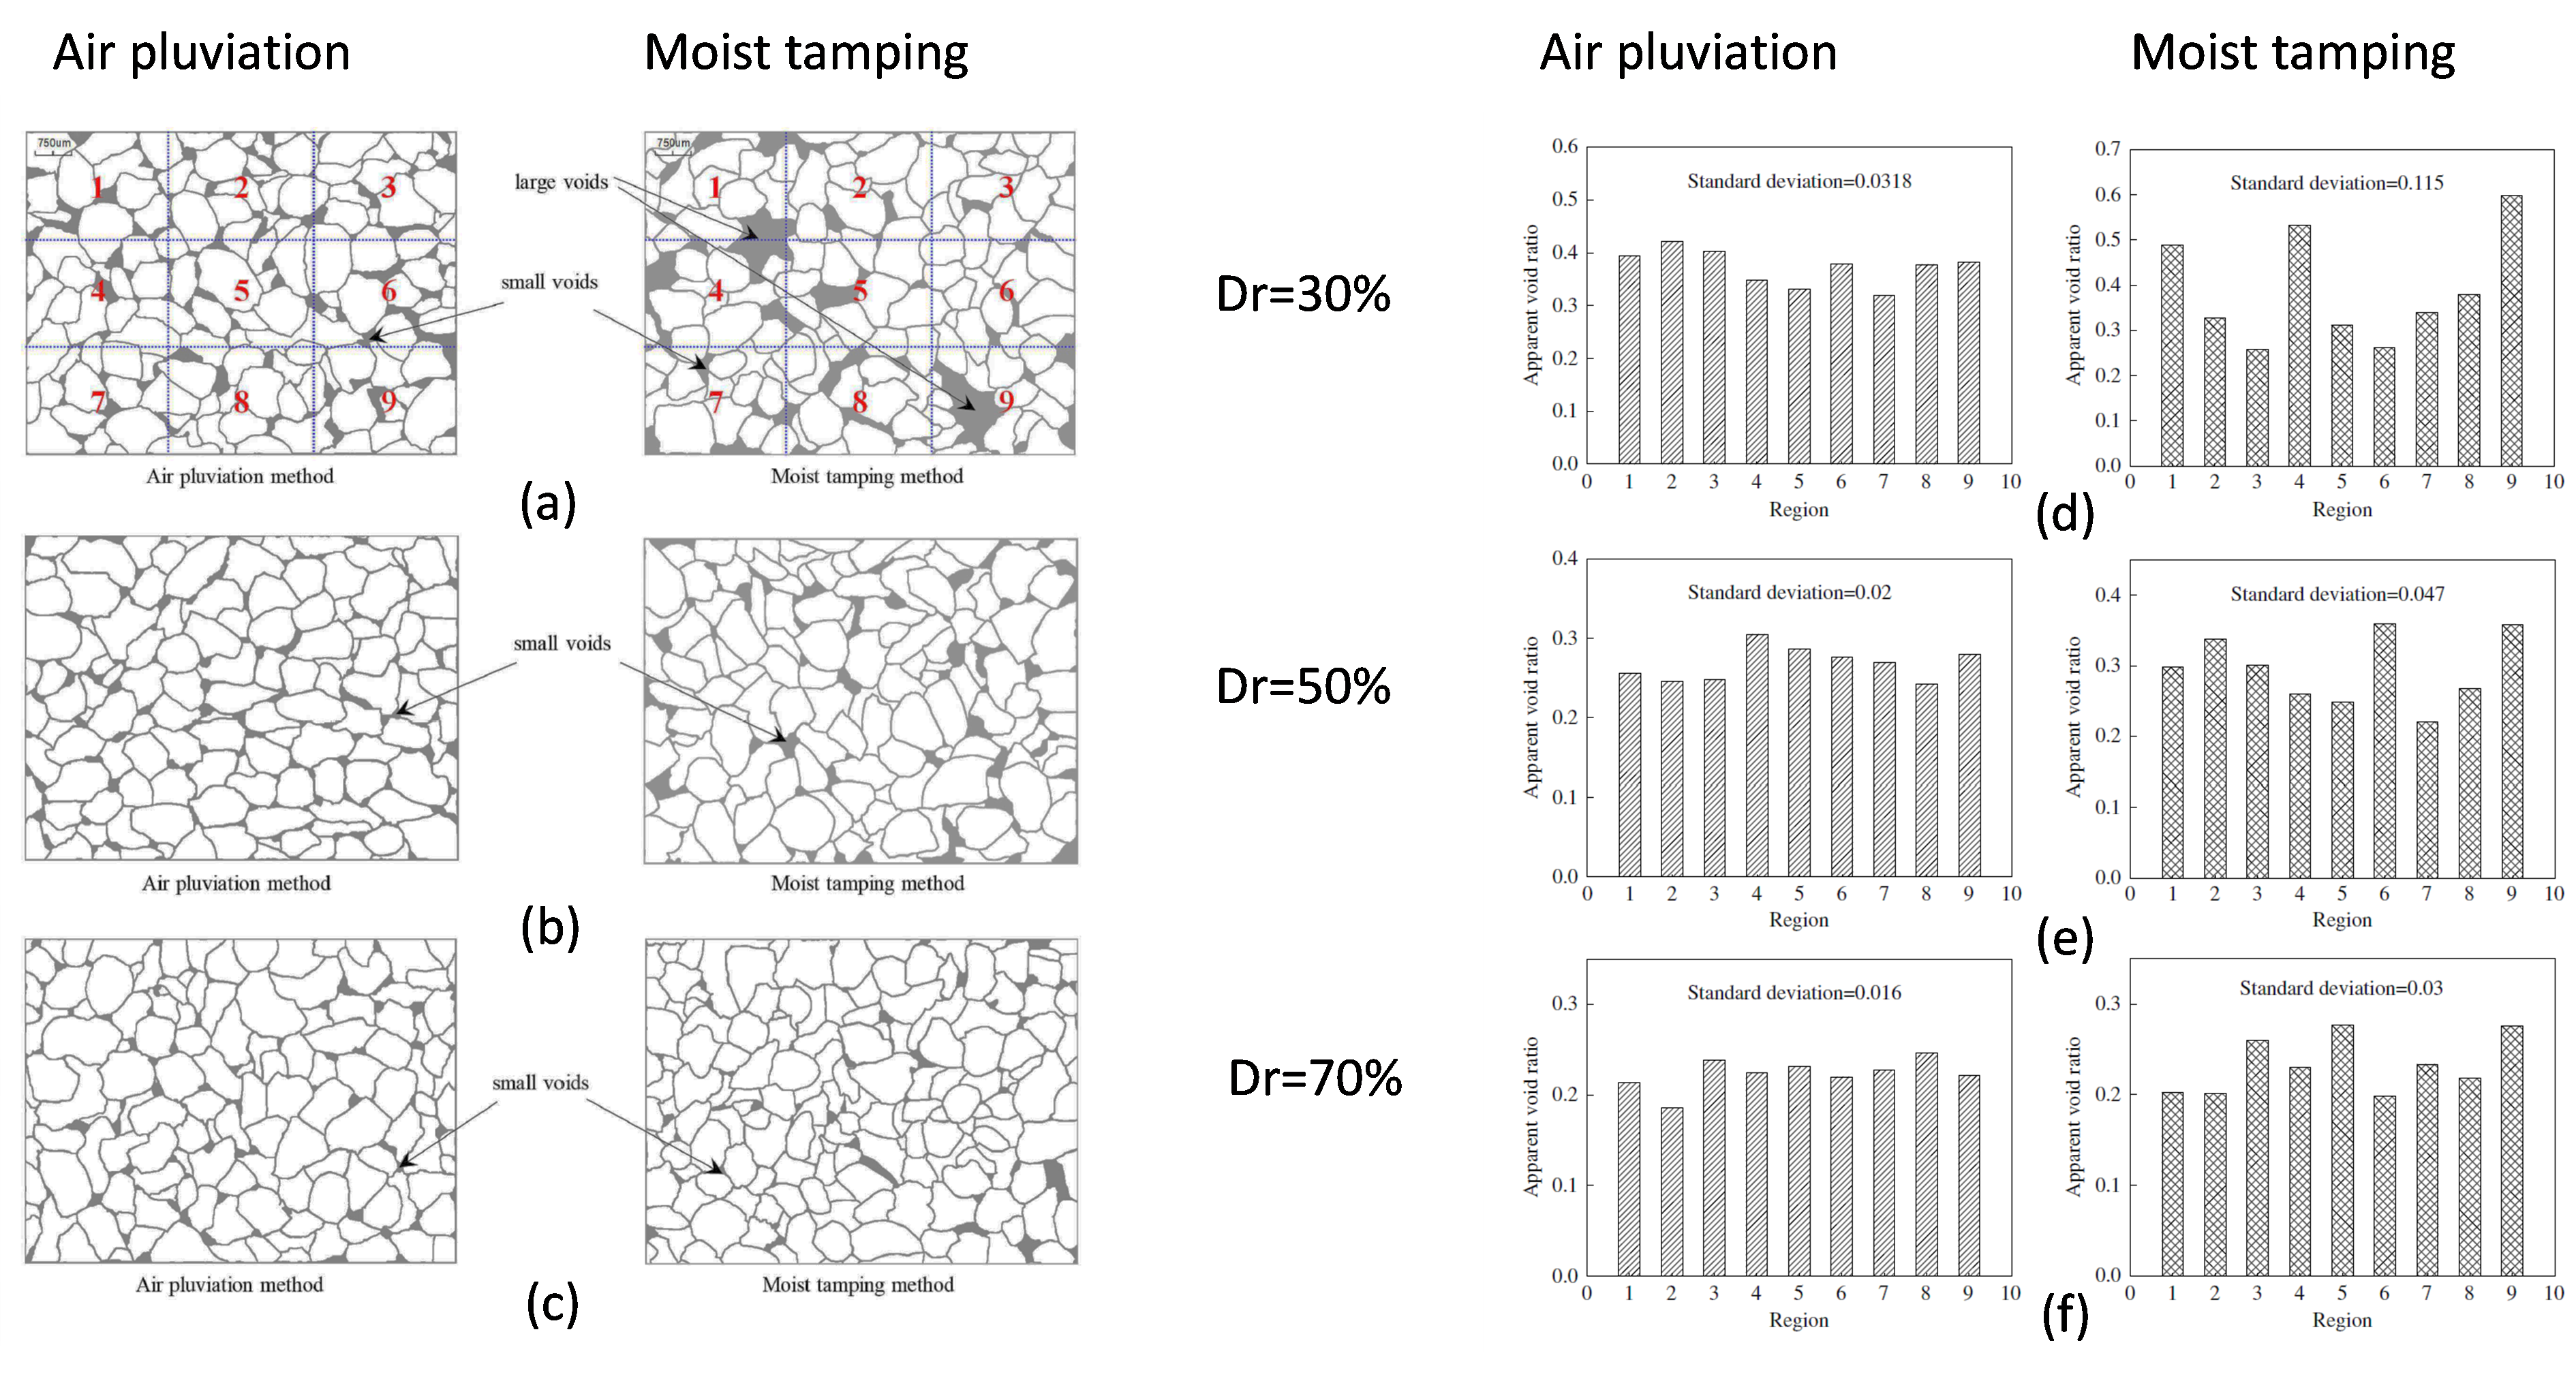
The large spatial variation in local void ratio in moist tamped samples and the presence of macrovoids at low relative densities, are confirmed by Ni et al. (2021), who compared the fabris of most tamped and air pluviated samples of Toyoura sand at different relative densities (Figure 40). The more uniform distribution of voids in the air pluviated samples at all relative densities is consistent with the findings of Jang & Frost (1998).
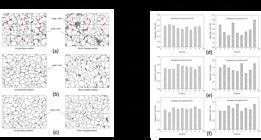
Moist tamped and air pluviated samples of Toyoura sand at different relative densities: (a), (b) and (c) zoning for investigating apparent local void ratio; (d), (e) and (f) apparent local void ratio distributions at different regions. Modified from Ni et al. (2021).
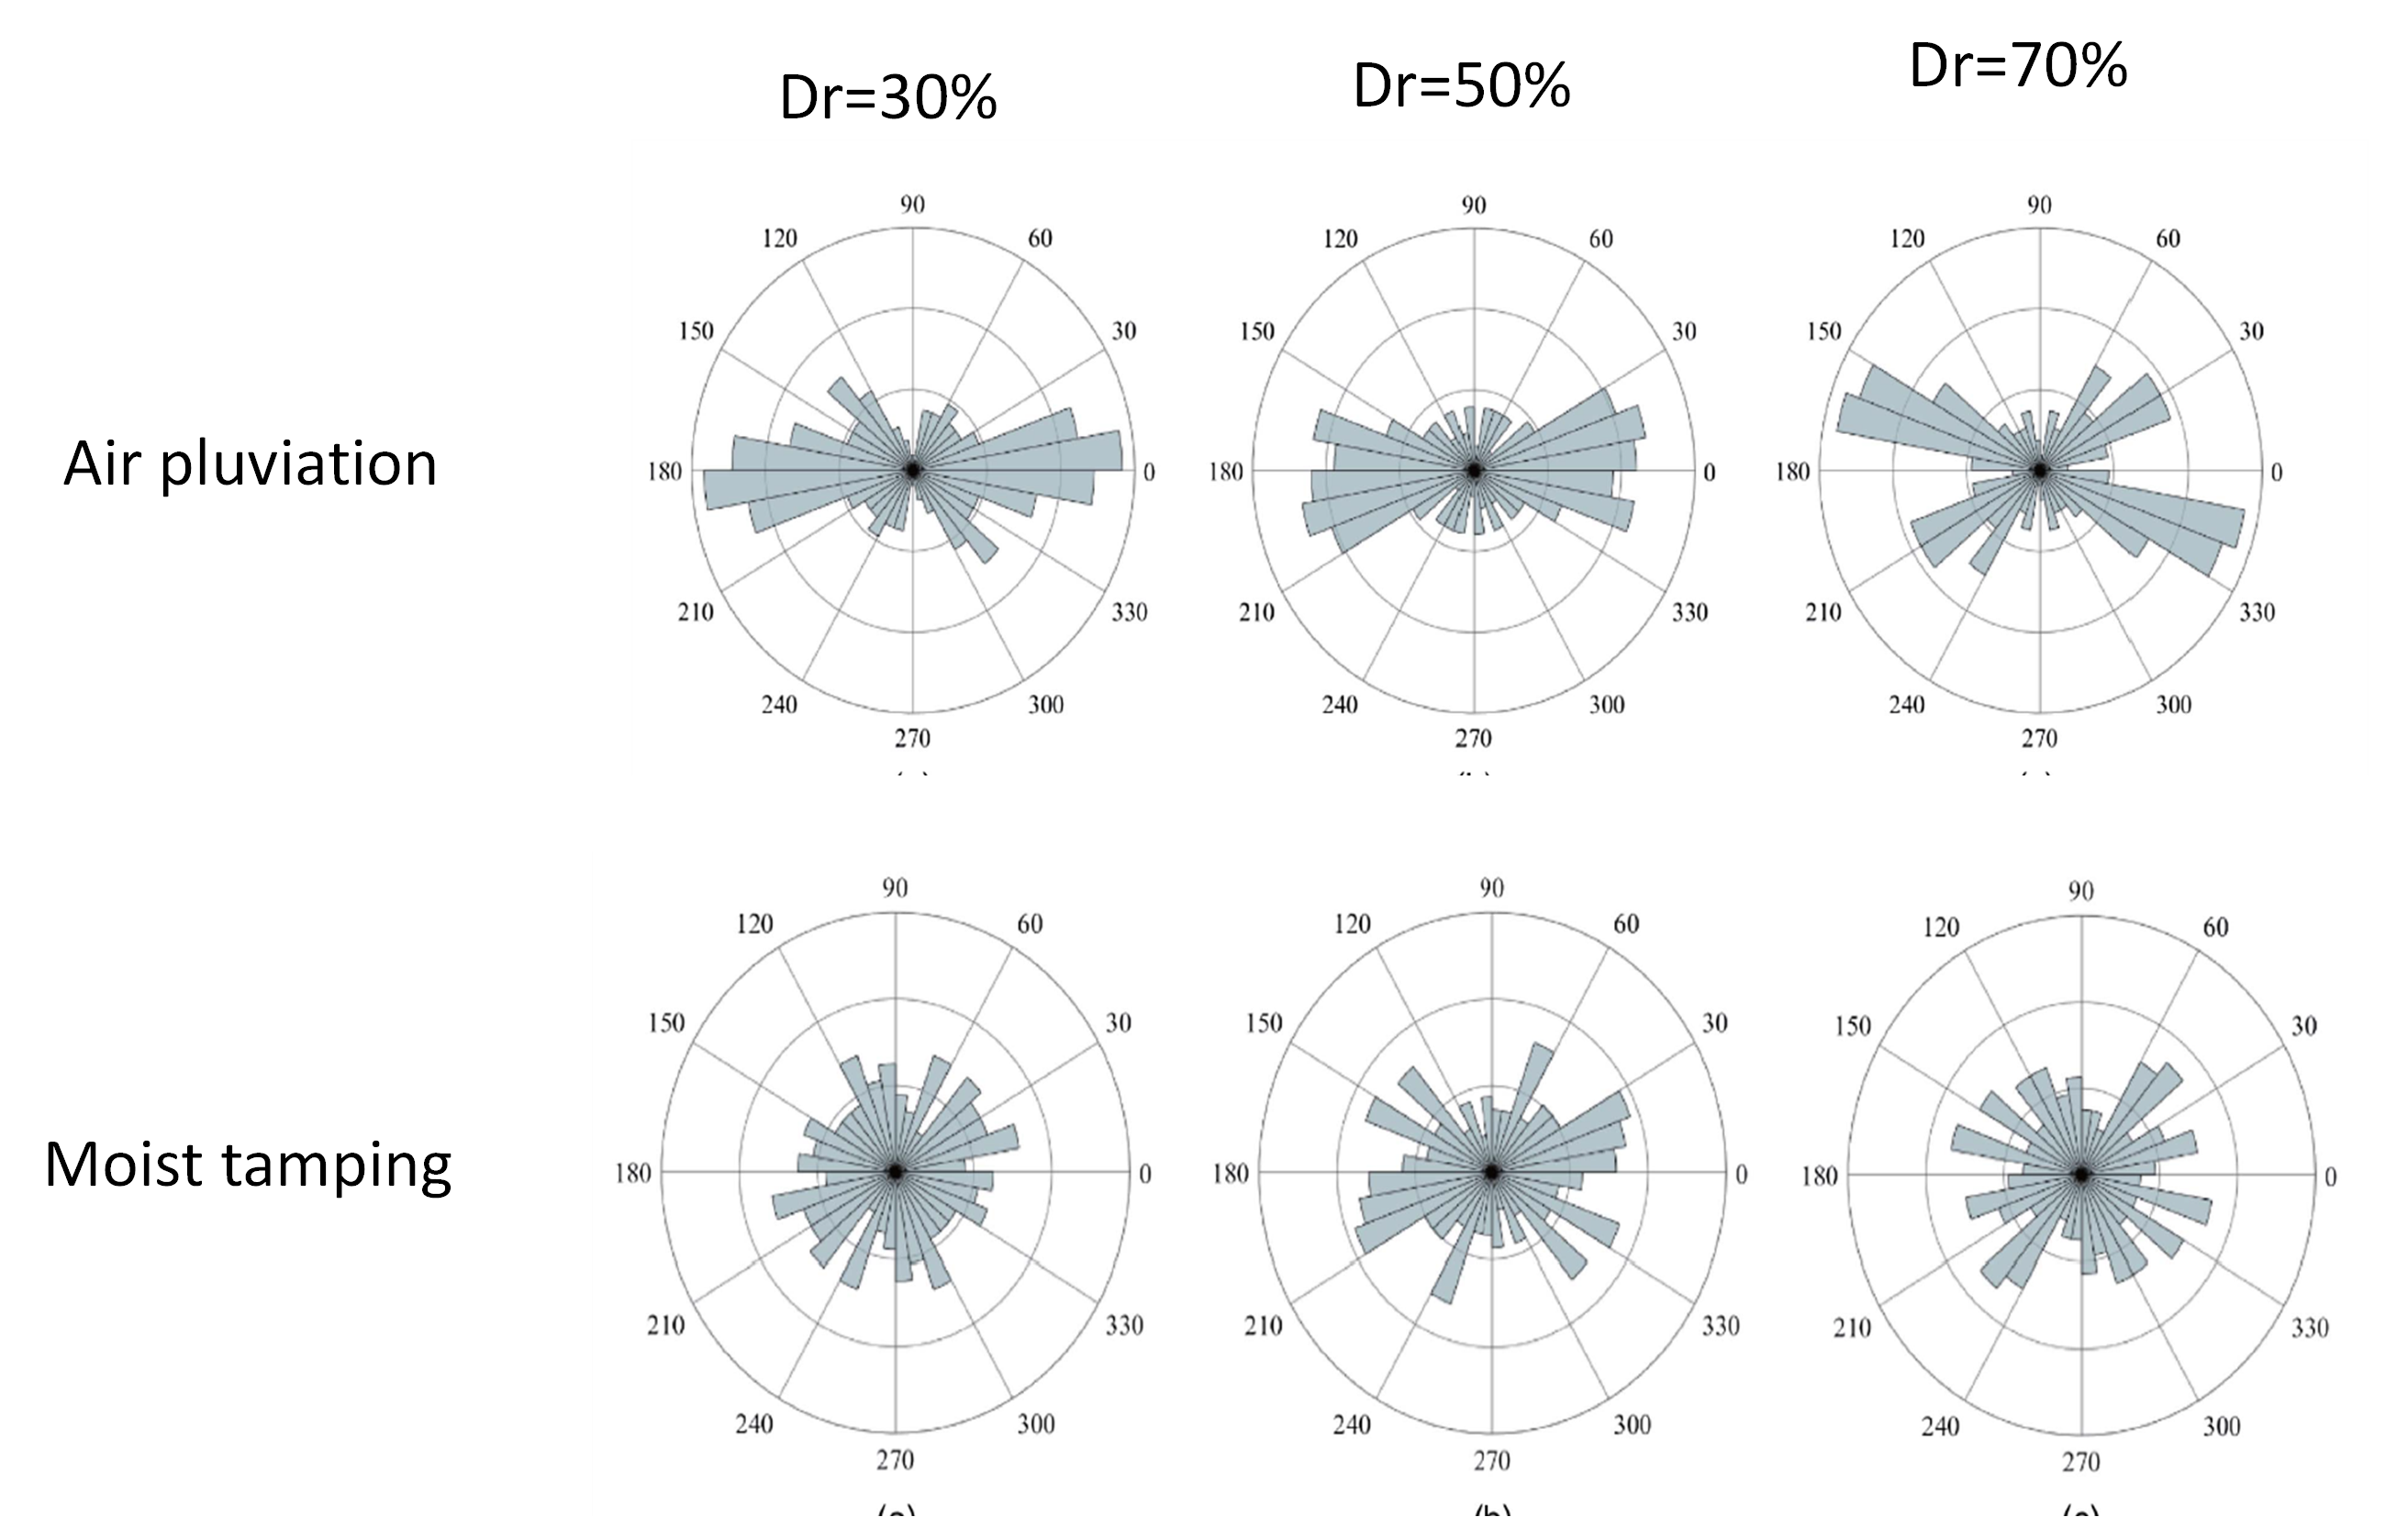
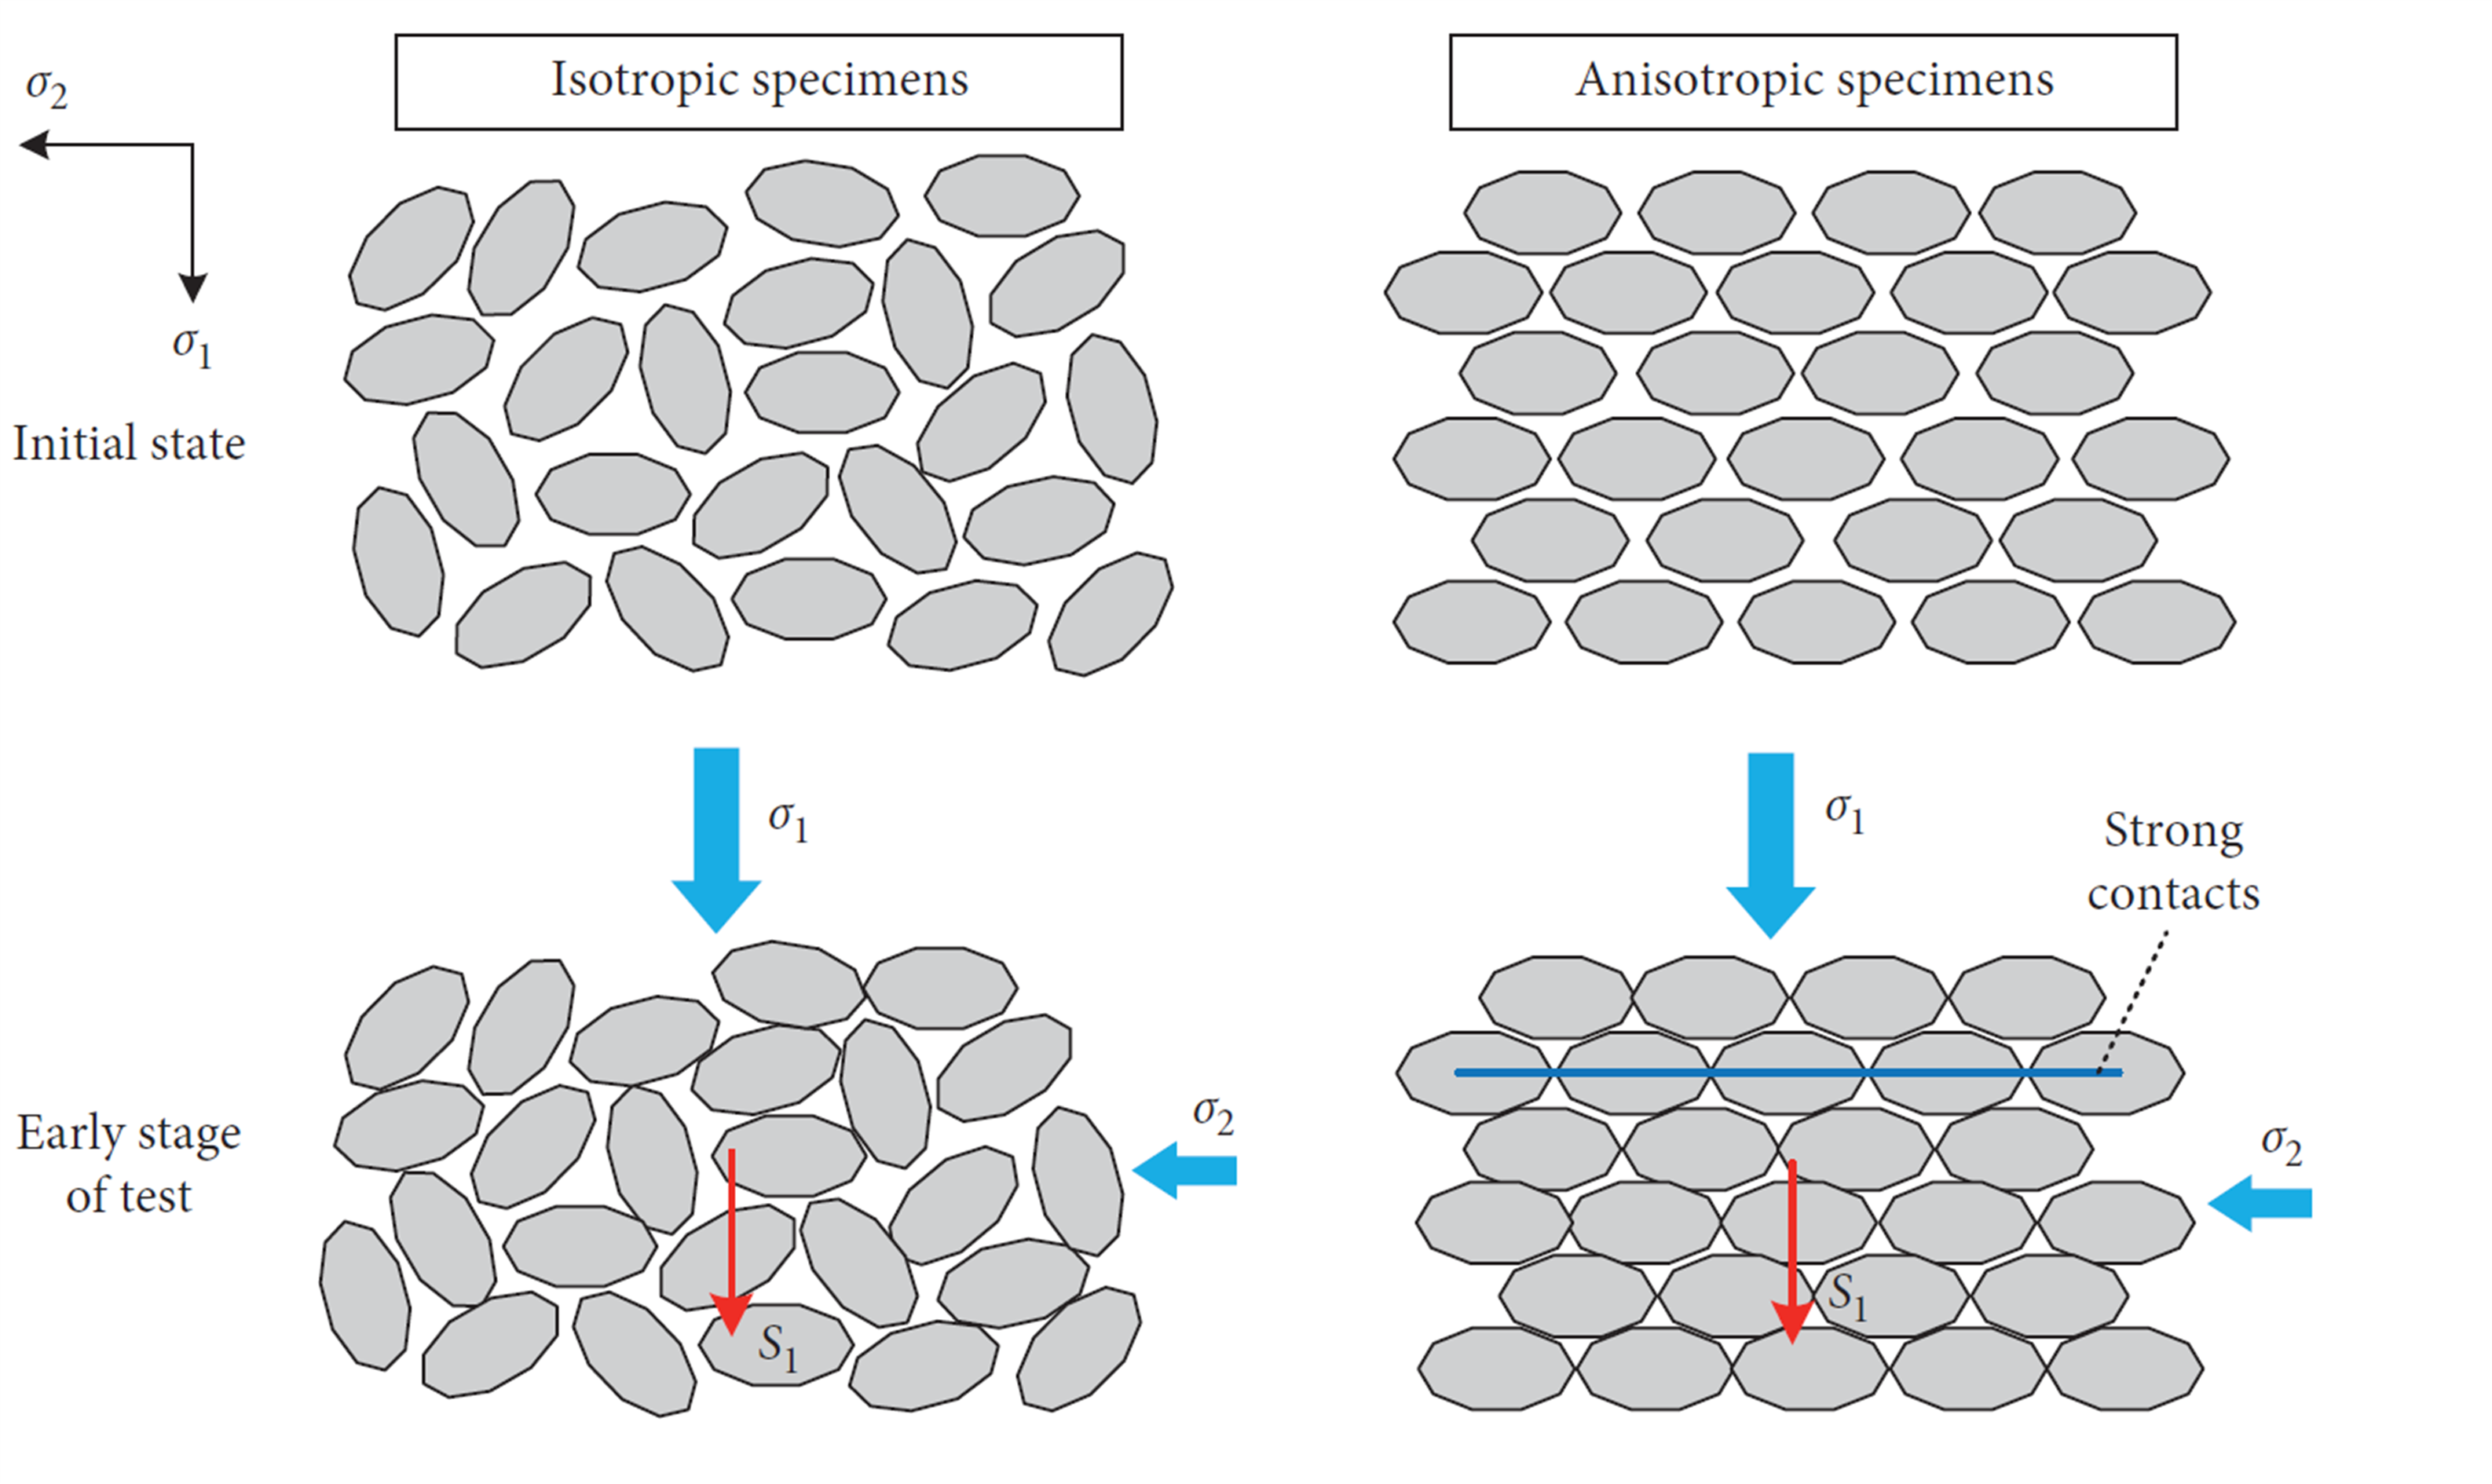
Ni et al. noted that the long axis direction of the particles was distributed isotropically in the moist tamped samples at all relative densities but in the air pluviated samples the dominant particle orientations were anisotropic and varied with relative density, see Figure 41. The oriented particles in the inherently anisotropic specimens form strong contacts in their long axis direction and so provide a support frame in the early stages of shearing, which restrains the contraction of the specimens (Figure 42; Chen et al., 2020 ). Anisotropy of fabric in the air pluviated sample explains its resistance to continuing vertical loading and why it does not contract while the moist tamped sample does (Figure 36).

Particle orientation in moist tamped and air pluviated samples of Toyoura sand. Modified from Ni et al. (2021).
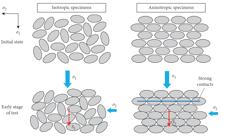
Isotropic and anisotropic packing. The oriented particles in anisotropic specimens form strong contacts in their long axis direction and provide a support frame in the early stages of shearing, which restrains the contraction of the specimens. Modified from Chen et al. (2020).
8.4 Expansive partial drainage and a potential role in the chain reaction and its rate of propagation
The concept of expansive drainage appears to originate from the comments of Peters (1991), quoted by Lade (1999), as “[…] even dilating sand may become unstable: If a rate of volumetric expansion were imposed on an element of granular material and this rate exceeded the rate of expansion exhibited by the material, then the effective confining pressure would decrease and the element would become unable to sustain the current, applied shear stress. Thus, a rate of volume change (whether positive, zero, or negative) imposed on a material element could cause it to become unstable depending on the rate of volume change exhibited by the soil itself (compression or dilation)”.
These comments are consistent with findings from strain path testing reported by Chu et al. (1993, 2003). In strain path testing, volume expansion can be imposed on a specimen to simulate the process of forced water infiltration into a soil element. This appears to be referred to as expansive drainage, or more correctly expansive partial drainage. Under expansive partial drainage, as opposed to contractive partial drainage, water inflow may contribute to the development of excess pore-water pressure which is additional to any shear-induced pore pressure and can result in a more onerous condition than undrained loading.
Lashkari & Yaghtin (2018) state: “It is a common belief that soil behaviour under any possible stress path in a triaxial apparatus is bounded by the behaviours found under undrained and fully drained triaxial (i.e. CU and CD) tests as extremes for shear strength and volume change behaviours. However, that hypothesis may only be valid when soil is homogeneous and pore-water pressure is uniformly distributed across the soil element. The load-carrying structure of real soils and the earthquake induced excess pore-water pressure are generally heterogeneous and thus this presumption is questionable”.
Figure 43, from Lashkari & Yaghtin (2018) capture the hierarchy of strengths and behaviours, including that for expansive partial drainage.
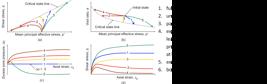
Schematic illustration of various patterns of loose sand behaviour in triaxial compression: (a) shear stress plotted against mean principal effective stress; (b) void ratio plotted against mean principal effective stress; (c) excess pore water pressure plotted against axial strain; (d) shear stress plotted against axial strain. Modified from Sivathayalan & Logeswaran (2008) and Lashkari & Yaghtin (2018).
Expansive partial drainage would appear to be able to contribute to the spread of a local collapse and possibly contribute to its rate of propagation of tailings dam failures and other flows.
8.5 Chain reaction at specimen and field scale
The speculative chain reaction inside the moist tamped specimen, with its large spatial distribution of local void ratio and the presence of macrovoids, is no more than a scaled-down version of the spread of instability in a slope with a large region of potentially unstable soil, described by Lade (1999): “The slope is perfectly stable as long as the soil remains drained. An undrained perturbation initiates instability. Once a local zone of instability has been created, the resulting pore pressure buildup will propagate and enlarge the unstable region in the slope. The instability initiated in the potentially unstable region is self-sustaining, i.e. the material is not dependent on any further outside perturbations, and it consequently exhibits unconditional, run-away instability”.
Instability under undrained conditions is more likely in a slope where conditions are load maintained, so collapse or crossing the instability surface can occur under global, and even local, undrained conditions.
9. Final thoughts on moist tamped versus sedimented samples
Samples prepared by moist tamping (wet tamping) are often tested when investigating the behaviour of sands and sands with fines, and, as we learnt from Reid & Fanni (2022), when characterising tailings. Why does the use of moist tamped specimens continue to be used to investigate the behaviour of hydraulically-placed soils such as tailings, when water-sedimented specimens provide a much better match of fabric?
Clustering in moist tamped samples results in non-uniform void distribution and the exaggerated presence of macrovoids. As a result, the collapse potential is also exaggerated and localisation and collapse can occur in triaxial compression. The relevant void ratio at critical state is uncertain.
Sedimented clean sands do not generally show a potential to collapse when tested in triaxial compression but show a marked anisotropy of collapse potential when sheared after or during rotation of the principal stress directions away from the vertical, as in hollow cylinder tests, referred to earlier. This anisotropy of instability results from the preferred vertical orientation of contact normals during deposition and the development of vertical load carrying columns during overburden loading which bypass the macrovoids, until principal stresses are rotated sufficiently from the vertical.
The fact that specimens prepared by sedimentation do not show collapse in undrained triaxial compression, simply demonstrates the critical importance of anisotropy in instability problems in general.
10. Some final thoughts on fabric, void ratio, heterogeneity, localisation, critical state, and instability
10.1 Fabric and void ratio
Cohesionless soil behaviour is determined by stress state, stress or strain history, stress or strain path, initial and evolving arrangement of particles and pore spaces (fabric including density of packing), and characteristics of the particles, including the range of particle sizes and their shapes and strengths.
Excluding residual soils, the arrangement of the particles and void spaces at the time of formation of a soil is determined by the form, rate and environment of deposition, the particle size distribution and the characteristics of the particles being deposited.
The forms and environments of deposition include those that occur naturally, those associated with construction filling, and those involving specimen preparation in the laboratory. Methods of specimen formation in the laboratory may or may not attempt to simulate soil formation in situ.
Fabric changes after formation depend on the initial fabric itself and the post-depositional changes such as stress or strain path, time effects such as creep, and changes in environment that might lead, for example, to cementation.
Void ratio is a measure of density of packing, but like other parameters defining the state of a soil, such as water content, degree of saturation, density, it is at best an average value. Global void ratio is only a part of a complete description of the fabric of a soil. The arrangement or fabric of relevance includes the distribution and location of the different particle sizes, the orientation of particles and aggregates and their contacts, distribution and shape of void spaces, for each particle the number of contacts with supporting and non-supporting particles, and the presence of discontinuities. Much attention has be paid to the quantification of soil fabric in the last 25 years.
The importance of the spatial distribution of local void ratio at high global void ratios, and the presence of macrovoids, have been illustrated in the paper and both need to be taken into account when explaining observed behaviour and predicting future behaviour.
Macrovoids can exist in natural or laboratory prepared soils, depending on depositional environment or specimen preparation method. Macrovoids close first during consolidation and collapse first during shear. It has been suggested herein that macrovoids contribute to a chain reaction responsible for the spreading of collapse.
In an under-filled situation, ‘fines’ can lead to the presence of macrovoids, depending on the size disparity of fines and host sand, their shape and their location within the particle arrangement or load carrying framework. Are the fines acting as: fillers of voids, simply reducing void ratio but with little effect, other than on permeability; as stabilisers in the load carrying framework; as disruptors in the framework; all as speculated on by Leroueil and Hight (2003). Because of the dependence on their location, neither void ratio nor relative density can provide satisfactory indications of instability when smaller particles are present within a host sand.
10.2 Heterogeneity and localisation
Many, possibly most, natural and man-made cohesionless soils are not homogeneous. There is heterogeneity of local void ratio, particularly at high global void ratios, and heterogeneity of the load carrying structure. Evolving fabric modifies anisotropy and heterogeneity. Both the initial and stress induced heterogeneities trigger localisation which leads to increased heterogeneity of shear and volume strain, and pore pressure. Localisation can trigger a chain reaction.
There appears to be little information on localisation in cohesionless soils in situ and whether the kinematics of localisation in the field match those in the laboratory tests.
10.3 Critical state
The attraction of critical state is that at large strains it is considered that the effects of stress history and initial fabric are obliterated, so critical state depends only on current stress state, density of packing (global void ratio) and particle characteristics. As discussed, difficulties arise in practice because of layering, bedding and localisation, and there is uncertainty over the dependence of critical state on stress path, including the effects of b and alpha.
Inherent and evolving spatial variations in local void ratio give rise to uncertainties over the local void ratio determining the critical state, for example the local void ratio in a shear band. This difficulty would appear to be more acute when combining a critical state approach with the use of loose moist tamped samples.
Localisation results in a rate effect on strength at critical state, apparent when comparing load and strain-controlled conditions.
10.4. Instability
An instability approach, determining the variation in inclination of instability lines with void ratio and principal stress direction in sedimented sands and silty sands, would appear to have a key role to play in design and analysis. The zone of potential instability increases with alpha and global void ratio. Reaching the instability surface determines whether flow will or wiil not occur. Identifying this zone is more valuable than attempting to identify post collapse strengths.
The attraction of instability lines is that instability in sedimented sands occurs at small strains, prior to major particle rearrangement and so before phi’ is mobilised and before localisation is dominant.
In design, the aim would be to keep stress states below the local instability zone, as we did at Jamuna. Lade (1999) advised as follows: “Analysis of instability requires determination of the current effective stress states in the slope and recognition of their locations relative to the instability line. Instability can potentially be triggered in any region of the slope in which the stress states are above the instability line. The analysis procedure can only indicate the potential for collapse. A trigger is required to initiate the actual collapse”.
In the zone of potential instability, the soil will be stable if drained conditions are maintained, so the design process requires a risk analysis of potential triggers that will lead to undrained or partially drained conditions.
Acknowledgements
I thank the Brazilian Geotechnical Society (ABMS) and the Portuguese Society (SPG) for the honour of being invited to deliver the Ninth Victor De Mello Lecture. I would also like to thank Luis Guilherme de Mello for his great encouragement throughout the preparation of this paper.
I am particularly grateful to Professor Serge Leroueil for the use of some of his unpublished figures and to him and Professor Chu Jian for many helpful discussions on the topic over the years. Thanks also to Dr Tiago Dias for helping with translations, locating references and assembling the paper.
Though I have never met Professors Lade or Vaid, I appreciate hugely the insights they have provided in their publications on instability and the testing of sands
-
Discussion open until February 28, 2025.
References
-
Al-Raoush, R.I., & Alshibli, K.A. (2006). Distribution of local void ratio in porous media systems from 3D X-ray microtomography images. Physica A, 361(2), 441-456. http://doi.org/10.1016/j.physa.2005.05.043
» http://doi.org/10.1016/j.physa.2005.05.043 - Alshibli, K., Druckrey, A.M., Jarrar, M., & Al-Raoush, R.I. (2015). 3D experimental characterization of particle rotation and local dilatancy in angular sand. In V. A. Rinaldi, M. E. Zeballos & J. J. Clariá (Eds.), Deformation Characteristics of Geomaterials: Proceedings of the 6th International Symposium on Deformation Characteristics of Geomaterials. Amsterdam: IOS Press.
-
Andò, E., Dijkstra, J., Roubin, E., Dano, C., & Boller, E. (2019). A peek into the origin of creep in sand. Granular Matter, 21(1), 11. http://doi.org/10.1007/s10035-018-0863-5
» http://doi.org/10.1007/s10035-018-0863-5 - Barreto, D. (2009). Numerical and experimental investigation into the behaviour of granular materials under generalised stress states [Doctoral thesis]. Imperial College of Science, Technology and Medicine, University of London, London.
-
Benahmed, N., Canou, J., & Dupla, J.C. (2004). Structure initiale et propriétés de liquéfaction statique d’un sable. Comptes Rendus. Mécanique, 332(11), 887-894. http://doi.org/10.1016/j.crme.2004.07.009
» http://doi.org/10.1016/j.crme.2004.07.009 - Bjerrum, L., Kringstad, S. & Kummeneje, O. (1961). The shear strength of a fine sand. In 5th International Conference on Soil Mechanics and Foundation Engineering (Norwegian Geotechnical Institute Publication, No. 45). Paris.
-
Cao, J., Roy, N., & Frost, J.D. (2020). Relating shear-induced evolution in topology of pore networks to sand specimen response. Géotechnique Letters, 10(2), 277-283. http://doi.org/10.1680/jgele.18.00222
» http://doi.org/10.1680/jgele.18.00222 -
Carrasco, S., Cantor, D., Ovalle, C., & Quiroz-Rojo, P. (2023). Shear strength of angular granular materials with size and shape polydispersity. Open Geomechanics, 4, 1-14. http://doi.org/10.5802/ogeo.15
» http://doi.org/10.5802/ogeo.15 -
Carrera, A., Coop, M., & Lancellotta, R. (2011). Influence of grading on the mechanical behaviour of stava tailings. Geotechnique, 61(11), 935-946. http://doi.org/10.1680/geot.9.P.009
» http://doi.org/10.1680/geot.9.P.009 - Chen, X., Qian, J., Zhang, L., & Ling, J. (2020). Investigating the combined effects of inherent and stress-Induced anisotropy on the mechanical behavior of granular materials using three-dime.sional Discrete Element Method. Mathematical Problems in Engineering, 10, 7841824.
-
Chu, J., & Wanatowski, D. (2008). Instability conditions of loose sand in plane-strain. Journal of Geotechnical and Geoenvironmental Engineering, 134(1), 136-142. http://doi.org/10.1061/(ASCE)1090-0241(2008)134:1(136)
» http://doi.org/10.1061/(ASCE)1090-0241(2008)134:1(136) -
Chu, J., & Wanatowski, D. (2009). Effect of loading mode on strain softening and instability behavior of sand in plane-strain tests. Journal of Geotechnical and Geoenvironmental Engineering, 135(1), 108-120. http://doi.org/10.1061/(ASCE)1090-0241(2009)135:1(108)
» http://doi.org/10.1061/(ASCE)1090-0241(2009)135:1(108) -
Chu, J., Leroueil, S., & Leong, W.K. (2003). Unstable behaviour of sand and its implication for slope stability. Canadian Geotechnical Journal, 40(5), 873-885. http://doi.org/10.1139/t03-039
» http://doi.org/10.1139/t03-039 -
Chu, J., Lo, S.C.R., & Lee, I.K. (1993). Instability of granular soils under strain path testing. Journal of Geotechnical Engineering, 119(5), 874-892. http://doi.org/10.1061/(ASCE)0733-9410(1993)119:5(874)
» http://doi.org/10.1061/(ASCE)0733-9410(1993)119:5(874) - De Mello, V.M. (1980). XIII Seminário Nacional de Grandes Barragens (Vol. VIII, pp. 101-123). Rio de Janeiro: CIGB-ICOLD.
-
Desrues, J., Chambon, R., Mokni, M., & Mazerolle, F. (1996). Void ratio evolution inside shear bands in triaxial sand specimens studied by computed tomography. Geotechnique, 46(3), 529-546. http://doi.org/10.1680/geot.1996.46.3.529
» http://doi.org/10.1680/geot.1996.46.3.529 -
Desrues, J., Ando’, E., Mevoli, F.A., Debove, L., & Viggiani, G. (2018). How does strain localise in standard triaxial tests on sand: revisiting the mechanism 20 years on. Mechanics Research Communications, 92, 142-146. http://doi.org/10.1016/j.mechrescom.2018.08.007
» http://doi.org/10.1016/j.mechrescom.2018.08.007 - Dobry, R., & Ng, T.T. (1989). Discrete Modelling of stress-strain behaviour of granular media at small and large strains. In Proceedings of the 1st US Conference on Discrete Element Methods. Golden, CO: CSM Press.
-
Drescher, A., & de Jong, G. (1972). Photoelastic verification of a mechanical model for the flow of a granular material. Journal of the Mechanics and Physics of Solids, 20(5), 337-340. http://doi.org/10.1016/0022-5096(72)90029-4
» http://doi.org/10.1016/0022-5096(72)90029-4 -
Farhang, B., & Mirghasemi, A.A. (2017). A study of principal stress rotation on granular soils using DEM simulation of hollow cylinder test. Advanced Powder Technology, 28(9), 2052-2064. http://doi.org/10.1016/j.apt.2017.05.011
» http://doi.org/10.1016/j.apt.2017.05.011 -
Garcia, F.E., Ando, E., Viggiani, G., & Sitar, N. (2024). Influence of depositional fabric on mechanical properties of naturally deposited sands. Geotechnique, 74(3), 250-264. http://doi.org/10.1680/jgeot.21.00230
» http://doi.org/10.1680/jgeot.21.00230 -
Ishihara, K., Tatsuoka, F., & Yasuda, S. (1975). Undrained deformation and liquefaction of sand under cyclic stresses. Soil and Foundation, 15(1), 29-44. http://doi.org/10.3208/sandf1972.15.29
» http://doi.org/10.3208/sandf1972.15.29 -
Iverson, R.M., & Denlinger, R.P. (2001). Flow of variably fluidized granular masses across three-dimensional terrain: 1. Coulomb mixture theory. Journal of Geophysical Research, 106(B1), 537-552. http://doi.org/10.1029/2000JB900329
» http://doi.org/10.1029/2000JB900329 - Jang, D.-J., & Frost, J.D. (1998). Sand structure differences resulting from specimen preparation procedures. In Proceedings of the ASCE Specialty Conference on Geotechnical Earthquake Engineering and Soil Dynamics (Vol. 1, pp. 234-245), Seattle, USA.
-
Lade, P.V. (1993). Initiation of static instability in the submarine Nerlerk Berm. Canadian Geotechnical Journal, 30(6), 895-904. http://doi.org/10.1139/t93-088
» http://doi.org/10.1139/t93-088 - Lade, P.V. (1999) Instability of granular materials. In P. V. Lade (Ed.), Physics and mechanics of soil liquefaction (pp. 3-18). Rotterdam: Balkema.
-
Lashkari, A., & Yaghtin, M.S. (2018). Sand flow liquefaction instability under shear-volume coupled strain paths. Geotechnique, 68(11), 1002-1024. http://doi.org/10.1680/jgeot.17.P.164
» http://doi.org/10.1680/jgeot.17.P.164 - Leroueil, S., & Hight, D.W. 2003. Behaviour and properties of natural soils and soft rocks. In Proceedings of the International Workshop on Characterisation and Engineering Properties of Natural Soils (Vol. 1, pp. 29-254), Singapore. Rotterdam: Balkema.
- Leroueil, S., Chu, J., & Wanatowski, D. 2009. Slope instability due to pore water pressure increase. In Proceedings of the 1st Italian Workshop on Landslides: Rainfall-Induced Landslides (Vol. 1, pp. 81-90), Naples.
- Leroueil, S., Hight, D.W., & Locat, J. (2024). Discussion of ‘Analysis of the micro to macro response of clays to compression’, by Guglielmi et al. (2024). Geotechnique, 74(2), 134-154.
- Li, B., Zhang, F., & Gutierrez, M. (2015). A numerical examination of the hollow cylindrical torsional shear test using DEM. Acta Geotechnica, 10, 449-467.
-
Nakata, Y., Hyodo, M., Murata, H., & Yasufuku, N. (1998). Flow deformation of sands subjected to principal stress rotation. Soil and Foundation, 38(2), 115-128. http://doi.org/10.3208/sandf.38.2_115
» http://doi.org/10.3208/sandf.38.2_115 -
Nguyen, H.B.K., Rahman, M.M., & Fourie, A.B. (2017). Undrained behaviour of granular material and the role of fabric in isotropic and K0 consolidations: DEM approach. Geotechnique, 67(2), 153-167. http://doi.org/10.1680/jgeot.15.P.234
» http://doi.org/10.1680/jgeot.15.P.234 -
Ni, X., Ye, B., Zhang, F., & Feng, X. (2021). Influence of specimen preparation on the liquefaction behaviors of sand and its mesoscopic explanation. Journal of Geotechnical and Geoenvironmental Engineering, 147(2), 04020161. http://doi.org/10.1061/(ASCE)GT.1943-5606.0002456
» http://doi.org/10.1061/(ASCE)GT.1943-5606.0002456 -
O’Sullivan, C., Wadee, M.A., Hanley, K.J., & Barreto, D. (2013). Use of DEM and elastic stability analysis to explain the influence of the intermediate principal stress on shear strength. Geotechnique, 63(15), 1298-1309. http://doi.org/10.1680/geot.12.P.153
» http://doi.org/10.1680/geot.12.P.153 -
Oda, M. (1972). Initial fabrics and their relations to mechanical properties of granular material. Soil and Foundation, 12(1), 17-36. http://doi.org/10.3208/sandf1960.12.17
» http://doi.org/10.3208/sandf1960.12.17 -
Oda, M., & Konishi, J. (1974). Microscopic deformation mechanism of granular material in simple shear. Soil and Foundation, 14(4), 25-38. http://doi.org/10.3208/sandf1972.14.4_25
» http://doi.org/10.3208/sandf1972.14.4_25 - Pan, J.-H., Pinzón, G., Wang, R., Andò, E., Viggiani, G., & Zhang, J.-M. (2023). Lessons learned from matching 3D DEM and experiments at macro, meso and fabric scales for triaxial compression tests on lentils. Journal of the Mechanics and Physics of Solids, 183(3), 105494.
- Peters, J.F. (1991). Discussion of ‘Instability of granular materials with nonassociated flow’. Journal of Engineering Mechanics, 114(12), 934.
-
Reid, D., & Fanni, R. (2022). A comparison of intact and reconstituted samples of a silt tailings. Geotechnique, 72(2), 176-188. http://doi.org/10.1680/jgeot.20.P.020
» http://doi.org/10.1680/jgeot.20.P.020 -
Saada, A.S., Liang, L., Figueroa, J.L., & Cope, C.T. (1999). Bifurcation and shear band propagation in sands. Geotechnique, 49(3), 367-385. http://doi.org/10.1680/geot.1999.49.3.367
» http://doi.org/10.1680/geot.1999.49.3.367 -
Salvatore, E., Modoni, G., Ando, E., Albano, M., & Viggiani, G. (2017). Determination of the critical state of granular materials with triaxial tests. Soil and Foundation, 57(5), 733-744. http://doi.org/10.1016/j.sandf.2017.08.005
» http://doi.org/10.1016/j.sandf.2017.08.005 - Sandroni, S.S. (1975). The strength of London Clay in total and effective stress terms [Doctoral thesis]. Imperial College, University of London, London.
- Santamarina, J.C., & Cho, G.C. (2003). The omnipresence of localizations in particulate materials. In Proceedings of the 3rd International Symposium on the Deformation Characteristics of Geomaterials (pp. 465-473), Lyon.
- Shibuya, S. (1985). Undrained behaviour of granular materials under principal stress rotation [Doctoral thesis]. Imperial College, University of London, London.
-
Sivathayalan, S., & Logeswaran, P. (2008). Experimental assessment of the response of sands under shear-volume coupled deformation. Canadian Geotechnical Journal, 45(9), 1310-1323. http://doi.org/10.1139/T08-068
» http://doi.org/10.1139/T08-068 -
Sladen, J.A., D’Hollander, R.D., & Krahn, J. (1985b). The liquefaction of sands, a collapse surface approach. Canadian Geotechnical Journal, 22(4), 564-578. http://doi.org/10.1139/t85-076
» http://doi.org/10.1139/t85-076 -
Sladen, J.A., D’Hollander, R.D., Krahn, J., & Mitchell, D.E. (1985a). Back analysis of the Nerlerk berm liquefaction slides. Canadian Geotechnical Journal, 22(4), 579-588. http://doi.org/10.1139/t85-077
» http://doi.org/10.1139/t85-077 -
Uthayakumar, M., & Vaid, Y.P. (1998). Static liquefaction of sands under multiaxial loading. Canadian Geotechnical Journal, 35(2), 273-283. http://doi.org/10.1139/t98-007
» http://doi.org/10.1139/t98-007 -
Vaid, Y.P., Chung, E.K.F., & Kuerbis, R.H. (1990). Stress path and steady state. Canadian Geotechnical Journal, 27(1), 1-7. http://doi.org/10.1139/t90-001
» http://doi.org/10.1139/t90-001 - Vaid, Y.P., & Chern, J.C. (1985). Cyclic and monotonic undrained response of saturated sands. In V. Khosla (Ed.), Advances in the art of testing soils under cyclic conditions (pp. 120-147). ASCE.
-
Vaid, Y.P., Sivathayalan, S., & Stedman, D. (1999). Influence of specimen reconstitution method on the undrained response of sand. Geotechnical Testing Journal, 22(3), 187-195. http://doi.org/10.1520/GTJ11110J
» http://doi.org/10.1520/GTJ11110J - Vaid, Y.P., Uthayakumar, M., Sivathayalan, S., Robertson, P.K., & Hofmann, B. (1995). Laboratory testing of Syncrude sand. In Proceedings of the 48th Canadian Geotechnical Conference (Vol. 1, pp. 223-232), Vancouver.
-
Verdugo, R., & Ishihara, K. (1996). The steady state of sandy soils. Soil and Foundation, 36(2), 81-91. http://doi.org/10.3208/sandf.36.2_81
» http://doi.org/10.3208/sandf.36.2_81 - Verdugo, R. (1992). Characterization of sandy soil behavior under large deformation [Doctoral thesis]. University of Tokyo.
-
Wang, R., Fu, P., Zhang, J.M., & Dafalias, Y.F. (2016). DEM study of fabric features governing undrained postliquefaction shear deformation of sand. Acta Geotechnica, 11(6), 1321-1337. http://doi.org/10.1007/s11440-016-0499-8
» http://doi.org/10.1007/s11440-016-0499-8 -
Yamada, S., Okada, M., Nakano, M., & Noda, T. (2023). Experimental study on sand anisotropy using hollow cylinder apparatus. Soil and Foundation, 63(3), 101326. http://doi.org/10.1016/j.sandf.2023.101326
» http://doi.org/10.1016/j.sandf.2023.101326 -
Yang, J., & Dai, B.B. (2011). Is the quasi-steady state a real behaviour? A micromechanical perspective. Geotechnique, 61(2), 175-183. http://doi.org/10.1680/geot.8.P.129
» http://doi.org/10.1680/geot.8.P.129 -
Yoshimine, M., & Koike, R. (2005). Liquefaction of clean sand with stratified structure due to segregation of particle size. Jiban Kogakkai Ronbun Hokokushu, 45(4), 89-98. http://doi.org/10.3208/sandf.45.4_89
» http://doi.org/10.3208/sandf.45.4_89 -
Yoshimine, M., Ishihara, K., & Vargas, V. (1998). Effects of principal stress direction and intermediate principal stress on undrained shear behaviour of sand. Soil and Foundation, 38(3), 179-188. http://doi.org/10.3208/sandf.38.3_179
» http://doi.org/10.3208/sandf.38.3_179 -
Zhao, J., & Guo, N. (2013). Unique critical state characteristics in granular media considering fabric anisotropy. Geotechnique, 63(8), 695-704. http://doi.org/10.1680/geot.12.P.040
» http://doi.org/10.1680/geot.12.P.040