 Annual Assessment of Theoretical Wind and Wave Energy Potentials and their Complementarity for the Southwestern Region of the South Atlantic
Abstract
The world energy matrix has oil and its derivatives as its main raw material. Brazil, on the other hand, stands out in generating electricity from renewable sources, mainly hydroelectric plants. However, recent and successive water crises have been reducing electricity generation from those plants. Therefore, to diversify and expand the use of renewables, it is necessary to study other renewable energy sources available in the country. The objective of this study is to quantify, using the Fifth ECMWF Global Reanalysis (ERA5), the theoretical wind and wave potentials and their complementarity in potential energy. The study region covers the Southwest Region of the South Atlantic Ocean, including the Brazilian coast of the Southeast and South Regions, within the Exclusive Economic Zone. Hourly ERA5 data were used for the period 1991-2020. To calculate the magnitude of the winds at 100 m above the surface, the Logarithmic Profile Law was used, and the results showed that, in the long-term mean, the South Region, on the coast between the states of Santa Catarina and Rio Grande do Sul (30°-34°S, 45°-53°W), has the greatest wind energy potential. The analysis of the theoretical wave energy potential showed that the South Region has the greatest potential. Finally, the Wave Power Density values found were higher than the minimum limits determined (𝑃 = 5 kW/m), indicating that the wave resource showed a substantially greater capacity to complement wind-resource intermittency than the reverse. Wind generation, on the other hand, showed a low capacity to complement wave generation, with almost zero across the entire study region. It is important to emphasize the pioneering nature of this study in exploring the complementarity between wind and wave energy, based on resource availability thresholds, along the southeastern and southern Brazilian coasts.
Keywords:
Offshore wind-wave complementarity; Southeast and South regions of Brazil; ERA5
Resumo
A matriz energética mundial tem como principal matéria-prima o petróleo e seus derivados. Entretanto, o Brasil se destaca na geração de energia elétrica a partir de fontes renováveis, principalmente as hidrelétricas. No entanto, crises hídricas sucessivas têm reduzido a capacidade das hidrelétricas de gerar energia. Dessa forma, ao se aspirar a uma diversificação na matriz energética e, consequentemente, na matriz elétrica, é necessário estudar outras fontes de energia renovável disponíveis no país. O objetivo deste estudo é, por meio da reanálise ERA5, quantificar os potenciais teóricos eólico e de ondas e sua possível complementaridade energética. A região de estudo abrange a Região Sudoeste do Oceano Atlântico Sul, incluindo o litoral brasileiro das Regiões Sudeste e Sul, no âmbito da Zona Econômica Exclusiva. Foram utilizados dados com resolução temporal horária no período de 1991 a 2020. Para o cálculo da magnitude dos ventos a 100 m acima da superfície, utilizou-se a Lei do Perfil Logarítmico, e os resultados mostraram que, anualmente, a Região Sul, no litoral entre os estados de Santa Catarina e Rio Grande do Sul (30°-34°S, 045°-055°W), possui o maior potencial energético proveniente dos ventos. A análise do potencial teórico das ondas mostrou que a Região Sul possui o maior potencial energético proveniente delas. Por fim, os valores máximos de Densidade de Potência das Ondas encontrados foram superiores aos limiares mínimos determinados (𝑃 = 5 kW/m), observando-se que a geração de energia a partir das ondas é sempre capaz de complementar a geração de energia eólica. A geração eólica, por outro lado, mostrou baixa capacidade de complementar a geração de ondas, quase nula em toda a região de estudo. É importante enfatizar o caráter pioneiro deste estudo na investigação da complementaridade entre as fontes de energia eólica e de onda, com base em limiares de disponibilidade dos recursos ao longo da costa do Sudeste e do Sul do Brasil.
Palavras-chave:
Complementaridade offshore vento-ondas; Regiões Sudeste e Sul do Brasil; ERA5
1 Introduction
Studies on renewable energy have gained increasing attention in recent years. This is largely due to the possible shortage of oil and its derivatives, the main raw material in the global energy matrix (30.9%) according to the International Energy Agency (IEA, 2021) and in Brazil (35.1%) according to the National Energy Balance (EPE, 2024). Another reason is climate change, driven by anthropogenic activities that increase greenhouse gas emissions.
In Brazil, more renewable resources are used in the energy matrix than in the rest of the world. In 2023, 49.1% of the country's energy came from renewable sources, with an emphasis on sugarcane biomass (16.9%), hydropower (12.1%), and wind energy (2.6%). In terms of electricity generation from renewable resources, the electricity matrix is mostly composed of hydroelectric plants, accounting for 58.9%, with other sources totaling 89.2% in 2021 (EPE, 2024).
However, the country suffers from successive water crises that affect hydroelectric production, which depends on the precipitation regime in the river basins. In years of low rainfall, thermoelectric plants are used as alternatives, increasing both the final cost of electricity and greenhouse gas emissions.
In this context, diversification of the Brazilian energy matrix, and consequently of the electricity matrix, through other renewable resources becomes essential. Furthermore, using these resources would reduce greenhouse gas emissions, thereby mitigating climate change. In addition to greater access to energy in remote regions, energy security would be guaranteed, and decarbonization goals would be met.
According to Dos Reis, Mazetto, and Da Silva (2021), along the Brazilian coast, where bathymetry is up to 50 meters deep, the Southeast and South regions stand out for their strong offshore wind potential. However, the natural climate variability of renewable sources is one of the biggest problems in electricity generation. Therefore, through energy complementarity, electricity production that was previously quite variable becomes more predictable. Several studies on complementarity have been carried out between intermittent energy sources in Brazil (Beluco, De Souza & Krenzinger 2008; Molnár, Camargo & Ramos 2015; Silva et al. 2016; Cantão et al. 2017; Rosa et al. 2017; Rosa 2019; Nascimento 2022; Nascimento et al. 2022). One metric traditionally used to assess the complementarity of two or more renewable energy sources is based on estimates of each source's variability and intermittency. This is the approach used in the present study.
Most studies carried out over the ocean along the Brazilian coast address the complementarity between wind and solar energy. It is important to emphasize the pioneering nature of the proposed study, which evaluates the complementarity between wind and wave energy using resource-availability thresholds in the southwestern region of the South Atlantic.
In situ meteorological and oceanographic measurements in oceanic regions adjacent to the Brazilian coast are limited for carrying out a thorough analysis of the behavior of atmospheric and oceanic variables. Thus, the use of global climatological datasets emerges as an alternative for assessing the country's offshore renewable energy potential. Studies in the Southeast and South regions of Brazil compare the performance of the European Centre for Medium-Range Weather Forecasts Reanalysis version 5 (ERA5) in representing winds (Tavares 2020; Fernandes et al. 2021; Paiva, Kampel & Camayo 2021; Oliveira de Carvalho 2022) and waves (Eguchi & Albino 2022; Eguchi & Klumb-Oliveira 2023), both in relation to in situ observations and in relation to other reanalyses.
This study aims to quantify the theoretical offshore wind and wave potentials and analyze their possible complementarity using the ERA5 dataset in the Southwest Region of the South Atlantic Ocean (SAO), including the Brazilian coast of the Southeast and South Regions, within the Exclusive Economic Zone (EEZ).
2 Methodology and Data
This section presents in detail the methodology used to assess the proposed renewable energy potentials. This methodology is based on data from ERA5. Figure 1 shows the methodological flowchart applied in this study.
Initially, the region of interest was defined as the southwest region of the SAO, including the Brazilian coastline of the Southeast and South Regions, within the EEZ domain. In addition, the period under study was defined as 1991 to 2020. In the second stage, after defining the initial conditions, the data were obtained from the ERA5 database, and the wind magnitude was calculated at a height of 100 m above the surface. In the third stage, with all the necessary variables in hand, the climatology of wind direction and magnitude at a height of 100 m was estimated. Based on the estimated climatology, the theoretical offshore wind and wave potentials in the study region were finally quantified and evaluated. Finally, with the theoretical energy potentials mentioned, it was possible to evaluate the complementarity between offshore wind and wave natural resources.

2.1 Study Region
As shown in Figure 2, the study region is located over the southwest of the SAO (18°-34°S, 36°-55°W), comprising the Brazilian coast of the Southeast Region, including the coast of the states of Espírito Santo, Rio de Janeiro and São Paulo, between latitudes 18°20’ and 25°18’S, and South Region, including the coast of Paraná, Santa Catarina and Rio Grande do Sul, between latitudes 25°18’ and 33°44’S, within the EEZ domain. According to Dos Reis, Mazetto, and Da Silva (2021), these two regions are closest to the country's main energy-consuming centers.

Study Region. Exclusive Economic Zone (Black solid lines) and Bathymetry (Colored solid lines) [m]. State abbreviations: ES, Espírito Santo; RJ, Rio de Janeiro; SP, São Paulo; PR, Paraná; SC, Santa Catarina; RS, Rio Grande do Sul.
2.2 ERA5 Reanalysis Datasets
The ERA5 reanalysis has temporal coverage from 1940 to the present and an hourly frequency for atmospheric, terrestrial, and oceanic variables (Hersbach et al., 2018). The characteristics of the ERA5 dataset considered in this research for the period from January 1, 1991, to December 31, 2020 (30 years) were an atmospheric (oceanic) horizontal resolution of 0.25° latitude x 0.25° longitude (0.5° x 0.5°), and hourly temporal resolution. Wind and wave energy quantities were first calculated at the hourly time step. Long-term mean fields for the 1991-2020 period were then obtained for the climatological analyses, whereas energy complementarity was evaluated directly from the hourly time series.
2.3 Wind Estimation
To estimate offshore wind direction and magnitude at 100 m above the surface, hourly ERA5 zonal (𝑢10) and meridional (𝑣10) wind components at 10 m were used. Then, the wind speed at 10 m was calculated from the horizontal wind components, and subsequently extrapolated to 100 m using the Logarithmic Wind Profile Law, as described in Section 2.3.1.
2.3.1 Calculation of Wind Magnitude at 100 m
According to Silva et al. (2016), in offshore wind energy applications, the properties of the winds at the height of the wind turbine rotor are of interest, which are typically between 70 and 100 m, varying according to the equipment configuration.
According to Barboza et al. (2020), the Logarithmic Profile Law (Pimenta, Kempton & Garvine 2008; Silva, Cataldi & Dragaud 2016; Silva et al. 2016; Tavares 2020; Barboza et al. 2020; Nascimento 2022) considers the neutral stability of the atmosphere, in addition to using the surface roughness coefficient, taken as a standard value.
It should be noted that the authors claim that this parameterization represents errors in estimating the friction speed that, in turn, propagate to errors in estimating the wind speed at different heights.
However, the Logarithmic Profile Law provides a simplified model that facilitates implementation, enabling calculation of wind variation in layers near the Earth's surface, where soil resistance and roughness are critical factors in wind dynamics.
With this parameterization, reliable estimates can be obtained without complex atmospheric models, relying only on parameters such as wind speed at a reference height, the height of interest, and surface roughness.
Therefore, in this study, we used the Logarithmic Profile Law (Equation 1) to calculate the wind speed at 100 m above the surface.
Where, 𝑣 (𝑍) = Wind Speed at Desired Height; 𝑣ref = Wind Speed at Reference Height (𝑍); 𝑍 = Desired Height (𝑍 = 100 m); 𝑍ref = Reference Height (𝑍 = 10 m); 𝑍∗ = Surface Roughness Coefficient (𝑍∗ = 0.2 mm).
2.4 Assessment of Theoretical Offshore Wind Potential
The calculation of Wind Energy Density (WED) represents the flow of kinetic energy of the winds per unit area. The result is a theoretical measure for analyzing the wind energy generation capacity for a given region at a given height. In other words, WED represents the Theoretical Wind Potential.
WED was calculated at 100 m from the surface (Equation 2), considering the value of air density (𝜌) of approximately 1.225 kg/m3 (Pimenta, Kempton & Garvine 2008; Silva et al. 2016; Tavares 2020; Nascimento 2022).
Where, WED = Wind Energy Density (W/m2); 𝜌 = Air Density (𝜌 = 1.225 kg/m3); 𝑣 (𝑍) = Wind Speed at Desired Height (m/s).
WED was calculated independently at each hourly time step from the estimated 100 m wind speed. The long-term mean WED field presented in this study was subsequently obtained by averaging the hourly WED values over the 1991-2020 period.
2.5 Assessment of the Theoretical Wave Potential
For the theoretical wave potential, the following variables from the ERA database were used:
● Significant Wave Height (𝐻s) [m] from the combination of wind waves and swells; and
● Average wave period (𝑇m) [s].
The calculation of the Wave Power Density (𝑃) represents the available wave energy flux (Zheng et al. 2015). The result is the theoretical measure used to analyze the wave energy generation capacity of a given region. In other words, 𝑃 represents the Theoretical Wave Potential.
𝑃 was calculated using Equation 3, considering the value of the sea density (𝜌) of approximately 1025 kg/m3 (Zheng et al. 2015; Shadman et al. 2019).
Where, 𝑃 = Wave Power Density (kW/m); 𝜌 = Seawater Density (𝜌 = 1025 kg/m3); 𝑔 = Acceleration of gravity (𝑔 = 9.806 m/s2); 𝐻 = Significant Wave Height from the combination of wind waves and swells (m); and 𝑇m = Mean wave period (s).
As for WED, P was computed at the hourly time step and subsequently averaged over 1991-2020 to obtain the long-term mean field.
2.6 Energy Complementarity between Offshore Wind and Wave Natural Resources
Energy complementarity guarantees a stable, efficient, and sustainable supply by combining different sources to optimize the electrical system. This strategy increases energy security, reduces costs, and favors the efficient use of natural resources. Furthermore, it facilitates access to energy in isolated regions and strengthens distributed generation, making the system more reliable and economical.
In this study, the objective was to estimate the complementarity among renewable natural resources based on their availability by identifying the periods when the theoretical offshore wind and wave potentials equal or exceed an adopted threshold.
This methodology was used by authors such as Kardakaris, Boufidi, and Soukissian (2021), Onea and Rusu (2022), Nascimento (2022), and Nascimento et al. (2022).
To jointly consider the theoretical potential and their long-term persistence, minimum thresholds were determined for the operation of the wind turbine and the plant powered by wave motion.
To assess the availability of the wind resource, the lower limit adopted was WEDmin = 210 W/m², equivalent to the power generated by the wind at 100 m height with a speed of 7 m/s (Musial et al. 2016). To assess the availability of the wave resource, 𝑃min = 5 kW/m was considered (Kardakaris, Boufidi & Soukissian 2021; Onea & Rusu 2022).
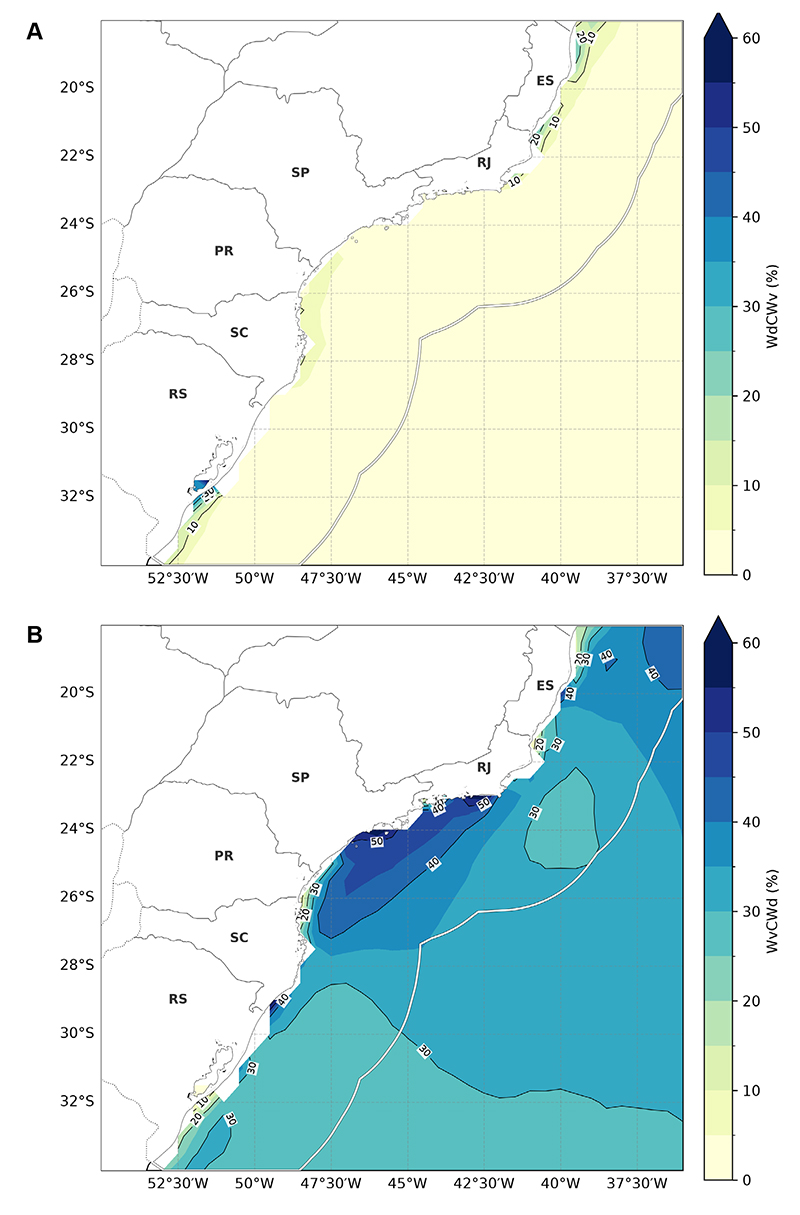
The wave power generation complemented by wind power generation, called in this study WdCWv (Wind Complements Wave) [%], is calculated by the ratio between the number of hours in which WED≥ WEDmin and P < 𝑃min and the total number of hours of the analyzed period (Equation 4).
Similarly, it is possible to obtain the percentage of hours in which wave energy generation complements wind generation, called in this research WvCWd (Wave Complements Wind) [%], calculated from the ratio between the number of hours in which WED< WEDmin and P ≥ ??min and the total number of hours in the analyzed period (Equation 5).
WdCWv (WvCWd) ranges from 0 to 100%, with 100% indicating that the wind (wave) resource is above its adopted availability threshold during all valid hourly time steps in which the wave (wind) resource is below its threshold.
Where WdCWv = Complementarity of the wind resource in wave energy generation (%); WvCWd = Complementarity of the wave resource in wind energy generation (%); and TNH = Total number of hours in the analyzed period (h).
It is worth mentioning that for the complementarity analysis, the hourly WED field, originally defined on the atmospheric grid, was linearly interpolated onto the wave-data grid.
Thus, from WdCWv and WvCWd, it will be possible to understand the behavior of a hybrid generation, with greater fidelity, the intermittency characteristics of winds and waves across different time scales.
3 Results
3.1 Climatology of Winds over the Southwest Region of the South Atlantic Ocean
The large-scale atmospheric circulation over the South Atlantic is influenced by the South Atlantic Subtropical High (SASH), whose climatological center is located around 30°S in the central-eastern South Atlantic, with its position varying seasonally (Reboita et al. 2019). Consistent with this anticyclonic circulation, the long-term mean 100 m streamline field over the study region shows predominantly northeasterly (NE) winds (Figure 3).
Figure 3 also shows a clear spatial gradient in the long-term mean wind speed within the study region, with weaker winds along the central portion of the Brazilian coast and progressively stronger winds toward the offshore and southern regions.
Furthermore, in the Southeast Region, a region of high wind speed stands out in the mean wind field relative to its surroundings, with a nucleus located north of the state of Rio de Janeiro (RJ) and south of Espírito Santo (ES) (21°S-26°S, 38°W-42°W), where annual mean wind speeds exceed 8.0 m/s.
In the South Region, another region of high wind speed stands out in relation to its surroundings, with a nucleus along the coast between the states of Santa Catarina (SC) and Rio Grande do Sul (RS) (30°S-34°S, 45°W-55°W), which extends through the SAO, with wind speed values above 9.0 m/s.
It is worth noting that in the study region, the lowest mean wind speeds occur between the coasts of Rio de Janeiro and Santa Catarina (22°S-28°S, 40°W-50°W), with values below 7.0 m/s. The minimum wind speed values in this region may be related to the coastal configuration of the continent, which weakens the prevailing northeasterly winds as they penetrate inland over Rio de Janeiro State (Tavares et al. 2020).

Long-term mean (1991-2020) wind field at 100 m. Streamlines are derived from the mean zonal and meridional wind components, while colors represent the mean wind speed.
3.2 Theoretical Wind Energy Potential
As shown in Equation 2, the WED is calculated based on a cubic function of the wind magnitude. Therefore, it is expected that the average fields generated will follow the same spatial pattern as the wind magnitude obtained previously.
Figure 4 shows that long-term mean WED values exceed 400 W/m² off Rio de Janeiro and southern Espírito Santo. While in the region along the coast of Santa Catarina and Rio Grande do Sul, the mean WED is above 550 W/m2, reaching values higher than 750 W/m2 near the region 30°S-34°S, 48°W-51°W.
In conclusion, at a height of 100 m above the surface, the South Region has the greatest wind energy potential, compared to the Southeast Region.

Long-term mean (1991-2020) Wind Energy Density (W/m2) at 100 m from the surface from the ERA5 over the Southwest Region of the South Atlantic Ocean. The black solid line represents the Exclusive Economic Zone.
3.3 Theoretical Wave Energy Potential
In the area that includes the coastal region between the states of Rio Grande do Sul and the south of Santa Catarina (28°-32°S, 45°-50°W), the long-term mean P reaches values greater than 20 kW/m (Figure 5).
According to Carvalho (2010), the annual values of P in this region result from the action of wave systems coming from south and northeast directions. This coincides with the atmospheric circulation pattern in the Southeast and South regions of Brazil, which is under the SASH wind field regime, frequently altered when there is the passage of Subtropical and Extratropical Cyclones and Frontal Systems.
It is noted that, despite the influence of the aforementioned meteorological systems, P propagates from the east and south towards South America due to waves that form in the southern portion of SASH.
In Brazil, the areas that have the most energetic waves are located close to the coasts of the South and Southeast Regions, with annual average wave power density values between 20 and 25 kW/m (Shadman et al. 2019). The maximum values found here coincide with the results of Shadman et al. (2019).
The results found here show maximum P values higher than those presented by Carvalho (2010), who observed an annual average of 15.14 kW/m in this region, using the WAVEWATCH III wave model.
In the area that includes the central coastal region of Santa Catarina to the south of Rio de Janeiro (23°-28°S, 045°-050°W), the long-term mean P reaches values higher than 15 kW/m.
According to Carvalho (2010), the annual P values in this region continue to consist of the sum of waves from the south and northeast directions. However, the author identified a decrease in the annual average of P, with a maximum of 12.73 kW/m. The results found here show maximum P values higher than those presented by the author, but there was also this reduction in the maximum values obtained.
In the area that includes the central coastal region of Rio de Janeiro to Espírito Santo (18°-23°S, 36°-45°W), the maximum P value is greater than 15 kW/m.
According to Carvalho (2010), the annual P values in this region consist of southerly waves. The author identified an increase in the annual average of P, with maximum values of 13.1 to 13.9 kW/m. The results found here continue to present maximum P values higher than those presented by the author, but there was also a slight increase in the maximum values obtained.
In conclusion, in the mean ERA5 field, the South Region is the one that has the greatest energy potential from waves, compared to the Southeast Region, mainly on the coast between the states of Rio Grande do Sul and the south of Santa Catarina. These findings are aligned with the National Energy Plan 2030 (EPE 2007), which showed that, annually, in Brazil, the highest values of average wave energy density are observed on the coast of the South Region.
It is worth noting that the maximum P values close to the coast of the Southern Region could be even higher; however, the continental shelf is wider in this region, as can be seen in Figure 2, resulting in the dissipation of energy before reaching the coast.
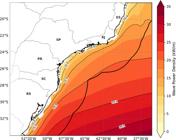
Long-term mean (1991-2020) Wave Power Density (kW/m) from the ERA5 over the Southwest Region of the South Atlantic Ocean. The black solid line represents the Exclusive Economic Zone.
3.4 Complementarity of Wind and Wave Natural Resources over the Southwest Region of the South Atlantic Ocean
According to Figure 6A, WdCWv, that is, the generation of wind energy that complements wave energy, occurs in a very low manner in the Southeast Region, on the coast of Espírito Santo (18°-20°S; 038°-042°W), reaching values above 40%.
This occurs because, over the 1991-2020 period, P reaches values lower than the threshold 𝑃 = 5 kW/m, while WED reaches values equal to or higher than the minimum thresholds determined.
In the regions where maximum WED values were found below the minimum thresholds determined, such as from the coast of Rio de Janeiro to the South Region, WdCWv is close to zero over most of this region, reaching values of approximately 10% in some areas. Since the condition WED≥WEDmin is not respected. These low WdCWv values indicate that periods of insufficient wave resource coinciding with available wind resource are relatively infrequent.
The opposite total complementarity, WvCWd, that is, wave energy generation complementing wind energy, presents much higher values (Figure 6B). The maximum WvCWd values reach values above 50% in the region between the coast of Rio de Janeiro and Santa Catarina. As shown in Figures 4 and 5, although the maximum WED values are lower than WEDmin, the values of P are mostly higher than 𝑃min during this period, respecting the condition P ≥ Pmin.
Overall, WvCWd values are substantially higher than WdCWv values, indicating that the wave resource has a greater capacity to complement periods of insufficient wind resource than the reverse over the analyzed period.

Wind-wave resource complementarity over the 1991-2020 period: (A) Wind Complements Wave (WdCWv) and (B) Wave Complements Wind (WvCWd).
4 Conclusions
This study aims to quantify the theoretical potentials of offshore wind and waves, and to analyze their possible complementarity, using ERA5. Initially, it investigated the behavior of the direction and magnitude of offshore winds at a height of 100 m, in addition to the significant height from the combination of waves and swells and the mean wave period. These variables were then used to estimate the theoretical offshore wind and wave energy potentials. Finally, a possible energy complementarity of offshore wind and wave energy was analyzed by evaluating the theoretical potential of both resources.
The renewable resources mentioned were evaluated through the ERA5 over a period of 30 years (1991-2020), in the Southwest Region of the SAO, including the Brazilian coast of the Southeast and South Regions, within the domain of the EEZ.
Regarding wind potential, this was addressed by considering the wind speed at 100 m above the surface, based on the application of the Logarithmic Profile Law. The mean streamline field shows predominantly northeasterly winds over most of the study region (Figure 3). In the Southeast Region, a region of relatively high wind speed occurs north of Rio de Janeiro and south of Espírito Santo (21°-26°S, 38°-42°W), where long-term mean wind speeds exceed 8.0 m/s. In the South Region, another high wind speed region occurs along the coast of Santa Catarina and Rio Grande do Sul (30°-34°S, 45°-55°W), where values exceed 9.0 m/s. Therefore, the Southern Region has the greatest wind energy potential compared to the Southeast Region.
Regarding wind potential, the calculation of Wind Energy Density (WED) is based on a cubic function of the wind magnitude. Therefore, it is expected that the average fields generated will follow the same spatial pattern as the wind magnitude obtained previously.
The mean WED field shows values above 400 W/m² off Rio de Janeiro and southern Espírito Santo. Along the coast of Santa Catarina and Rio Grande do Sul, WED exceeds 550 W/m² and reaches values above 750 W/m² near 30°-34°S and 48°-51°W. Therefore, the South Region has greater wind energy potential than the Southeast Region.
The analysis of the theoretical potential of waves showed that the South Region has the greatest energy potential, compared to the Southeast Region, particularly along the coast between Rio Grande do Sul and southern Santa Catarina, where values exceed 20 kW/m. In the central coastal region extending from Santa Catarina to southern Rio de Janeiro, the mean P is greater than 15 kW/m. The maximum P values in the region could be higher, but the broad continental shelf dissipates part of the energy before reaching the coast, as shown in Figure 5. In the area that encompasses the central coastal region from Rio de Janeiro to Espírito Santo, the maximum P is greater than 15 kW/m.
Finally, although the mean WED values are lower than the minimum thresholds determined (WED = 210 W/m²) in regions such as the north of Espírito Santo and the region between the coast of Rio de Janeiro and Santa Catarina, the Wave Power Density (P) values are mostly higher (𝑃 = 5 kW/m).
It is observed that the wave resource showed a substantially greater capacity to complement wind resource intermittency than the reverse.
Despite the results obtained, some limitations should be considered in future assessments. The spatial resolution of ERA5 may limit the representation of local atmospheric and oceanographic processes, particularly in coastal regions. Based on this, the use of data with greater spatial resolution could contribute to the understanding of complementarity. In addition, the Logarithmic Profile Law was used to estimate wind speed at 100 m, which may introduce uncertainties associated with this parameterization. Wave resource availability was also assessed using a minimum wave power density threshold of Pmin = 5 kW/m, based on previous studies conducted in European seas. Therefore, the applicability of this threshold to the Brazilian coast should be further investigated.
5 References
-
Barboza, D.V., Teixeira, M.A., Cataldi, M. & Meiriño, M.J. 2020, ‘Avaliação da Geração Eólica como Alternativa ao Descomissionamento de Plataformas Petrolíferas Fixas nos Mares Brasileiros’, Anuário do Instituto de Geociências, vol. 43, no. 3, pp. 455-466, DOI: 10.11137/2020_3_455_466.
» https://doi.org/10.11137/2020_3_455_466 -
Beluco, A., de Souza, P.K. & Krenzinger, A. 2008, ‘A dimensionless index evaluating the time complementarity between solar and hydraulic energies’, Renewable Energy, vol. 33, no. 10, pp. 2157-2165, DOI: 10.1016/j.renene.2008.01.019.
» https://doi.org/10.1016/j.renene.2008.01.019 -
Cantão, M.P., Bessa, M.R., Bettega, R., Detzel, D.H.M. & Lima, J.M. 2017, ‘Evaluation of hydro-wind complementarity in the Brazilian territory by means of correlation maps’, Renewable Energy, vol. 101, pp. 1215-1225, DOI: 10.1016/j.renene.2016.10.012.
» https://doi.org/10.1016/j.renene.2016.10.012 - Carvalho, J.T. 2010, ‘Simulação da distribuição de energia das ondas oceânicas ao largo do litoral brasileiro’, Master dissertation, Curso de Pós-Graduação em Meteorologia, Instituto Nacional de Pesquisas Espaciais, São José dos Campos, 169 p.
-
Eguchi, B. & Albino, J. 2022, ‘Metodologia para determinação do grau de exposição às ondas utilizando energia de ondas e respostas de perfis praiais, aplicada ao litoral sul do Espírito Santo’, Pesquisas em Geociências, vol. 49, no. 2, e115485, DOI: 10.22456/1807-9806.115485.
» https://doi.org/10.22456/1807-9806.115485 -
Eguchi, B.M.M. & Klumb-Oliveira, L.A. 2023, ‘Clima de ondas de tempestades na costa brasileira utilizando 41 anos de dados da reanálise ECMWF ERA5’, Revista Brasileira de Climatologia, vol. 32, pp. 544-565, DOI: 10.55761/abclima.v32i19.16156.
» https://doi.org/10.55761/abclima.v32i19.16156 -
EPE - Empresa de Pesquisa Energética 2007, Plano Nacional de Energia 2030, Empresa de Pesquisa Energética, Rio de Janeiro, viewed 12 Sep. 2022, 2022, https://www.epe.gov.br/pt/publicacoes-dados-abertos/publicacoes/Plano-Nacional-de-Energia-PNE-2030
» https://www.epe.gov.br/pt/publicacoes-dados-abertos/publicacoes/Plano-Nacional-de-Energia-PNE-2030 -
EPE - Empresa de Pesquisa Energética 2024, Balanço Energético Nacional 2024: Ano base 2023, Empresa de Pesquisa Energética, Rio de Janeiro , viewed 07 Jul. 2022, 2022, https://www.epe.gov.br/pt/publicacoes-dados-abertos/publicacoes/balanco-energetico-nacional-2024
» https://www.epe.gov.br/pt/publicacoes-dados-abertos/publicacoes/balanco-energetico-nacional-2024 -
Fernandes, I.G., Pimenta, F.M., Saavedra, O.R. & Silva, A.R. 2021, ‘Offshore validation of ERA5 reanalysis with hub height wind observations of Brazil’, Proceedings of 2021 IEEE PES Innovative Smart Grid Technologies Conference - Latin America (ISGT Latin America), Lima, Peru, pp. 1-5, DOI: 10.1109/ISGTLatinAmerica52371.2021.9542993.
» https://doi.org/10.1109/ISGTLatinAmerica52371.2021.9542993 -
Gunturu, U.B. & Schlosser, C.A. 2012, ‘Characterization of wind power resource in the United States’, Atmospheric Chemistry and Physics, vol. 12, pp. 9687-9702, DOI: 10.5194/acp-12-9687-2012.
» https://doi.org/10.5194/acp-12-9687-2012 -
Hersbach, H., de Rosnay, P., Bell, B., Schepers, D., Simmons, A., Soci, C., ... & Zuo., H 2018, ‘Operational global reanalysis: progress, future directions and synergies with NWP’, ERA Report Series, no. 27, European Centre for Medium-Range Weather Forecasts (ECMWF), DOI: 10.21957/tkic6g3wm.
» https://doi.org/10.21957/tkic6g3wm -
IEA - International Energy Agency 2021, ‘Global share of total energy supply by source, 2019’, International Energy Agency, Paris, viewed 11 Aug. 2026, 2026, https://www.iea.org/data-and-statistics/charts/global-share-of-total-energy-supply-by-source-2019
» https://www.iea.org/data-and-statistics/charts/global-share-of-total-energy-supply-by-source-2019 -
Kardakaris, K., Boufidi, I. & Soukissian, T. 2021, ‘Offshore wind and wave energy complementarity in the Greek Seas based on ERA5 data’, Atmosphere, vol. 12, no. 10, 1360, DOI: 10.3390/atmos12101360.
» https://doi.org/10.3390/atmos12101360 -
Molnár, P., Camargo, L.A.S. & Ramos, D.S. 2015, ‘Applying copulas functions for wind and hydro complementarity evaluation: a Brazilian case’, Proceedings of the 12th International Conference on the European Energy Market (EEM), Lisbon, Portugal, DOI: 10.1109/EEM.2015.7216743.
» https://doi.org/10.1109/EEM.2015.7216743 - Musial, W., Heimiller, D., Beiter, P., Scott, G. & Draxl, C. 2016, 2016 Offshore Wind Energy Resource Assessment for the United States, NREL/TP-5000-66599, National Renewable Energy Laboratory (NREL), Golden, CO, US.
- Nascimento, M.M.S. 2022, ‘Avaliação do potencial energético eólico e solar offshore no Brasil’, Master dissertation, Programa de Pós-Graduação em Meteorologia, UFRJ/IGEO, Rio de Janeiro, 97 p.
-
Nascimento, M.M.S., Shadman, M., Silva, C., de Freitas Assad, L.P., Estefen, S.F. & Landau, L. 2022, ‘Offshore wind and solar complementarity in Brazil: a theoretical and technical potential assessment’, Energy Conversion and Management, vol. 270, 116194, DOI: 10.1016/j.enconman.2022.116194.
» https://doi.org/10.1016/j.enconman.2022.116194 - Oliveira de Carvalho, N. 2022, ‘Avaliação de diferentes conjuntos de dados meteorológicos para caracterização da região da Bacia de Santos’, Master dissertation, Programa de Pós-Graduação em Meteorologia, UFRJ/IGEO, Rio de Janeiro, 108 f.
-
Onea, F. & Rusu, E. 2022, ‘An evaluation of marine renewable energy resources complementarity in the Portuguese nearshore’, Journal of Marine Science and Engineering, vol. 10, no. 12, 1901, DOI: 10.3390/jmse10121901.
» https://doi.org/10.3390/jmse10121901 -
Paiva, V., Kampel, M. & Camayo, R. 2021, ‘Comparison of multiple surface ocean wind products with buoy data over Blue Amazon (Brazilian Continental Margin)’, Advances in Meteorology, vol. 2021, Article ID 6680626, 19 p., DOI: 10.1155/2021/6680626.
» https://doi.org/10.1155/2021/6680626 -
Pimenta, F., Kempton, W. & Garvine, R. 2008, ‘Combining meteorological stations and satellite data to evaluate the offshore wind power resource of Southeastern Brazil’, Renewable Energy, vol. 33, no. 11, pp. 2375-2387, DOI: 10.1016/j.renene.2008.01.012.
» https://doi.org/10.1016/j.renene.2008.01.012 -
Prasad, A.A., Taylor, R.A. & Kay, M. 2017, ‘Assessment of solar and wind resource synergy in Australia’, Applied Energy, vol. 190, pp. 354-367, DOI: 10.1016/j.apenergy.2016.12.135.
» https://doi.org/10.1016/j.apenergy.2016.12.135 - Reboita, M.S., Ambrizzi, T., Silva, B.A., Pinheiro, R.F. & da Rocha, R.P. 2019, ‘The South Atlantic Subtropical Anticyclone: Present and Future Climate’, Frontiers in Earth Science, vol. 7, 8.
-
Reis, M.M.L., Mazetto, B.M. & Silva, E.C.M. 2021, ‘Economic analysis for implantation of an offshore wind farm in the Brazilian coast’, Sustainable Energy Technologies and Assessments, vol. 43, 100955, DOI: 10.1016/j.seta.2020.100955.
» https://doi.org/10.1016/j.seta.2020.100955 -
Rosa, C.O.C.S., Costa, K.A., Christo, E.S. & Bertahone, P.B. 2017, ‘Complementarity of hydro, photovoltaic, and wind power in Rio de Janeiro State’, Sustainability, vol. 9, no. 7, 1130, DOI: 10.3390/su9071130.
» https://doi.org/10.3390/su9071130 -
Rosa, C.O.C.S. 2019, ‘Estudo de complementaridade entre as energias hidrelétrica, eólica e fotovoltaica nas regiões Sudeste e Centro-Oeste’, Master dissertation, Programa de Pós-Graduação em Modelagem Computacional em Ciência e Tecnologia, Universidade Federal Fluminense, Volta Redonda, 156 f., DOI: 10.22409/PPGMCCT.2019.m.13332433750.
» https://doi.org/10.22409/PPGMCCT.2019.m.13332433750 -
Shadman, M., Silva, C., Faller, D., Wu, Z., de Freitas Assad, L.P., Landau, L., Levi, C. & Estefen, S.F. 2019, ‘Ocean renewable energy potential, technology, and deployments: a case study of Brazil’, Energies, vol. 12, no. 19, 3658, DOI: 10.3390/en12193658.
» https://doi.org/10.3390/en12193658 -
Silva, A.J.V.D.C., Cataldi, M. & Dragaud, I.C.D.V. 2016, ‘Avaliação do potencial de geração eólica offshore na região costeira dos municípios de Cabo Frio e Arraial do Cabo, estado do Rio de Janeiro’, Proceedings of XIV Encontro Nacional de Estudantes de Engenharia Ambiental, II Fórum Latino e I SBEA - Centro-Oeste, pp. 432-439, DOI: 10.5151/engpro-eneeamb2016-er-010-4816.
» https://doi.org/10.5151/engpro-eneeamb2016-er-010-4816 -
Silva, A.R., Pimenta, F.M., Assireu, A.T. & Spyrides, M.H.C. 2016, ‘Complementarity of Brazil’s hydro and offshore wind power’, Renewable and Sustainable Energy Reviews, vol. 56, pp. 413-427, DOI: 10.1016/j.rser.2015.11.045.
» https://doi.org/10.1016/j.rser.2015.11.045 - Tavares, L.F.A. 2020, ‘Energia eólica offshore: uma avaliação do potencial técnico das regiões Sul e Sudeste brasileiras a partir de três reanálises atmosféricas e do modelo WRF’, Master dissertation, Programa de Pós-Graduação em Meteorologia, UFRJ/IGEO, Rio de Janeiro.
-
Zheng, C.W. & Li, C.Y. 2015, ‘Variation of the wave energy and significant wave height in the China Sea and adjacent waters’, Renewable and Sustainable Energy Reviews, vol. 43, pp. 381-387, DOI: 10.1016/j.rser.2014.11.001.
» https://doi.org/10.1016/j.rser.2014.11.001