Figure 2.
Chromatographic profile of B. jararaca snake venom, SDS-PAGE, and binding assays of the isolated fractions. (A) The chromatographic profile demonstrates fractionation on a CM-Sepharose column previously equilibrated with 50 mM AMBIC, pH 8.0, and fractions eluted with a 0-100% gradient of 500 mM AMBIC, pH 8.0, at a constant flow rate of 1 mL/min, monitored at 215 (red) and 280 nm (blue). The twelve fractions collected were numbered from 1 to 12, the fractions of interest 10, 11, and 12 being indicated with asterisks (*). SDS-PAGE of the 12 fractions from B. jararaca venom. (B) MM: molecular mass, V: crude venom, and eight fractions named F1 to F8. (C) MM: molecular mass, and fractions from F9 to F12. (D) Fraction interaction responses: 10 (blue), 11 (green) and 12 (red) with responses of 125, 10 and 12 RUs, respectively.
Figure 4.
Two-dimensional SDS-PAGE: CatD, BthTX-II, and enzymatic complex. (A) Two-dimensional SDS-PAGE of CatD showing a pI of 4.74 and approximate molecular mass of 35 kDa. (B) Two-dimensional SDS-PAGE of BthTX-ll with a pI of 8.74, with an approximate molecular mass of 14 kDa. (C) Two-dimensional SDS-PAGE of the complex with a pI of 5.79, and approximate molecular mass of 49 kDa.
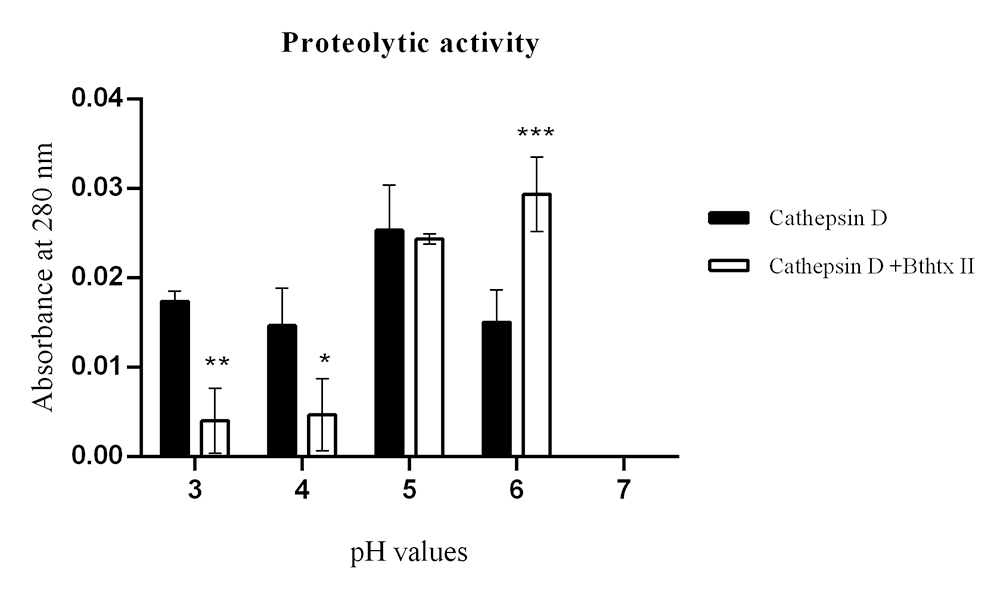
Figure 5.
Proteolytic activity of CatD and the CatD + BthTX-II complex. The evaluation was performed at pHs 3, 4, 5, 6, and 7, identified in the figure legend, highlighting CatD in white (positive control) and the CatD + BthTX-II complex in black. As a negative control, the buffer itself (sodium citrate) was used at different pHs. The toxin used in the tests (BthTX-II) was submitted to contamination analysis (described in the second section). Two-way analysis of variance (ANOVA) with Tukey’s multiple comparison post-test with significance level p < 0.05.
Figure 6.
Proteolytic activity on casein. (A) Samples identified in the legend results: CatD, CatD + BthTX-II, CatD + BthTX-II + pepstatin A were considered negative controls; buffer (sodium citrate) was used at different pHs. (B) Proteolytic activities SDS-PAGE. Samples: (1) CatD; (2) pepstatin A (PepA); (3) casein; (4) CatD + PepA + casein; (5) CatD + casein; (6) CatD + BthTX-II Casein + PepA; (7) CatD + BthTX-II + casein (30 min); (8) CatD + BthTX-II + casein (15 min); (9) CatD + BthTX-II + casein (5 min). Samples 3 through 6 were incubated for 30 min at 27 ºC. Positive control: CatD; negative control: pepstatin A (PepA).
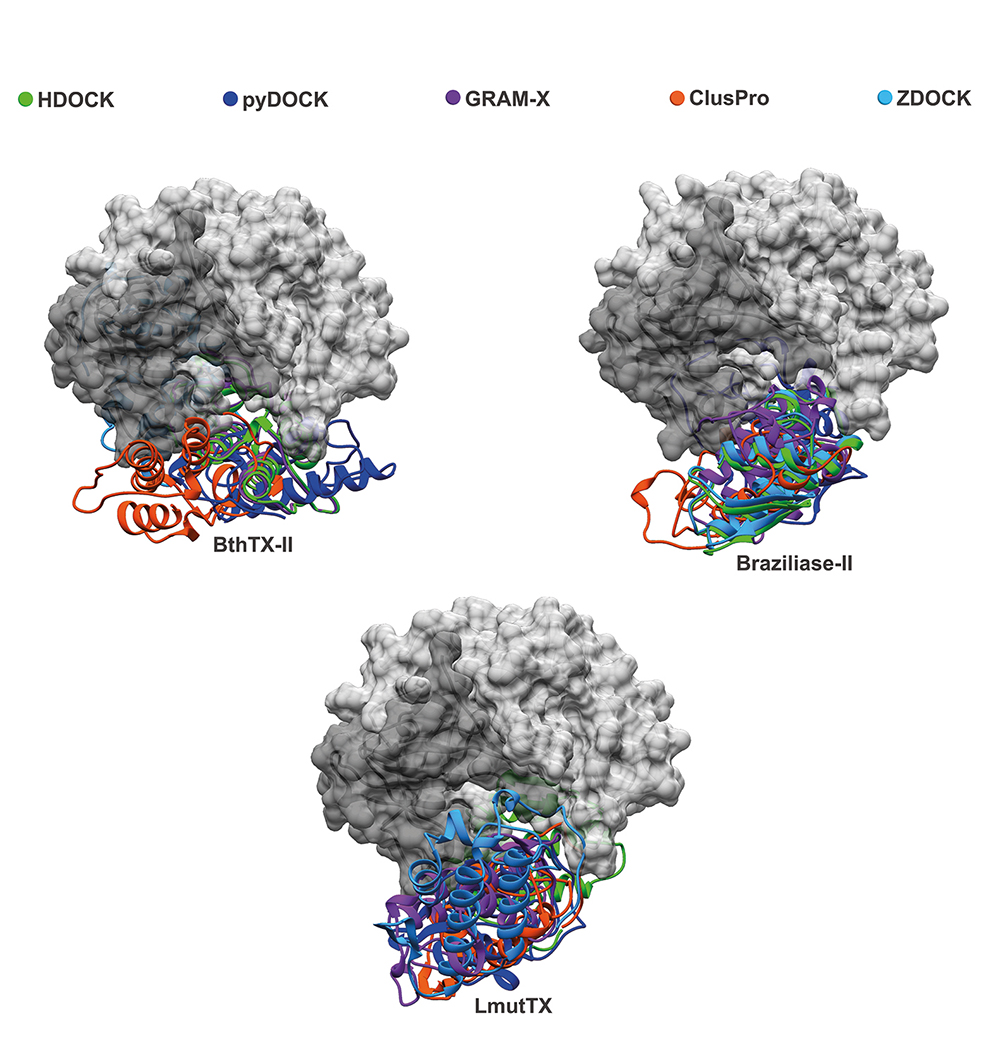
Figure 8.
Molecular modeling of the interaction between three snake venom PLA2s (LmuTX, Braziliase-II and BthTX-II) and human CatD using different docking tools (HDOCK, pyDOCK, GRAM-X, ClusPro, and ZDOCK). The CatD surface is represented in dark gray (light chain) and light gray (heavy chain). The svPLA2s are colored according to the docking tool used.
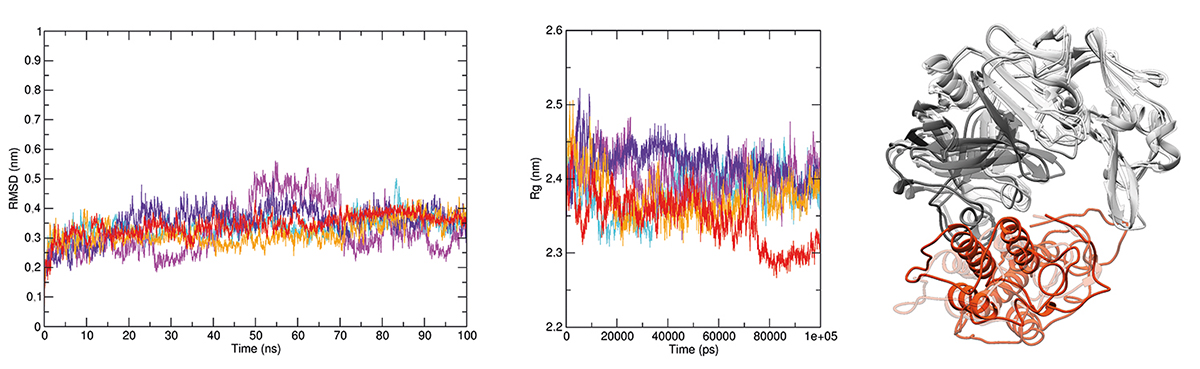
Figure 9.
Molecular modeling of the CatD + BthTX-II complex. The complex formed between human CatD is shown in gray (light chain in dark gray and heavy chain in light gray) and BthTX-II is shown in orange. The interactions were enlarged to show amino acid residues in the interface and their interactions. H-bonds are highlighted by green dashed lines, and hydrophobic interactions are depicted as protrusions colored to match each amino acid residue.


 Thumbnail
 Thumbnail
 Thumbnail
 Thumbnail
 Thumbnail
 Thumbnail
 Thumbnail
 Thumbnail
 Thumbnail
 Thumbnail