 Nutritional, physical, chemical, and technological properties of chickpea (Cicer arietinum L.) flours
ABSTRACT
Chickpeas have attracted considerable interest in the food industry due to their high nutritional value and wide versatility for the development of new products; in this context, the objective of this study was to determine the physical, chemical, and technological properties of this legume. The experiment was conducted using a completely randomized design with 18 treatments evaluated in triplicate and analyzed using the Scott-Knott test (p ≤ 0.05). It was observed that the GB2112762173 cultivar stood out in terms of physical characteristics, exhibiting high values of bulk and true density, as well as relatively low porosity. In terms of chemical characteristics, the GB ALEPPO cultivar had the highest protein content, while GB20056A2179 had the lowest lipid content, and GB20006 was the richest in carbohydrates and energy value. In terms of color, GB05155 and GB2119682178 were the lightest, GB20146MT and GB20006 were the reddest, and GB2112762173 and GB CRISTALINO were the yellowest; GBZEUS showed the best result in oil absorption, BRS TORO stood out in water solubility, and GB200012164 performed best in water absorption. In terms of dimensions, GB20056A2179 had the highest values for surface area, geometric diameter, and volume, while GB 05155 and GB 2119682178 had the lowest values; GB20056A2179 also had the highest means for length, width, and thickness, while GB20006 and GB20146MT had intermediate values; GB2112762173 had the smallest projected area; GB2112102169 stood out for having the highest values for circularity and sphericity, while GB20056A2179 and GB20146MT had the lowest values for these same variables.
Key words:
protein; lipids; cultivars
HIGHLIGHTS:
Chickpea flours showed relevant water and oil interaction properties.
There were significant differences in physical and technological properties of chickpea flours between the cultivars.
Chickpea cultivars showed a wide diversity of flour colors, ranging from beige to dark brown.
RESUMO
O grão-de-bico tem despertado grande interesse na indústria alimentícia por combinar alto valor nutricional com ampla versatilidade para o desenvolvimento de novos produtos; nesse contexto, o objetivo deste estudo foi determinar as propriedades físicas, químicas e tecnológicas dessa leguminosa. O experimento foi conduzido em um delineamento inteiramente casualizado com 18 tratamentos avaliados em triplicata e submetidos ao teste de Scott-Knott (p ≤ 0,05). Observou-se que a cultivar GB2112762173 se destacou nas características físicas, apresentando altos valores de densidade unitária e global, além de porosidade relativamente baixa. Em termos de características químicas, a cultivar GB ALEPPO mostrou-se a mais proteica, enquanto a GB20056A2179 apresentou o menor índice lipídico e a GB20006 é a mais rica em carboidratos e valor energético. Quanto à cor, GB05155 e GB2119682178 foram as mais claras, GB20146MT e GB20006 as mais avermelhadas, GB2112762173 e GB CRISTALINO as mais amareladas; GBZEUS apresentou o melhor resultado em absorção de óleo, BRS TORO destacou-se na solubilidade em água e GB200012164 apresentou melhor desempenho na absorção de água. Em termos de dimensões, GB20056A2179 apresentou os maiores valores de área superficial, diâmetro geométrico e volume, enquanto GB 05155 e GB 2119682178 apresentaram os menores valores; GB20056A2179 também apresentou as médias mais altas de comprimento, largura e espessura, enquanto GB20006 e GB20146MT apresentaram valores intermediários; GB2112762173 apresentou a menor área projetada; GB2112102169 destacou-se por apresentar os maiores valores de circularidade e esfericidade enquanto GB20056A2179 e GB20146MT apresentaram os menores valores para as mesmas variáveis.
Palavras-chave:
proteína; lipídios; cultivares
INTRODUCTION
Legumes play a very important role in human and animal nutrition because they are rich in protein, carbohydrates, and fiber, thus providing numerous benefits to human body. Several crops are known and consumed worldwide, and among the five best-known legumes is chickpea. This grain originated in Turkey, but it is in Asia that the highest production and consumption rates in the world are recorded (Queiroga et al., 2021). Chickpea belongs to the family of herbaceous plants and is characterized by having leaves that range in color from green to yellow, whitish pods, and stems measuring approximately 70 cm (Fazeli-Nasab et al., 2025).
India is estimated to be the largest producer and consumer of chickpeas in the world, and it is also believed that its consumption accounts for around 70% of global production. In Brazil, its production is still of low relevance when compared to beans, corn, soybeans, wheat, and rice, making it necessary to import from countries such as Argentina and Mexico to meet domestic consumption demand (Gomes Filho & Fernandes, 2022).
As it is a highly nutritious and gluten-free legume, Silva (2019) suggests that chickpeas be widely used in the food industry for the development of functional flours, gluten-free pasta, vegetarian snacks, vegetable drinks, the production of meat analogues, such as hamburgers and vegetable meatballs, as well as in the formulation of soups and instant products, thus offering nutritious and affordable alternatives for different audiences.
Despite this potential, there are still few studies that conduct an integrated and comparative assessment of the physical, chemical, and technological properties of different chickpea cultivars under the same production and analytical context. In this regard, the contribution of this study lies in the systematic comparison of a diverse set of cultivars produced under specific conditions in the Brazilian Midwest, using standardized methodologies to highlight relevant differences between the materials evaluated. The results obtained allow for a broader understanding of the physical and technological behavior of the grains and their flours, providing support for the classification, processing, and industrial application of these cultivars. Thus, the objective of this study was to determine the physical, chemical, and technological properties of different chickpea cultivars, contributing to the valorization and better use of these materials in the productive and industrial context.
MATERIAL AND METHODS
For this study, grains from the cultivars GB 20056A2179, GB 20146MT, GB 20023, GB 2119682178, GB 20031D, GB ZEUS, GB 2112762173, GB 0327, GB 20006, GB ALEPPO NEW 2168, BRS TORO, GB 20031, BRS CRISTALINO 2163, GB 211867, GB 200012164, GB 05155, GB 20074 and GB 2112102169 were provided by the Instituto Federal Goiano (IF Goiano) - Campus Iporá (16° 25’ 29” S and 51° 09’ 07” W, and altitude of 590 m), Goiás state, Brazil, whose production is not the subject of analysis in this study. The analyses were carried out at the Post-Harvest Laboratory for Plant Products (LPCPV) of the Federal Institute of Goiás, located in the city of Rio Verde, at 17° 48’ 19” S and 50° 54’ 18” W, and altitude of 747 m.
To perform the physical, chemical, and technological analyses, part of the grains was ground into flour using a DIOGOMAQ electric mill with a cyclone rotor, model MA 1340. Particle size was standardized using a 1-mm-mesh stainless steel sieve; the samples were then packed in polypropylene plastic containers and stored at 2 °C in a Biochemical Oxygen Demand (BOD) incubator.
Moisture content was determined based on the AACC (1999) method by drying in an oven, adjusted to a temperature of 105 °C for 24 hours. Ash analyses, also called fixed mineral residue, were performed on chickpea flour according to the AOAC method No. 923.03 of 2005. Lipid determination was performed using the Soxhlet technique, AOAC method No. 923.03 of 2005. Protein content was determined using AACC regulation 46-12, where the total organic nitrogen content was verified, following the Kjeldahl methodology. Water and oil absorption and solubility indices were obtained according to Anderson et al. (2006). Carbohydrates were determined by means of mathematical calculations that relate total integral matter to the percentages of water, protein, lipids and ashes, according to the following equation (Eq. 1):
The energy value was determined using the Atwater equation, which applies specific conversion constants for each macronutrient, according to the following equation (Eq. 2):
The shapes and sizes were determined by randomly selecting 20 grains from each cultivar to be measured with a Mtx digital caliper with a resolution of 0.02 mm according to the “x,” “y,” and “z” axes, where “x” represents width, ‘y’ represents length, and “z” represents depth, according to the instructions of Mohsenin (1986). Roundness is the result between the ratio of the largest projected area of the grain to the area of the smallest circle (Eq. 3):
Sphericity is obtained through the relationship between width and height (Eq. 4):
Projected area (Pa) is determined through the ratio between the two largest axes of the grains (width and height), as shown in the equation below (Eq. 5).
Surface area is the multiplication between the “X”, “Y” and “Z” axes (width, height and length) (Eq. 6):
Volume was determined by means of the relationship between the “X”, “Y” and “Z” axes (Eq. 7).
The “surface/volume” ratio is the ratio of surface area to volume, as shown in the equation below (Eq. 8).
The color of the grains and flours was determined in triplicate using a Hunter Lab digital colorimeter, and the results were presented as reflectance coordinates L*, a*, and b*, according to the methodology AACC 14-22. The bulk density, was determined in triplicate based on the ratio between the mass of the sample and its respective volume, while the true density was calculated (in triplicate) based on the relationship between the bulk density and porosity. Intergranular porosity was evaluated in triplicate according to the instructions of Couto et al. (1999) using the direct method by liquid transfer.
The experiment was conducted in a completely randomized design (CRD), with 18 treatments evaluated in triplicate. The results were presented in tables, expressed as mean ± standard deviation. The mean values obtained were subjected to analysis of variance (ANOVA) and, subsequently, to the Scott-Knott test at p ≤ 0.05. All statistical analyses were performed using SISVAR® software version 6.0 (Ferreira, 2019).
RESULTS AND DISCUSSION
By analyzing the values obtained in the experiment, it can be seen that the numbers found for the true density are much more significant when compared to the bulk density. Thus, Table 1 shows the means for porosity (%), bulk density (kg m-3), true density (kg m-3), moisture content (% wet basis), ash (%), coefficient of variation, and standard deviation.
Mean values and standard deviation for bulk density, true density, porosity, moisture content, and ash content of grains for different chickpea cultivars
The difference between the values found for true density and bulk density was expected, because the determination of specific mass only considers the mass of the grains and disregards porosity. On the other hand, bulk density includes the mass of the grains, the porosity, and the moisture content present in the material, which results in a significantly lower value.
According to the data obtained in the experiment and presented in Table 1, the porosity varied among the cultivars, forming two distinct groups, which is mainly associated with differences in size, shape and way in which the grains are accommodated in the volume. The cultivars GB 20146MT, GB 2112762173, GB 0327, GB 200012164 and GB 2112102169 tend to have more irregular grains, which are more difficult to fit together and increases empty spaces. On the other hand, the cultivars GB 20056A2179, GB 20023, GB 2119682178, GB 20031D, GB ZEUS, GB 20006, GB ALEPPO NEW 2168, BRS TORO, GB 20031, BRS Cristalino 2163, GB 211867, GB 05155 and GB 20074 have more uniform grains, allowing better accommodation and, therefore, less porosity.
From a technological point of view, Couto et al. (1999) suggest that lower porosity values are associated with greater efficiency in storage, transportation and processing, since more compact materials occupy less volume and have less air exchange between grains.
Similarly, true density (ρu) had an overall mean of 1,405.4 kg m⁻3, a value close to that reported by Santos et al. (2012) for corn grains (1,580 kg m⁻3) and lower than that observed by Silva et al. (2024) for beans of the BRS Estilo cultivar (1,085.88 kg m⁻3). This is a very pertinent comparison since corn, beans and chickpeas are dry grains, widely used in storage and processing systems and contain, in different proportions, matrices rich in starch and proteins, components that directly influence the density and structural organization of the grains.
The bulk density, analyzed together with the porosity and the true density, showed great statistical variation between the cultivars. This behavior is directly linked to genetic differences, especially in terms of size, shape and the way grains are organized within a given volume. In this context, cultivars such as GB 20056A2179, GB 2119682178, GB 20031D, GB ZEUS, GB 20031 and BRS Cristalino 2163, classified in the group with the highest bulk density, tend to show more regular grains that are better accommodated to each other, reducing empty spaces and increasing the amount of mass per unit volume. The cultivars GB 20023, GB 2112762173, GB 0327, GB 20006, GB ALEPPO NEW 2168, GB 211867 and GB 2112102169, which formed the intermediate group, probably show greater variation in the size and shape of the grains, which hinders a more efficient fitting and increases the spaces between them, reducing the bulk density. BRS TORO, GB 05155 and GB 20074 stood out for their greater volumetric uniformity, suggesting more homogeneous grains, which contributes to less variation in the volume occupied; on the other hand, the cultivar GB 20146MT, which had the lowest bulk density, indicates more irregular grains, which limits the use of space and reduces the mass per unit volume.
Table 1 also gathers data on moisture content and fixed mineral residue (ash). As the grains did not go through a drying process to standardize the moisture, there was a considerable variation in this parameter among the different cultivars; thus, GB ZEUS had 30.57% w.b. and was considered the cultivar with the highest moisture content, while GB 20006 had 14.63% w.b. and was the cultivar with the lowest moisture content. Thus, it can be observed that, among the 18 varieties tested, 15 showed variations in moisture content. According to SENAR (2018), for quality processing and safe storage, the recommended moisture content is between 12 and 13%.
Although the variation in moisture content among the cultivars was much more expressive than the variations in ash content, it became necessary to evaluate whether these differences were related to each other. For this, Pearson’s correlation test was applied, whose coefficient (r) indicated a negative correlation very close to zero, showing that there is practically no linear relationship between the moisture content and the fixed mineral residue in the evaluated grains.
The Pearson correlation test according to Pereira et al. (2013) is a widely used method for measuring linear relationships between variables. Represented by the letter “r,” this coefficient ranges from -1 to 1, where extreme values indicate perfect linear relationships (positive or negative) and values close to zero suggest no linear correlation.
The correlation between moisture content and ash content was very weak, suggesting that an increase in moisture content has little to do with a reduction in ash content. Furthermore, the coefficient of determination (R2 = 0.0146) indicates that only 1.46% of the variation in ash content can be explained by the variation in moisture content, while 98.54% cannot, as it is influenced by other factors.
Thus, it can be concluded that the amount of water available in the grain, according to the Pearson correlation test, which showed a result of -0.12, has little or no interference on the ash content of the analyzed sample, and that the differences recorded may be more related to the genetic characteristics of the species than to the moisture content itself.
In this context, it can be seen that among the cultivars mentioned, the ash content had an overall mean of 2.71%, ranging from 1.85 to 3.31%, figures that are quite in line with the 2.38% found by Guzel & Sayar (2012) during analysis of the effect of cooking on the nutritional properties of chickpeas, lower than the 3.76 to 4.09% found by Soares Júnior et al. (2012) during the evaluation of traditional bean cultivars, and lower than the 5.11% found by Martinez et al. (2011) in the evaluation of chemical changes undergone by soybeans before and after germination.
Table 2 shows the statistical results of the analyses of proteins, lipids, carbohydrates, and energy value. The results indicated that the 18 chickpea cultivars had an average protein content of 19.68 g 100g⁻1, being separated into two statistical groups. This variation is expected, as the protein content in grains is strongly influenced by genotype, nitrogen uptake efficiency, and capacity for protein concentration in the endosperm and cotyledons, factors widely described for legumes (Upretee et al., 2024). Cultivars such as GB 20146MT, GB 20023, GB 20031D, GB 2112762173, GB ALEPPO NEW 2168 and BRS Cristalino 2163, classified in group “A”, showed higher protein contents, with a mean of 23.56 g 100g⁻1, indicating greater efficiency in the synthesis and accumulation of nitrogenous compounds. On the other hand, the cultivars GB 20056A2179, GB 2119682178, GB ZEUS, GB 0327, GB 20006, BRS TORO, GB 20031, GB 211867, GB 200012164, GB 05155, GB 20074, and GB 2112102169 showed the lowest average protein content (17.74 g 100g⁻1), which may be associated with genetic differences and greater metabolism direction towards carbohydrate synthesis to the detriment of proteins.
Mean values and standard deviation for proteins, lipids, carbohydrates and energy value contents of chickpea flours
Summo et al. (2019) evaluated 57 cultivars, 36 of which are from the Kabuli and Desi group and 21 are from the “Apúlia negra” type, and observed that the protein content varied between 17.4 and 20.7%; this result is lower than the 18 to 29% found in the analyses carried out by Boukid (2021); however, it is quite consistent with the numbers presented in this study.
The wide diversity of cultivars is directly responsible for the variations in the physical and chemical properties of chickpeas. Here, it was verified that, unlike protein content, all chickpea varieties had a single lipid classification and an overall mean of 2.89 g 100g-1, which indicated that the lipid content remained statistically “constant” for all 18 cultivars. Higher results were found by Boukid (2021), around 3.1 to 6.8%, and by Ferial & Esmat (2011), who found 5.62% when determining the nutritional properties of chickpeas used in the production of tempeh (a fermented hamburger made from a solid substrate composed of cooked grains).
Elbar et al. (2022) state that this legume contains approximately 57.97% carbohydrates, which is below the 60.82% cited by Fernandes et al. (2024) and above the overall mean of 49.23 100g-1 described here. GB 20006 contains 60.47 100g-1 and was considered the cultivar with the highest carbohydrate content, while GB ALEPPO NEW 2168 had 38.45 100g-1, being classified as the cultivar with the lowest amount of carbohydrates.
In terms of energy value, the 18 cultivars described here had an overall mean of 301.70 kcal 100g-1, which is extremely consistent with the reports by Boukid (2021), who found means ranging from 357 to 446 kcal 100g-1 of chickpeas. However, there were many differences between the samples, for instance GB 20056A2179, GB ZEUS, GB 20006, BRS TORO, GB 20031, and GB CRISTALINO 2163 obtained completely different classifications from each other, as they showed unique results; while GB 20146MT and GB 211867 were classified as “F”, GB 20031D and GB 2112762173 were classified as “G”, GB 20074 and GB 2112102169 were classified as “H”, GB 0327, GB 200012164 and GB 05155 were classified as “I”, and GB 2119682178 and GB ALEPPO NEW 2168 were classified as “J” .
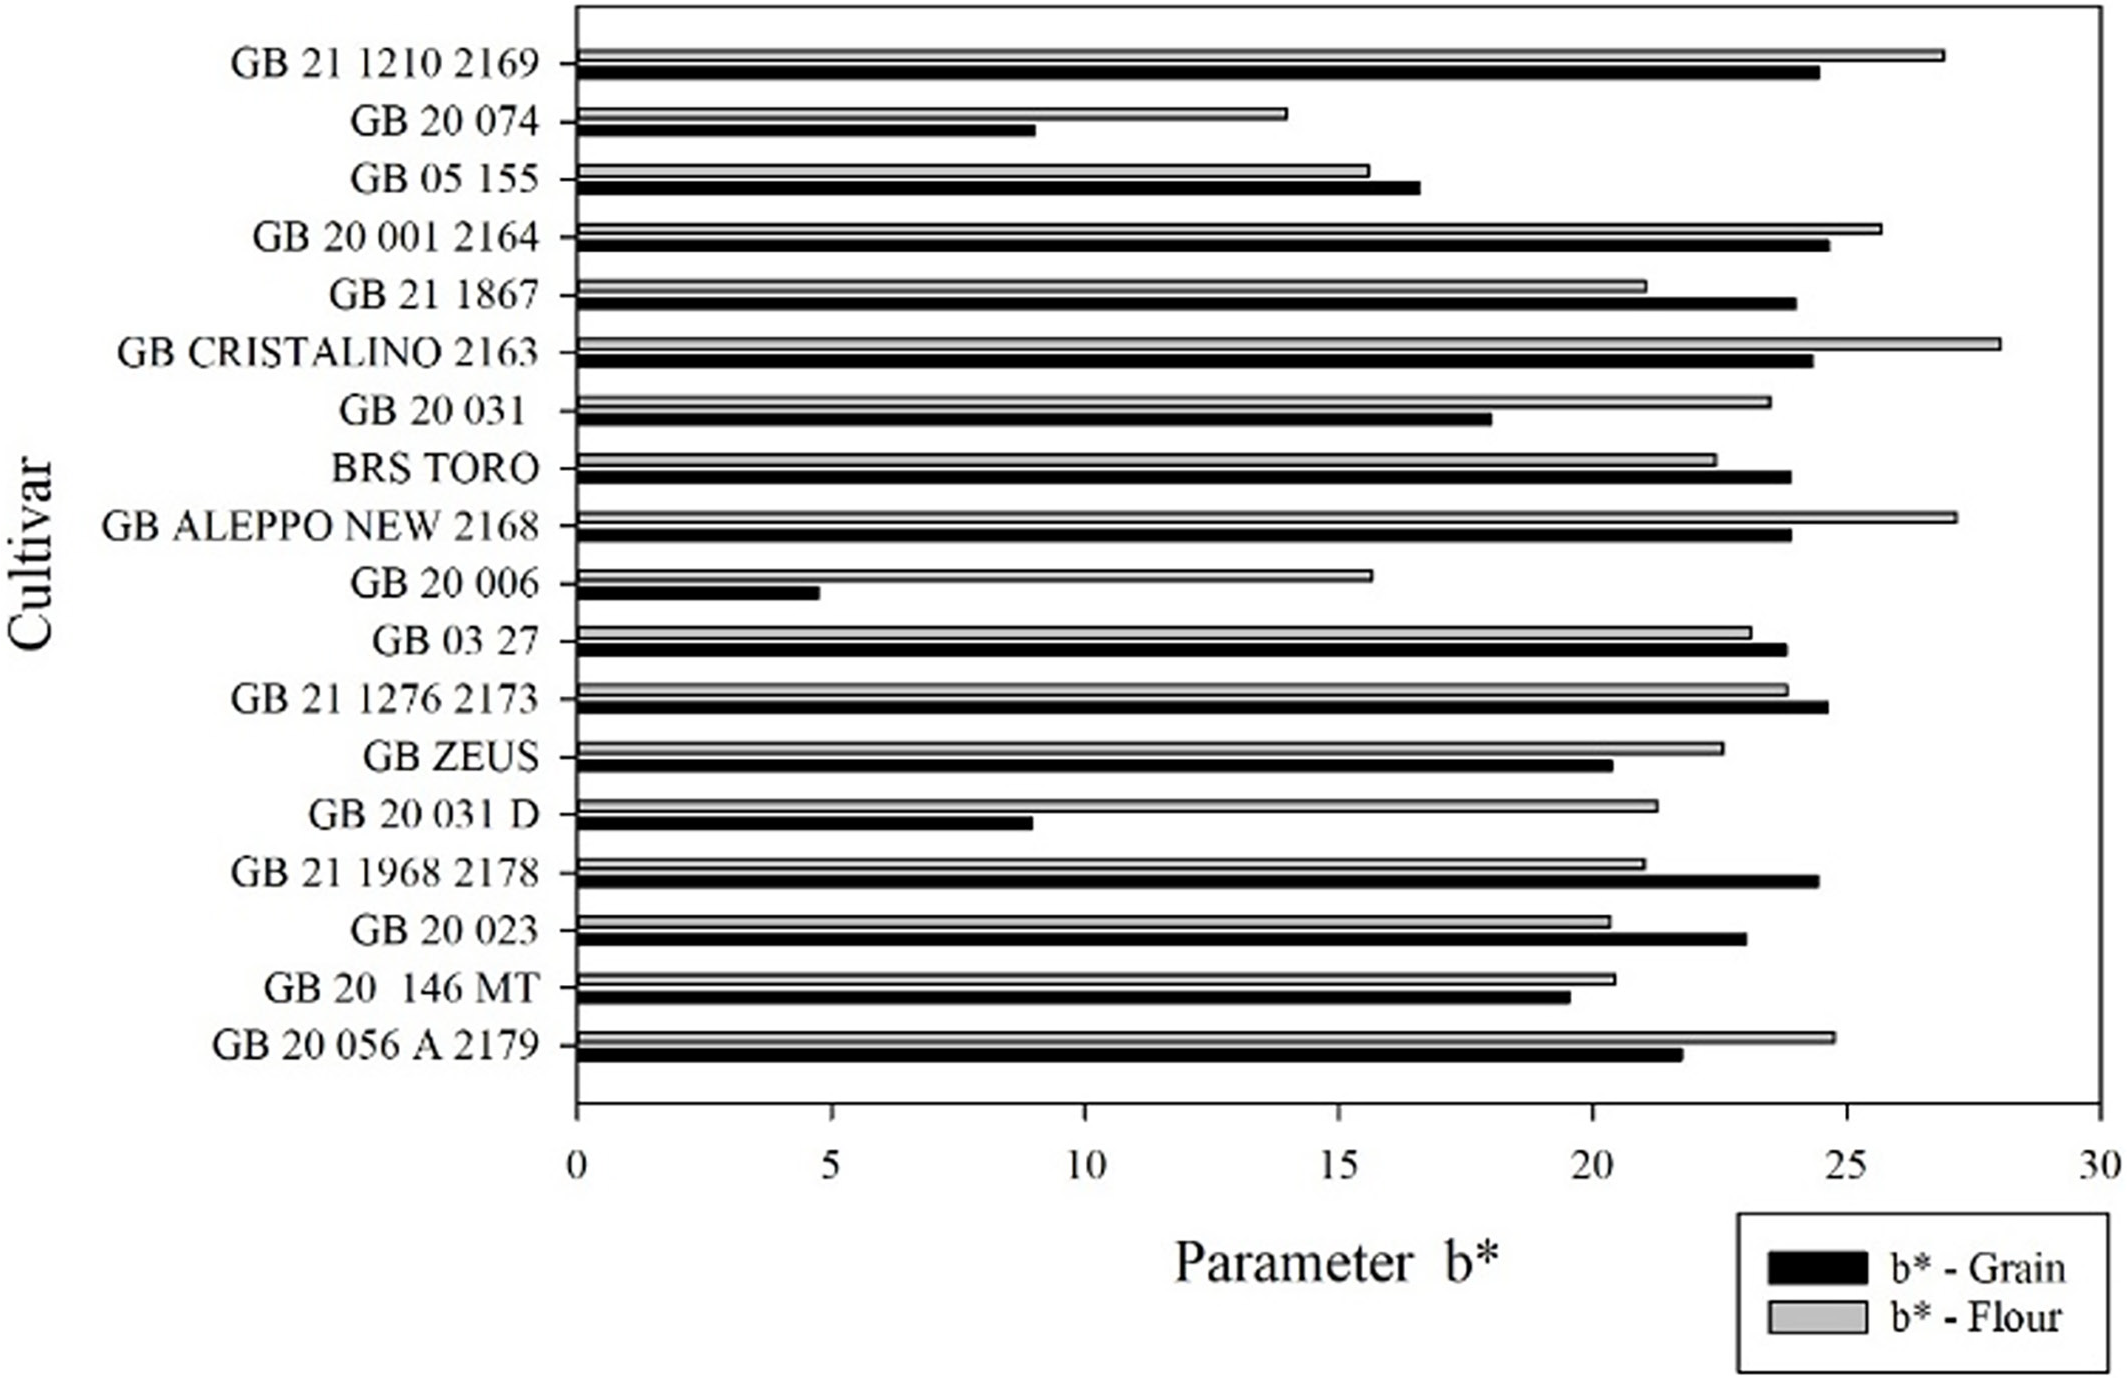
Table 3, in accordance with Figures 1, 2, and 3, presents the results of the colorimetric tests and compares the analyses performed on the grains and flours. In this context, it can be observed that, in all scenarios, the L* of the flour was, on average, 32.87% higher than the L* of the grain, demonstrating that the transformation of the grain into flour causes it to have a greater tendency to achieve lighter colors.
Mean values and standard deviation of the color parameters L*, a* and b* of the grains and flours


In contrast, Figure 2 shows that the a* of the grain, with a mean of 11.26%, had an advantage in all treatments, as it proved to be much higher than the a* of the flour. Thus, it is understood that the whole grain tends to be redder than when processed into flour.
Finally, the results for b* shown in Figure 3 differ from those of both L* and a* because there were variations between cultivars, with GB 20056A2179, GB 20146MT, GB 20031D, GB ZEUS, GB 20006, GB ALEPPO NEW 2168, GB 20031, GB CRISTALINO 2163, GB 200012164, GB 20074 and GB 2112102169 having a higher b* value for flour than for grain and GB 20023, GB 2119682178, GB 2112762173, GB 0327, BRS TORO, GB 211867 and GB 05155 having a higher b* value for the grain than for the flour.
Table 4 shows the results of the analyses of oil absorption, water absorption, and water solubility indices. The evaluation of the water absorption index (WAI) of GB 20006 and GB 200012164 showed average values between 3.21 and 5.24 g water g-1, differing from the average values found by Neves et al. (2008). These authors point out that different studies present values close to 20 g water g-1 for grain and vegetable flours.
Mean values and standard deviation for oil absorption index, water absorption index and water solubility of chickpea flour
The oil absorption index (OAI) of the different chickpea cultivars varied between 2.37 and 3.23 g water g-1. This result is extremely comparable to the figures found by Gonçalves et al. (2014) in their evaluation of the physical-chemical properties of flours from two varieties of soybeans (Glycine max), which showed oil absorption capacities ranging from 2.60 to 2.87 g oil g-1 flour. This variation can be attributed to differences in the chemical composition of the cultivars, especially in protein and carbohydrate content, which directly influence oil retention capacity.
The water solubility index (WSI) found in this study ranged from 10.10 to 20.17% for the GB ZEUS and GB 200012164 treatments, respectively, which is consistent with the results found by Kaur & Singh (2006) of 22.89% for the L-550 cultivar of the Kabuli group and 20.42 to 22.28% for the Desi group; however, these values are lower than the 3.35% found by Tas et al. (2022) for chickpeas, 2.90% for white beans, and 3.28% for lentils.
Table 5 shows the values resulting from measurements taken with an analog caliper on the three perpendicular axes present in the grains. According to the Scott-Knott test, there were slight variations in the axis corresponding to the length of the eighteen cultivars, with all of them having an overall mean of 9.805 mm. Thus, it is understood that, in this study, the length of the chickpea grain is the same regardless of the cultivar.
Mean values and standard deviation for length, width, thickness, projected area, circularity and sphericity of chickpeas
With regard to “width”, the behavior of the cultivars was completely different from that observed for length and thickness, with an overall mean of 8.054 mm and many metric variations between them. Statistical analysis shows that the eighteen cultivars were subdivided into four groups, with “classification A” being the group of grains with the largest measurements, and “classification D” being the group with the smallest measurements. Thus, it was observed that the width and length of chickpeas are determined by their respective genetics, but the length is the same for all, regardless of cultivar.
Regarding thickness, the eighteen cultivars had an overall mean of 7.538 mm, with BRS TORO and GB 20074 standing out as having the largest measurements. These figures are consistent with the results found by Avelar et al. (2018), who found average values of 9.06 cm in length, 7.52 cm in width, and 7.33 cm in thickness for the Kabuli cultivar.
Table 5 also lists circularity (%), sphericity (%), and projected area (mm2), in addition to the standard deviation. Thus, the statistics showed that the evaluation of “projected area” among the cultivars did not show significant variations. Although each cultivar had different results and standard deviation, the Scott-Knott test considered the variations incapable of distinguishing one cultivar from another; thus, all cultivars received an “A” rating, showing that there are no statistical differences between cultivars.
In contrast, circularity analyses showed some variations, with GB 2112102169 being the treatment that obtained the highest average results, while GB 20023 and GB 2119682178 had the lowest values, with different standard deviations and equal circularity means.
In the assessment of sphericity, there were significant variations between cultivars, with GB 2112102169 differing from all the others, showing a value of 94.63 mm2 and being considered one with the largest area, while GB 20023 and GB 2119682178 had the lowest results. Thus, it can be seen that cultivars GB 2112102169, GB 20023, and GB 2119682178, both in circularity and sphericity, showed the same characteristics in both analyses, occupying the extreme positions, that is, they were among those with the highest and lowest results.
Table 6 shows a comparison between the results of the mean tests for surface area, volume, surface/volume ratio, and geometric diameter. In this context, it can be seen that the eighteen cultivars showed distinct characteristics among themselves, except for the volume parameter, which had an overall mean of 312.00 mm3 with a variation concentrated between 380.27 and 241.89 mm3. Although this difference in volume appears to be significant, statistically the cultivars were considered unable to distinguish themselves from each other.
Mean values and standard deviation for surface area, geometric diameter, volume and surface/volume of chickpeas
In terms of surface area and geometric diameter, cultivars GB 20056A2179, GB 20146MT, GB 20023, GB 2119682178, GB 20031D, GB ZEUS, GB 0327, GB 20006, BRS TORO, GB 211867, GB 05155, and GB 20074 stood out because they showed exactly the same statistical results, with low variation; BRS TORO had the highest means of 27.85 mm2 and 8.86 mm, respectively, while GB 20146MT recorded the lowest values of 26.00 mm2 and 8.27 mm, respectively; GB 200012164 stood out from the others for having the highest means of 25.80 mm2 and 8.21 mm, respectively, and GB 2112102169, considered the grain with the smallest area.
Finally, regarding the area/volume ratio, it can be seen that the results are completely opposite to the volume values, since the volume proved to be completely stable in all treatments, while the area/volume ratio is exactly the opposite, as there were several classifications between categories.
CONCLUSIONS
1. Among the various cultivars studied, considerable variability was observed in physical, chemical, and technological characteristics, with GB 2112762173 exhibiting higher specific mass values, as well as relatively low porosity.
2. In terms of chemical characteristics, GB ALEPPO NEW had the highest protein content, GB 20 056 A 217 had the lowest lipid content, and GB 20006 had the highest carbohydrate content and energy value.
3. Regarding the color of the grains and flours, GB 05155 and GB 2119682178 were the lightest, GB 20146MT and GB 20006 the reddest, and GB 2112762173 and GB CRISTALINO the yellowest.
4. GB ZEUS showed better oil absorption results, BRS TORO had higher water solubility, and GB 200012164 had higher water absorption.
5. In terms of dimensions, GB 20056A2179 had the highest values for surface area, geometric diameter, and volume, while GB 05155 and GB 2119682178 had the lowest values for these same variables.
6. GB 20056A2179 also had the highest means for length, width, and thickness, while GB 20006 and GB 20146MT had intermediate values. GB 2112762173 had the smallest projected area. GB 2112102169 stood out for having the highest values for circularity and sphericity, while GB 20056A2179 and GB 20146MT had the lowest values.
Acknowledgments:
To Institutional Program for Assistance with the Submission and Revision of Scientific Articles (PIAT) of IF Goiano, CAPES, FAPEG, FINEP, Embrapii, and CNPq for their essential financial support in carrying out this work.
Data availability statement:
The authors declare that there are no data underlying the text.
LITERATURE CITED
- AACC - American Association of Cereal Chemists International. Approved methods of analysis. 11.ed. St. Paul: AACC International, 1999. Method 14-22: Color of pasta - reflectance colorimeter method. First approval October 8, 1976; reapproval November 3, 1999.
-
Anderson, R. A. et al. Gelatinization of corn grits by roll cooking, extrusion cooking and steaming. Starke, v.22, p.130-135, 2006. https://doi.org/10.1002/star.19700220408
» https://doi.org/10.1002/star.19700220408 - AOAC. Association of Official Analytical Chemists. Official methods of analysis of AOAC international, 18.ed., Association of Official Analytical Chemists, Gaithersburg, MD, 2005. p.46-50.
-
Avelar, R. I. S. et al. Production and quality of chickpea seeds in different sowing and harvest periods. Journal of Seed Science, v.40, p.146-155. 2018. https://doi.org/10.1590/2317-1545v40n2185719
» https://doi.org/10.1590/2317-1545v40n2185719 -
Boukid, F. Chickpea (Cicer arietinum L.) protein as a prospective plant-based ingredient: a review. International Journal of Food Science and Technology, v.56, p.3875-3885, 2021. https://doi.org/10.1111/ijfs.15046
» https://doi.org/10.1111/ijfs.15046 -
Couto, S. M. et al. Massa específica aparente e real e porosidade de grãos de café em função do teor de umidade. Revista Brasileira de Engenharia Agrícola e Ambiental, v.3, p.61-68, 1999. https://doi.org/10.1590/1807-1929/agriambi.v3n1p61-68
» https://doi.org/10.1590/1807-1929/agriambi.v3n1p61-68 -
Elbar, D. et al. Physicochemical properties of legumes flakes (Chickpeas and Faba beans) preparing at different methods. Novel Techniques in Nutrition and Food Science, v.6, p.1-6, 2022. https://doi.org/10.31031/NTNF.2022.06.000643
» https://doi.org/10.31031/NTNF.2022.06.000643 -
Fazeli-Nasab, B. et al. Evaluation of drought-tolerant chickpea genotypes (Cicer arietinum L.) using morphophysiological and phytochemical traits. Frontiers in Plant Science, v.16, e1529177, 2025. https://doi.org/10.3389/fpls.2025.1529177
» https://doi.org/10.3389/fpls.2025.1529177 -
Fernandes, T. C. R. et al. Caracterização tecnológica da farinha de grão-de-bico variedade BRS Cristalino. Brazilian Journal of Food Technology, v.27, e202182, 2024. https://doi.org/10.1590/1981-6723.08221
» https://doi.org/10.1590/1981-6723.08221 -
Ferreira, D. F. Sisvar: a computer analysis system to fixed effects split plot type designs. Revista Brasileira de Biometria, v.37, p. 529-535, 2019. https://doi.org/10.28951/rbb.v37i4.450
» https://doi.org/10.28951/rbb.v37i4.450 - Ferial, A. S. M; Esmat, A. A-A. Physico-chemical properties of tempeh produced from chickpea seeds. Journal of American Science, v.7, p.107-118, 2011.
-
Gomes Filho, W. P.; Fernandes, L. A. Produção de grão-de-bico (Cicer arietinum L.) adubado com biocarvão de cana-de-açúcar. Research, Society and Development, v.11, e368271512, 2022. https://doi.org/10.33448/rsd-v11i15.36827
» https://doi.org/10.33448/rsd-v11i15.36827 -
Gonçalves, L. C. et al. Composição química e propriedades tecnológicas de duas cultivares de soja. Biochemistry and Biotechnology Reports, v.1, p.33-40, 2014. https://doi.org/10.5433/2316-5200.2014v3n1p33
» https://doi.org/10.5433/2316-5200.2014v3n1p33 -
Guzel, D.; Sayar, S. Effect of cooking methods on selected physicochemical and nutritional properties of barlotto bean, chickpea, faba bean, and white kidney bean. Journal of Food Science and Technology, v.49, p.89-95, 2012. https://doi.org/10.1007/s13197-011-0260-0
» https://doi.org/10.1007/s13197-011-0260-0 -
Kaur, M.; Singh, N. Relationships between selected properties of seeds, flours, and starches from different chickpea cultivars. International Journal of Food Properties, v.9, p.597-607, 2006. https://doi.org/10.1080/10942910600853774
» https://doi.org/10.1080/10942910600853774 -
Martinez, A. P. C. et al. Alterações químicas em grãos de soja com a germinação. Ciência e Tecnologia de Alimentos, v.28, p.23-31, 2011. https://doi.org/10.1590/S0101-20612011000100004
» https://doi.org/10.1590/S0101-20612011000100004 - Mohsenin, N. N. Physical properties of plant and animal materials. Nova York: Gordon and Breach Publishers. 1986. 841p.
-
Neves, G. A. da R. et al. Capacidade higroscópica de farinhas de diferentes frutas. In: Embrapa Amazônia. 12.. 2008. Belém: Embrapa Amazônia Oriental. 2008. Available on: <https://www.alice.cnptia.embrapa.br/alice/handle/doc/409867>. Accessed on: Aug. 2025.
» https://www.alice.cnptia.embrapa.br/alice/handle/doc/409867 -
Pereira, D. et al. Análise da estrutura físico-química e propriedades sensoriais de biscoitos tipo Maria. Acta Chimica Slovaca, v.6, p.269-280, 2013. https://doi.org/10.2478/acs-2013-0040
» https://doi.org/10.2478/acs-2013-0040 - Queiroga, V. P. et al. Grão de bico (Cicer arietinum L.): tecnologias de plantio e utilização. Revista Eletrônica A Barriguda. 1.ed. Campina Grande, 2021. 201p.
- Santos, C. C. dos. et al. Massa específica e porosidade de grãos pelo método de complementação de líquidos. Enciclopédia Biosfera. Centro Científico Conhecer, v.8, e1178, 2012.
- SENAR - Serviço Nacional de Aprendizagem Rural. Grãos: armazenamento de milho, soja, feijão e café. Brasília: SENAR, 2018. 100p.
-
Silva, D. V. et al. Qualidade nutricional das farinhas de epicarpo e mesocarpo de frutos de baru submetidos à secagem. Revista Brasileira de Engenharia Agrícola e Ambiental, v.23, p.6570, 2019. http://dx.doi.org/10.1590/1807-1929/agriambi.v23n1p65-70
» http://dx.doi.org/10.1590/1807-1929/agriambi.v23n1p65-70 - Silva, S. R. et al. Propriedades físicas dos grãos de feijão submetidos a diferentes métodos de secagem. Revista Mirante, v.17, p.187-201, 2024.
- Soares Júnior, M. S. et al. Características físicas, químicas e sensoriais de feijões crioulos orgânicos, cultivados na região de Goiânia-GO. Revista Verde de Agroecologia e Desenvolvimento Sustentável, v.7, p.109-118, 2012.
-
Summo, C. et al. Nutritional, physico-chemical and functional characterization of a global chickpea collection. Journal of Food Composition and Analysis, v.84, p.1-9, 2019. https://doi.org/10.1016/j.jfca.2019.103306
» https://doi.org/10.1016/j.jfca.2019.103306 -
Tas, O. et al. An investigation of functional quality characteristics and water interactions of navy bean, chickpea, pea, and lentil flours. Legume Science, v.4, p.03-09, 2022. https://doi.org/10.1002/leg3.136
» https://doi.org/10.1002/leg3.136 -
Upretee, P. et al. The role of seed characteristics on water uptake preceding germination. Seeds, v.3, p.559-574, 2024. https://doi.org/10.3390/seeds3040038
» https://doi.org/10.3390/seeds3040038
Edited by
-
Editors:
Toshik Iarley da Silva & Carlos Alberto Vieira de Azevedo