
 Mechanical component failure analysis: a case study of the design role for the truck suspension bracket
Abstract
In Brazil, poor road conditions and the significant reliance on road transport demand high performance from suspension systems, particularly in terms of economic efficiency and safety. Preventing failures in these components is crucial. However, product performance in practice does not always meet expectations, sometimes necessitating modifications during use. This article presents a case study involving failure analysis of a suspension component evaluated through accelerated vehicle testing. The component, made of high-strength low-alloy steel, was fabricated using gas metal arc welding. During durability testing, a liquid penetrant test revealed a crack near the weld toe. The component was immediately disassembled for a detailed failure investigation. Major imperfections were analyzed in accordance with ISO 5817. Hardness testing was conducted on the base metal and heat-affected zone. Mechanical properties, including yield strength, tensile strength, and elongation, were also verified. The study concluded that the failure was not attributable to the manufacturing process but rather to the high stress levels the component experienced. A potential solution was to update the component design. Reinforcement addition and finite element analysis calculations showed that the component would have an extended service life suitable for the application. Through these tests, the failure was identified and resolved efficiently, without requiring costly and time-consuming analyses.
Keywords:
failure analysis; fatigue; HSLA; HAZ; FEA.
1. Introduction
The Brazilian freight transport matrix is predominantly reliant on road transport, which accounts for approximately 60% of the total transported volume. This modal concentration results in several challenges, including inadequate road maintenance, progressive highway deterioration, and an elevated incidence of traffic accidents (Randoncorp, 2026). Given this reliance on road infrastructure, the design and performance requirements of vehicle suspension systems operating on Brazilian highways demand exceptional robustness. The suspension system’s primary functions encompass isolating the vehicle chassis from irregularities and roughness of the road surface; maintaining precise wheel alignment in terms of steering and camber relative to the road; responding effectively to tire-generated control forces-including longitudinal (traction and braking) and lateral (cornering) forces; mitigating chassis roll; and ensuring consistent tire-road contact with minimal variations in load distribution (Gillespie, 1992).
A new project is usually triggered by a need, an opportunity, or a problem that requires a structured and planned solution. Examples of projects include developing a new product or service, or implementing a new business process or procedure (Project Management Institute, 2021). Most computer-aided design (CAD) software allows part geometry to be encoded into solid models. The main advantage of working with a 3D solid model is that information regarding mass properties, moments of inertia, and cross-sectional properties at various locations of the part can be easily calculated. Solid modeling systems typically offer an interface with one or more finite element software for stress, vibration, and heat transfer analyses (Norton, 2020).
The application of high-strength low-alloy (HSLA) steel results in building structures and components that are thinner, lighter, yet stronger (Amraei et al., 2019). HSLA steel plates are widely used in the production of automotive components and auto parts. Their high strength enables the production of lighter components, which, according to the law of conservation of energy, reduce fossil fuel consumption and consequently decrease carbon dioxide emissions (Bayock et al., 2020). HSLA steel plates can be processed by gas metal arc welding (GMAW), one of the most widely used processes due to its high productivity and versatility (Caio et al., 2021).
An important and rigorous test applied to automotive components is fatigue testing, in which the component is subjected to multiple loading cycles and must withstand them without failure for a specified number of cycles, usually determined by the client (Tsutsumi et al., 2022). Fatigue failures are among the most common in automotive components and cause concern for engineers, particularly when welded components are involved. Fatigue failures typically initiate with a small crack, which may either arise from manufacturing defects or develop over time as a result of cyclic deformations around stress concentration regions (Norton, 2020). The causes are diverse, including residual stresses, geometric discontinuities, excessive gaps, internal and external surface defects in the weld bead, differences in mechanical properties between joined materials, and lack of penetration, among others. Notch effects are more detrimental when cyclic loading is present, which leads to the study of different weld bead shapes and welding techniques affecting the component lifecycle (Steimbreger et al., 2022). Cold cracking is commonly observed during the welding of HSLA steels due to the presence of micro-alloyed elements and thermal effects. At high cooling rates, martensite is likely to form, leading to cold cracks and strength reduction (Kumar et al.,2023).
The main failure criteria applied to ductile materials are the von Mises criteria (Maximum Distortion Energy Theory) and the Maximum Shear Stress criteria. For any point of a structural element, the maximum distortion energy per unit volume must be less than the distortion energy that produces the collapse of the material in a simple tensile test. For any point of a structural element, the maximum shear stress must be less than the shear stress that produces the collapse of the material in a simple tensile test (Groes, 2006). A good way to simulate stress before production is through finite element analysis (Kang and Kim, 2009; Abry et al., 2018).
Analyzing the failures that occur during testing, manufacturing, and service is an essential engineering process for the continual improvement in product reliability. The sequence of stages in a failure analysis is subject to variation depending on the nature of the failure (Becker and Shipley, 2002). This study combines the common stages of failure analysis suggested by ASM Handbook: Failure Analysis and Prevention to comprise a comprehensive investigation.
In general, discussions of failure analysis methods often focus on expensive equipment, such as scanning electron microscopy, which is not always accessible. This article presents a case study describing the procedure used for the failure analysis of a suspension bracket during vehicle durability testing. The tests performed included a liquid penetrant test (LPT), analysis of welding imperfections, microstructural characterization, hardness measurements, and material strength testing - all relatively simple and rapid methods - which were enough to identify the failure and propose improvements.
The article is structured as follows. Section 2 outlines the study’s methodology, describing general project steps, the procedures adopted during the manufacturing of the suspension component, introducing the vehicle, briefly explaining how the truck was tested, providing details of the suspension system, and presenting the tests performed to identify and analyze the failure. Section 3 presents the results, proposes a structural improvement based on FEA with fatigue life-cycle analysis, and concludes in Section 4.
2. Materials and methods
2.1 General project steps and component manufacturing
Figure 1 illustrates the flowchart of the steps used in the development of the suspension bracket analyzed herein.

In the design stage, a sketch of the part was created in PTC Creo 5.0, a computer-aided design (CAD) software. The first three-dimensional (3D) model must account for the steel plate thickness, weld beads, fasteners, and the chassis to which the component is assembled, to obtain the preliminary geometry required for structural calculation.
Once the initial 3D model is completed, the first structural FEA is solved. The results were evaluated using the von Mises and Maximum Principal Stress material strength theories. During this stage, many designs and FEAs interactions were carried out to achieve a geometry with acceptable stress levels. These simulations were performed using Abaqus software (Dassault Systèmes Americas). Automotive components are generally designed according to fatigue criteria, ensuring they withstand the most severe operating conditions without exhibiting cracks or damage, thereby guaranteeing maximum safety for passengers, drivers, and third parties. After having the geometry defined, the component was manufactured according to the design, using HSLA steel plates with a yield strength of 380 MPa according to ABNT NBR 6656. Sheet metals with thicknesses ranging from 6.35 mm to 8 mm were used. The manufacturing process involved laser cutting to obtain the geometry, followed by stamping and bending operations. The joints of the plates were performed using GMAW in a semi-automated process with CO2 gas. The filler metal used was ER70S-6. The front suspension bracket had a final mass of 12.5 kg, and is shown in Figure 2.

2.2 Vehicle characteristics and test conditions
The vehicle for which the bracket was designed is a truck similar to the one shown in Figure 3, which illustrates the rear suspension, with the front suspension bracket highlighted. The payload capacity of this vehicle is 14,000 kg, distributed as 4 tons on the front axle and 10 tons on the rear axles.

The vehicle was then loaded with the specified axle loads and prepared to begin the durability test. Due to the high cost of such testing, multiple new components are evaluated simultaneously. It would be infeasible to conduct a test of this complexity to validate a single part. There are other ways to validate an automotive component, such as multiaxial fatigue testing, in which hydraulic actuators simulate loads on components in a laboratory. In this study, vehicle durability testing was performed.
The vehicle must complete 39.000 km over special tracks, such as Belgian blocks, cobblestones, body twist, washboard, potholes, and an off-road circuit. During the test, inspections were performed frequently. Components must withstand the test without structural damage; otherwise, they are removed for analysis.
2.3 Experimental procedure
At 46% of the durability test (17.940 km), a vehicle inspection was scheduled. The liquid penetrant test (LPT) was performed on the suspension brackets in accordance with standard NBR 8407. First, the surfaces were thoroughly cleaned to remove paint, protective layers, oxides, sand, grease, oil, dust, or any residues that could prevent the liquid penetrant from entering discontinuities. The liquid penetrant was then applied and left for 30 minutes to ensure total penetration. Afterward, the excess liquid penetrant was removed, and the developer liquid was applied to the suspension bracket surfaces. This test revealed a crack near the weld toe on the left-hand front suspension bracket. The tests carried out in this study aimed to identify the origin of the failure, whether it was due to the material, process, or design.
Four samples were removed from the cracked bracket for the macrostructural analysis. The samples were sanded with 80 and 240-grit sandpaper using water. After sanding, the samples were etched with a chemical reagent to reveal the weld. This etching was performed by submerging the sanded region in Nital 30% solution for 1 minute. Afterward, the etched region was washed with water, then with alcohol. For the analysis of the weld macrostructure, the Metalab Weld Inspector software was used, which consists of a camera connected to a computer.
The microstructure of the crack region was analyzed. The sample was polished and then etched with Nital 3%. An Olympus GX53 optical microscope with an integrated camera was used. Images of the crack region were obtained using the Digimet Plus 5G software.
Hardness measurements were also performed on the base material (BM), heat-affected zone (HAZ), and weld metal (WM). The samples were polished to ensure measurement accuracy. The microhardness tester Future-Tech FM-800 was used with magnifying lenses to define the region to be measured. The force applied was 300 gf during 15 seconds.
To assess the HSLA steel plate, a tensile test was carried out using an EMIC universal testing machine with a capacity of 200.000 N.
3. Results and discussions
Ten minutes after applying the LPT developer, the crack extending from point 1 to point 2 was detected on the left-hand front suspension bracket, as shown in Figures 4 and 5. The bracket was removed for detailed analysis and replaced with a new one so that the testing was not interrupted. Four points were defined for sample removal: points 1 and 2, where cracks were identified, and points 3 and 4, on the opposite side of points 1 and 2, where no cracks were observed.


Figure 6 shows the destructive test and the results obtained from the samples removed from points 1-4. After etching with the chemical reagent, the WM and HAZ acquire a more grayish, matte color than the BM, providing an easy, clear visualization of the weld penetration. The images were captured at 6x magnification.

The weld throat specified in the design is 5 mm, and the plate thickness is 8 mm in this joint. These characteristics are essential to define the imperfection dimensions that might be expected in welding fabrication. The main surface and internal imperfections according to ISO 5817 (ISO, 2014) were analyzed, including cracks, crater cracks, surface pores, end crater pipes, undercuts, shrinkage grooves, convexity, penetration, overlap, asymmetry, root concavity, root porosity, throat thickness, lack of penetration, and incorrect root gap. This International Standard provides three quality levels in order to permit application to a wide range of welded fabrication. They are designated by symbols B, C, and D, with level B being the highest requirement on the finished weld. The design of the bracket analyzed in this study requires a quality level of C.
Figure 6(a) shows the weld analysis at point 1, a) nominal throat thickness, 5.342 mm; b) effective throat thickness, 6.482 mm; c) Z1 leg length, 7.833 mm; d) Z2 leg length, 7.222 mm; e) penetration 1, 1.278 mm; f) penetration 2, 0.833 mm; g) root gap, 0.556 mm; and h) crack length, 5.844 mm. The crack was evidenced, and it is not acceptable according to this standard. The arrow identifies the crack. Other evaluated imperfections were not detected or remained within acceptable limits for quality level C.
Figure 6(b) shows the weld analysis at point 2: a) 5.355 mm; b) 5.735 mm; c) 7.055 mm; d) 8.001 mm; e) 0.667 mm; f) 0.835 mm; g) 0.5 mm; and h) 6.849 mm. The crack was evident and it is not acceptable. The arrow identifies the crack. Other evaluated imperfections were not detected or were within the acceptable limits according to quality level C.
Figure 6(c) shows the weld analysis at point 3: a) 6.05 mm; b) 6.835 mm; c) 8.393 mm; d) 8.611 mm; e: 1.444 mm; f: 1.501 mm; g: 0.503 mm. No imperfections were identified.
Figure 6(d) shows the weld analysis at point 4: a: 4.4 mm; b: 5.5 mm; c: 6.39 mm; d: 7.45 mm; e) 1.723 mm; f) 1.615 mm; and g) 0.778 mm. No imperfections were identified. The weld throat measured is below the throat thickness specified in the design. However, it is within the acceptable limits for the specified weld quality level.
Subsequently, a micrograph of the crack region was performed (Figure 7). The microstructure is predominantly bainite.

Figure 8 shows the microhardness results at Point 1. Three measurements were taken at BM, HAZ, and WM.
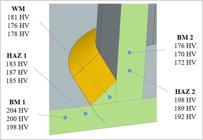
The hardness results were used to estimate the tensile strength (TS) according to ISO 18265. Table 1 shows the conversion for unalloyed and low-alloyed steels. Because the standard materials compared are not identical to the material applied on bracket, these TS would serve only as an indicator.
Tension testing of BM was performed according to ASTM E 8/E 8M. The specimen was extracted in the transverse direction relative to the plate-rolling direction, at the quarter-width position in the hot-rolled plate. The specimen was extracted from the same sheet metal used to fabricate the bracket component in which the crack occurred. Equation (1) and (2) refer to specimen dimensions, which the gauge length (GL) is proportional to transversal area (So). Where, W is the width and t is the plate thickness. For this specimen was used W =20 mm and t =8 mm.
Figure 9 illustrates the specimen design.

The BM yield strength, tensile strength, and elongation are shown in Table 2.
The results are in accordance with ABNT NBR 6656, which stipulates specifications for 380 MPa grades: YS from 380 to 530 MPa, TS from 460 to 600 MPa and minimum elongation of 23%. Comparing the TS in Table 2 with the mean TS in Table 1, it is possible to identify a 30% difference for BM1 and 12% for BM2, both being the standard values with the highest hardness.
An automotive component - the case of this study - must not fracture during its entire lifecycle. As a result, crack surface and growth were not investigated. When the crack was observed during the durability test, these analyses were conducted to identify the root cause. There were no manufacturing or material defects, so a solution would be to improve the bracket geometry to reduce the stresses. As such, a fracture surface investigation would provide information such as the crack initiation site; crack propagation direction; the load conditions (monotonic or cyclic); fabrication imperfections that influenced crack initiation and/or crack propagation; and morphological data for correlating the crack growth with stress variations using the Paris´ law.
3.1 Design review
The analyses carried out so far have not revealed any manufacturing problems or material defects that could have caused the crack. Thus, the focus was on reinforcing the support because the stresses in the durability test are high. For the component redesign, the CAD software was used again. Figure 10 shows the original and the new bracket. Figure 10(e) shows a C-profile reinforcement measuring 124 x 112 mm that was added to the upper region of the bracket, increasing the component stiffness. Figure 10(f) presents the second modification. The original sheet plate was extended by 24 mm, with a profile including two fillets to increase weld length and reduce stress concentration at the weld toe. The reinforced bracket had a final mass of 13.6 kg, 1.1 kg heavier than the original.

Subsequently, FEA was performed. The results are presented comparatively for the original and the reinforced bracket, shown in Figures 11 and 12, respectively. The images represent the stresses according to von Mises (vM) and Maximum Principal Stress (S1) criteria. The mesh was composed of quadratic shell elements, primarily quadrilateral, with a size of 10 x 10 mm. Static loads were applied.


At the failure point, the original bracket showed a stress of 233 MPa, which was reduced to 138 MPa in the reinforced design, according to von Mises theory. A reduction in stress in other regions of the component was also noted. Many CAD and FEA analyses were performed in order to achieve a promising geometry for the reinforced bracket. The FEA using static loads is a fast analysis, but it does not substitute for the fatigue analysis to estimate the lifecycle.
3.2 Fatigue lifecycle
With a reinforced bracket geometry defined, the fatigue lifecycle was performed. A triaxial rosette strain gauge was placed near the failure on the original design bracket. (Figure 13). The gauge was named R13. It was not possible to instrument at the exact location where the failure occurred because this region corresponds to the transition between the weld and the plate, where no flat surface was available for gauge installation. Therefore, in this case, it was necessary to calculate an extrapolation factor from the gauge location to the failure location.

Data acquisition was performed during the durability test. Figure 14 shows the recorded stresses over time. The stresses in the three strain gauge directions can be observed, as well as the maximum principal, minimum principal, and von Mises stresses.

To obtain the correlation factor between gauge R13 and the failure location in the original bracket, FEA stress results were used. In Figure 15(a), the stress at the location of gauge R13 is 162 MPa, whereas at the failure point, this value is 248 MPa. Therefore, a multiplication factor of 1.53 was applied to the data acquisition measured at gauge R13. Subsequently, the stresses in the reinforced bracket were identified for the same locations, as shown in Figure 15(b). The second signal multiplier factor was calculated to translate the R13 signal to the reinforced bracket at the same point where the crack occurred on the original bracket. This factor is the result of 128/162 MPa x 146/128 MPa, yielding a value of 0.9.

Afterward, the theoretical material curve (Figure 16) was defined for the region where the failure occurred in the original bracket. The stress level at 103 cycles was defined by 90% of the BM tensile strength (Table 2). A stress level of 83.5 MPa at 106 cycles was defined so that failure would occur at 46% of the durability test (17.940 km), when the crack was observed. This is a theoretical S-N curve specific to the problem under investigation, taking into account the stress spectrum that the original bracket was subjected to during the test. Although it is not a conventional S-N curve derived from specimen tests, it provides a reliable approximation curve for the fatigue life comparison that will be performed with the reinforced bracket.

Using nCode Designlife software (HBK, Darmstadt, Germany), the rainflow counting method was applied, and, considering the Goodman mean stress correction, the S-N curve was used to predict the original and reinforced bracket damage. Figure 17 shows the comparative damage. The damage scale in the reinforced bracket is approximately one order of magnitude smaller. Each column in these charts represents the number of cycles that occurred within a combined interval of stress ranges and mean stresses, and the height of the column corresponds to the damage value. To define the size of this stress interval, the maximum stress obtained was divided into 64 stress bins.

The highest damage value occurred during cycles of the highest range stress for both brackets. The original bracket showed maximum ranges exceeding 500 MPa, and the reinforced bracket showed maximum ranges above 300 MPa. The central part of the graph shows the damage caused by the lower average stress. In the original bracket, these stresses were between 170 and 400 MPa, and in the reinforced bracket, between 170 and 230 MPa. In both charts, stress ranges below approximately 170 MPa do not produce damage, since these stress values are below the threshold at which damage begins to occur according to the material’s fatigue curve adopted in this study.
The damage total was obtained as shown in Table 3. The damage was also expressed in kilometers of durability testing.
The reinforced bracket would increase the fatigue lifecycle by 1625%, a sufficient value to approve the front suspension bracket, which had previously failed at 46% of the test (17.940 km). Therefore, it was not necessary to repeat the vehicle durability testing.
4. Conclusions
The LPT proved effective, enabling the identification of the crack in the component during the vehicle inspections.
Welding analysis at points 1-4 was in accordance with the project's specified standard, except for the crack at points 1 and 2.
The microstructure in the crack region is predominantly bainite. No martensite was found.
Hardness measurements on the BM, HAZ, and WM yielded values as expected, not high enough to indicate that a martensite microstructure is present.
BM analysis resulted in yield strength, tensile strength and total elongation in accordance with the material specified in the design.
FEA showed that modifications to the bracket geometry significantly reduced the stress at the location where failure was observed. Fatigue analysis showed that the reinforced bracket damage is significantly lower and that it would withstand the full durability test.
Based on all tests carried out in this study, it was possible to identify the failure, analyze it, and conclude that it occurred due to the high stresses of the durability test. Virtual fatigue analysis enabled approval of the reinforced bracket without repeating the vehicle durability test, avoiding extra development costs.
Funding information
Data availability
Datasets related to this article will be available upon request to the corresponding author.
References
-
ABRY, J.; MITTELHAEUSER, C.; WOLF, S.; TURLIER, D. Enhanced fatigue structural stress analysis of a heavy vehicle seam welded steel chassis frame: FEA model preparation, weld model description, fatigue stress calculation and correlation with 10 year operating experience. Procedia Engineering, v. 213, p. 539-548, 2018. DOI: 10.1016/j.proeng.2018.02.050.
» https://doi.org/10.1016/j.proeng.2018.02.050. -
AMRAEI, M.; AHOLA, A.; AFKHAMI, S.; BJÖRK, T.; HEIDARPOUR, A.; ZHAO, X. L. Effects of heat input on the mechanical properties of butt-welded high and ultra-high strength steels. Engineering Structures, v. 198, n. 109460 p. 1-13, 2019. DOI: 10.1016/j.engstruct.2019.109460.
» https://doi.org/10.1016/j.engstruct.2019.109460. - ASSOCIAÇÃO BRASILEIRA DE NORMAS TÉCNICAS. ABNT NBR 6656: bobinas e chapas laminadas a quente de aço acalmado com características especiais de propriedades mecânicas, conformabilidade e soldabilidade - requisitos. Rio de Janeiro: ABNT, 2016.
-
BAYOCK, F. N.; KAH, P.; SALMINEN, A.; BELINGA, M.; YANG, X. C. Feasibility study of welding dissimilar Advanced and Ultra High Strength Steels. Reviews on Advanced Materials Science, v. 59, n. 1, p. 1-14, 2020. DOI: 10.1515/rams-2020-0006.
» https://doi.org/10.1515/rams-2020-0006. - BECKER, W. T.; SHIPLEY, R. J. ASM handbook: failure analysis and prevention. Materials Park: ASM International, 2002. v. 11.
-
CAIO, L. B. A.; SILVA, A. M. A.; BESTARD, G. A.; VIEIRA, L. S.; CARVALHO, G. C.; ALFARO, S. C. A. Mild steel GMA welds microstructural analysis and estimation using sensor fusion and neural network modeling. Sensors, v. 21, n. 16, p. 5459, 2021. DOI: 10.3390/s21165459.
» https://doi.org/10.3390/s21165459. - GILLESPIE, T. D. Fundamentals of vehicle dynamics. Warrendale: SAE International, 1992.
- GROES, A. G. Resistência dos materiais e vasos de pressão. São Leopoldo: Editora Unisinos, 2006.
- INTERNATIONAL ORGANIZATION FOR STANDARDIZATION. ISO 5817: welding - fusion-welded joints in steel, nickel, titanium and their alloys (beam welding excluded) - quality levels for imperfections. Geneva: ISO, 2014.
- INTERNATIONAL ORGANIZATION FOR STANDARDIZATION. ISO 18265: metallic materials - conversion of hardness values. Geneva: ISO, 2013.
-
KANG, W. J.; KIM, G. H. Analysis of manufacturing effects on fatigue failure of an automotive component using finite element methods. Fatigue & Fracture of Engineering Materials & Structures, v. 32, n. 8, p. 619-630, 2009. DOI: 10.1111/j.1460-2695.2009.01368.x.
» https://doi.org/10.1111/j.1460-2695.2009.01368.x. -
KUMAR, H.; PRASAD, R.; KUMAR, P.; DEO, M. Microstructural and mechanical properties of GMAW welded 572 GR 50 steel. Materials Today: Proceedings, 2023. DOI: https://doi-org.ez348.periodicos.capes.gov.br/10.1016/j.matpr.2023.06.104
» https://doi-org.ez348.periodicos.capes.gov.br/10.1016/j.matpr.2023.06.104 - NORTON, R. L. Machine design: an integrated approach. 6. ed. Worcester: Pearson, 2020. 1089p.
- PROJECT MANAGEMENT INSTITUTE. A guide to the project management body of knowledge. 7. ed. Project Management Institute, 2021. 250p.
-
RANDONCORP. Evolução do transporte de carga no Brasil. Disponível em: https://blog.randoncorp.com/transporte-de-carga-no-brasil Acesso em: 08 maio 2026.
» https://blog.randoncorp.com/transporte-de-carga-no-brasil -
STEIMBREGER, C.; GUBELJAK, N.; VUHERER, T.; ENZINGER, N.; ERNST, W.; CHAPETTI, M. Effect of welding processes on the fatigue behaviour of ultra-high strength steel butt-welded joints. Engineering Fracture Mechanics, v. 275, n. 108845, 2022. DOI: https://doi.org/10.1016/j.engfracmech.2022.108845
» https://doi.org/10.1016/j.engfracmech.2022.108845 -
TSUTSUMI, S.; FINCATO, R.; LUO, P.; SANO, M.; UMEDA, T.; KINOSHITA, T.; TAGAWA, T. Effects of weld geometry and HAZ property on low-cycle fatigue behavior of welded joint. International Journal of Fatigue, v. 156, n. 106683, p. 1-11, 2022. DOI: 10.1016/j.ijfatigue.2021.106683.
» https://doi.org/10.1016/j.ijfatigue.2021.106683.


