Analysis of the rheological and mechanical properties of three commercial self-leveling mortars
Abstract
The objective of this study was to evaluate three commercially available self-leveling mortars. Mixing was performed using a Pheso rheometer, which enabled the assessment of mixing efficiency. In the fresh state, the evaluated properties included fluidity, spreadability, rheological parameters, and regeneration time. In the hardened state, flexural tensile strength, compressive strength, and dynamic modulus of elasticity were measured. The results revealed significant variations in mixing efficiency, influenced by the physical characteristics of the mortars. Among all the fluidity and spread tests, the time measured using the Spanish cylinder exhibited the strongest and most consistent correlations. This greater precision was supported by the number of significant relationships observed across physical, mixing, and rheological parameters. The variations found among the mortars demonstrate that each formulation exhibits distinct characteristics, including variations in regeneration time. For example, mortar 1, with a shorter regeneration time, exhibited higher yield stresses and viscosity, with greater flexural strength. This finding highlights that the absence of specific Brazilian standardization require the users of this mortar type to have good knowledge about the material properties to ensure correct application and compliance with project specifications.
Keywords
Self-leveling mortar; Fluidity; Spreadability; Rheological properties; Mechanical properties
Resumo
O objetivo deste trabalho foi avaliar três argamassas autonivelantes industrializadas comercializadas. A mistura das argamassas foi realizada no reômetro Pheso permitindo avaliar a eficiência de mistura. As propriedades no estado fresco avaliadas foram: fluidez, espalhamento, parâmetros reológicos e tempo de regeneração. No estado endurecido foram avaliadas resistência à tração na flexão, resistência à compressão e módulo de elasticidade dinâmico. Os resultados mostraram variações entre as eficiências de mistura sendo influenciada pela característica física das argamassas. Observou-se na avaliação de fluidez e espalhamento, que o tempo obtido pelo cilindro espanhol demonstrou as correlações mais fortes e consistentes. Essa maior precisão é comprovada pelo número de relações significativas observadas, abrangendo parâmetros físicos, de mistura e reológicos. As variações observadas entre as argamassas indicam que cada formulação possui características únicas, inclusive com tempo de regeneração distintos. Por exemplo, a argamassa 1, com menor tempo de regeneração, apresentou maiores tensões de escoamento e viscosidade, com maior resistência à flexão. Essa constatação destaca que a ausência de uma norma brasileira específica, exige que os usuários compreendam completamente as propriedades do material para garantir a aplicação correta e a conformidade com as especificações do projeto.
Palavras-chave
Argamassa autonivelante; Fluidez; Espalhamento; Propriedades reológicas; Propriedades mecânicas
1 Introduction
The demand for construction industrialization and sustainable development drives new products to emerge. In this context, regarding horizontal sealing systems, self-leveling mortars stand out as a solution for subfloor leveling. Self-leveling mortars are presented as an efficient solution, streamlining and systematizing construction projects by providing flat, leveled, and durable surfaces, thus combining technology, innovation, and practicality.
The first self-leveling compounds were developed in Finland during the 1970s and soon gained widespread application in Sweden in the following decade (Rubin, 2015). Interest in these materials later spread across Europe, with Spanish companies introducing them commercially around 1999 (Martins, 2009). In Brazil, self-leveling mortars remain relatively recent, with research and industrial adoption intensifying only after 2008. Despite their increasing use in this country there is still lack of specific technical standards and defined minimum performance requirements (Silva et al., 2022).
Self-leveling mortars and self-compacting mortars, though both characterized by high flowability, differ fundamentally in their intended applications and rheological behavior. While both materials exhibit high fluidity, self-compacting mortars are formulated for vertical or confined applications, such as repair mortars, grouts, or renders. These materials are designed to fill molds or spaces without external vibration, relying instead on their intrinsic ability to flow and consolidate under their own weight. However, self-compacting mortars possess higher viscosity and structural stability to prevent segregation and bleeding during placement.
In contrast, self-leveling mortars are intended for horizontal applications, such as floors and subfloors, where they can spread uniformly and achieve compaction solely under the action of gravity, without segregation (Rubin, 2015). Self-leveling mortars produce smooth, planar surfaces without the need for mechanical vibration. Their rapid and pumpable application ensures high homogeneity, reduces manual labor, and significantly accelerates the finishing stages of construction compared with traditional screed systems (Mendes; Effting; Schackow, 2019). Moreover, they exhibit very low viscosity and yield stress (Brasileiro, 2023), providing excellent fluidity while maintaining sufficient cohesion to prevent segregation.
These mortars are essential for preparing subfloors, correcting irregularities, and providing an ideal base for thin coverings such as vinyl, wood, or ceramic flooring. Given the global expansion of the vinyl flooring market (Mordor Intelligence, 2024), the importance of self-leveling mortars in ensuring dimensional stability and surface quality has become increasingly evident.
To achieve suitable performance, self-leveling mortars require precise control over formulation and material selection. Combining adequate rheology for self-compaction with necessary mechanical strength and stability in the hardened state presents a design challenge. Consequently, the careful optimization of the binder composition, aggregate composition, and chemical admixtures is essential (Freitas et al., 2010). The most important technical properties for this material include self-leveling ability, low viscosity, fast setting and drying, high early strength gain, dimensional stability, and strong adhesion (Seifert; Neubauer; Goetz-neunhoeffer, 2012).
Despite the relevance of these parameters, Brazilian technical regulation for self-leveling mortars remains limited. Currently, NBR 16765 (ABNT, 2019) is the sole national standard applicable to self-leveling screeds, yet its scope is limited to gypsum-based systems, effectively excluding cement-based mortars. Other standards, such as NBR 13281 (ABNT, 2023), which specifies general requirements for rendering and adhesive mortars, and NBR 13279 (ABNT, 2005a), which defines flexural and compressive strength tests, do not encompass the specific rheological and flow properties of self-leveling mortars in their fresh state. Furthermore, the successful execution of floor systems, often regulated by NBR 13753 (ABNT, 1996), depends directly on the planarity achieved through self-leveling mortar application, referred to as the leveling layer.
In the absence of comprehensive national regulations, researchers and industry professionals in Brazil rely on international standards, notably C1708 (ASTM, 2016) and UNE-EN 13813 (AENOR, 2014), which specify test methods for evaluating flowability, setting time, rheology, and mechanical performance. This regulatory gap compromises quality control, hampers product comparability among manufacturers, and restricts technological innovation in the sector.
Given the growing importance of self-leveling mortars and the lack of specific Brazilian guidelines, this study aims to evaluate and compare the rheological and mechanical properties of three commercially available self-leveling mortars from different suppliers.
2 Materials and experimental program
This section presents the materials and test methods used to evaluate the self-leveling mortars in both fresh and hardened states.
2.1 Materials
The three selected self-leveling mortars were designated as mortar 1, mortar 2, and mortar 3, and were characterized by the specific gravity of the dry mortar, following NM 23 (ABNT, 2001) and by particle size distribution using laser diffraction. The measurements were performed using a Cilas 1064 laser diffraction particle size analyzer. The results, illustrated in Table 1 and Figure 1, demonstrate that each self-leveling mortar type exhibits a distinct particle size distribution.
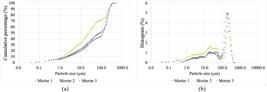
Particle size distribution by laser diffraction of three types of mortar: (a) cumulative percentage versus particle size and (b) histogram versus particle size
In the laser diffraction particle size analysis of self-leveling mortars, the parameters d10, d50, d90, and d100 describe the cumulative particle size distribution, presented in Table 1. The cumulative distribution represents the diameters which 10%, 50%, and 90% of the particles (by volume) are smaller, respectively. These values delineate the finest fraction (d10), the typical size (d50), and the coarser fraction (d90) of the sample. Additionally, the average diameter provides a volume-weighted mean size. The residue (%) indicates the proportion of particles that remain above the measurable range or are insufficiently dispersed, often reflecting agglomeration or oversized particles. Together, these parameters describe the fineness and uniformity of particle size of the self-leveling mortars.
Based on the parameters D10, D50, D90, and the average diameter (Table 1), as well as the particle size distribution curve (Figure 1), it can be observed that mortar 2 exhibits the finest particle size distribution. Mortar 1 and mortar 3 show similar characteristics to each other.
2.2 Self-leveling mortar preparation
Prior to the preparation of the self-leveling mortars, it was essential to adhere strictly to the manufacturer's recommendations (obtained from the product packaging or technical datasheet) to ensure the technical specifications of each product were met. Table 2 details these key specifications, encompassing the water volume needed to prepare 20 kg of dry materials, the usable pot life after mixing (period of use), the maximum recommended application thickness and the light re-traffic time.
Each batch of self-leveling mortar was prepared using 8 kg of dry mix. The specific amounts of water added were 1.76 L for Mortar 1 (resulting in a water-to-dry-materials ratio of 0.22), 1.60 L for Mortar 2 (ratio of 0.20), and 1.68 L for Mortar 3 (ratio of 0.21), respectively.
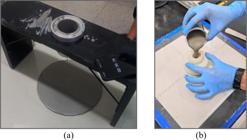
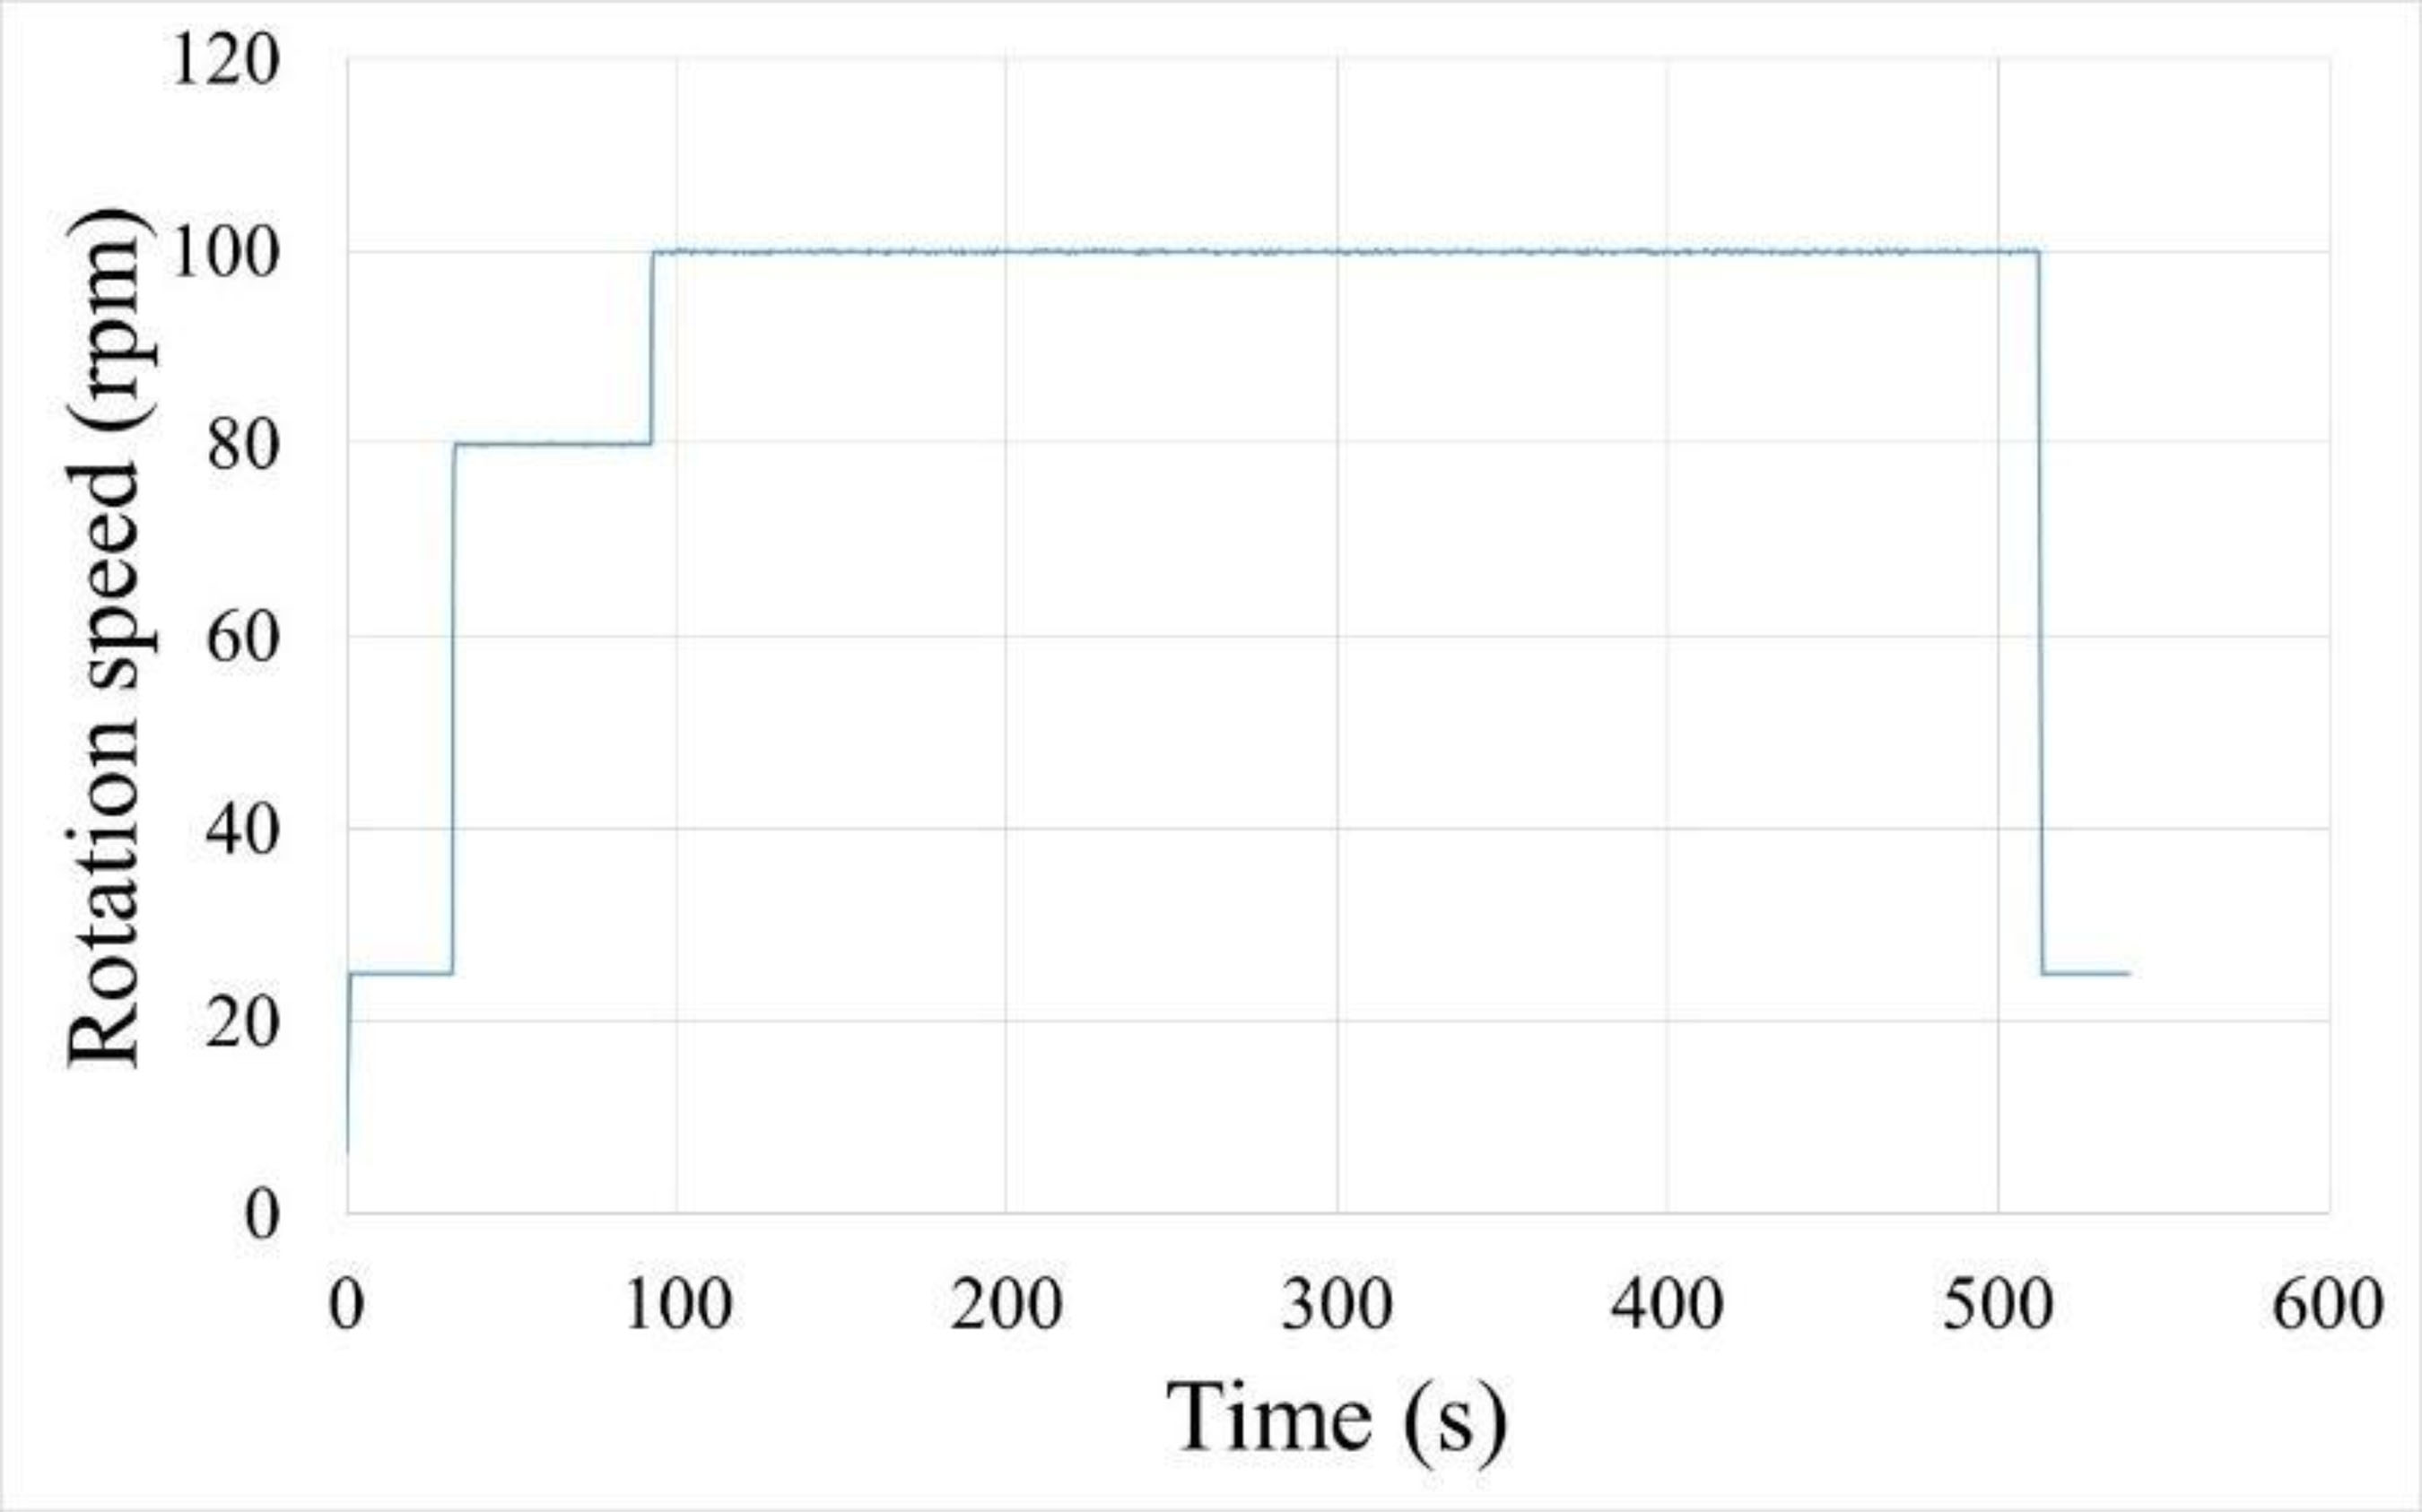
Each self-leveling mortar was mixed in a Pheso Rheometer equipped with an Attritor geometry (Carvalho et al., 2024) (Figure 2a) to evaluate mixing efficiency during homogenization. The process lasted 540 seconds. Water was gradually added between the 100 and 200 second marks, with the remaining time dedicated to homogenizing the mortar. It is important to note that the dry materials were mixed and homogenized during the first 100 seconds. Figure 3 shows the speed cycle (rpm) over time, used for mixing the mortars, which allowed the evaluation of mixing efficiency. During this phase, it was possible to observe several parameters, described by Brasileiro (2023), such as the maximum torque reached (related to the equipment's maximum power), the mixing energy (calculated by the area under the curve, representing the total energy consumed in the process), and the time to reach the plateau (indicating the point at which the system achieves homogeneity).
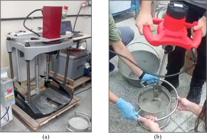
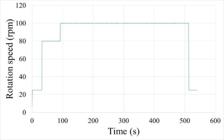
Following the completion of the mixing in the rheometer, the self-leveling mortar was immediately transferred and mixed for an additional 90 seconds in a mortar mixer (Figure 2b) to ensure full homogenization. Subsequently, the fresh self-leveling mortar properties were evaluated as described in Section 2.3.
2.3 Fresh state evaluation
After preparing the mortar, fresh state properties were evaluated, including rheological parameters, fluidity, spread, and healing time.
2.3.1 Rheological parameters
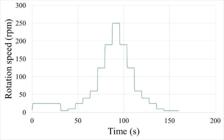
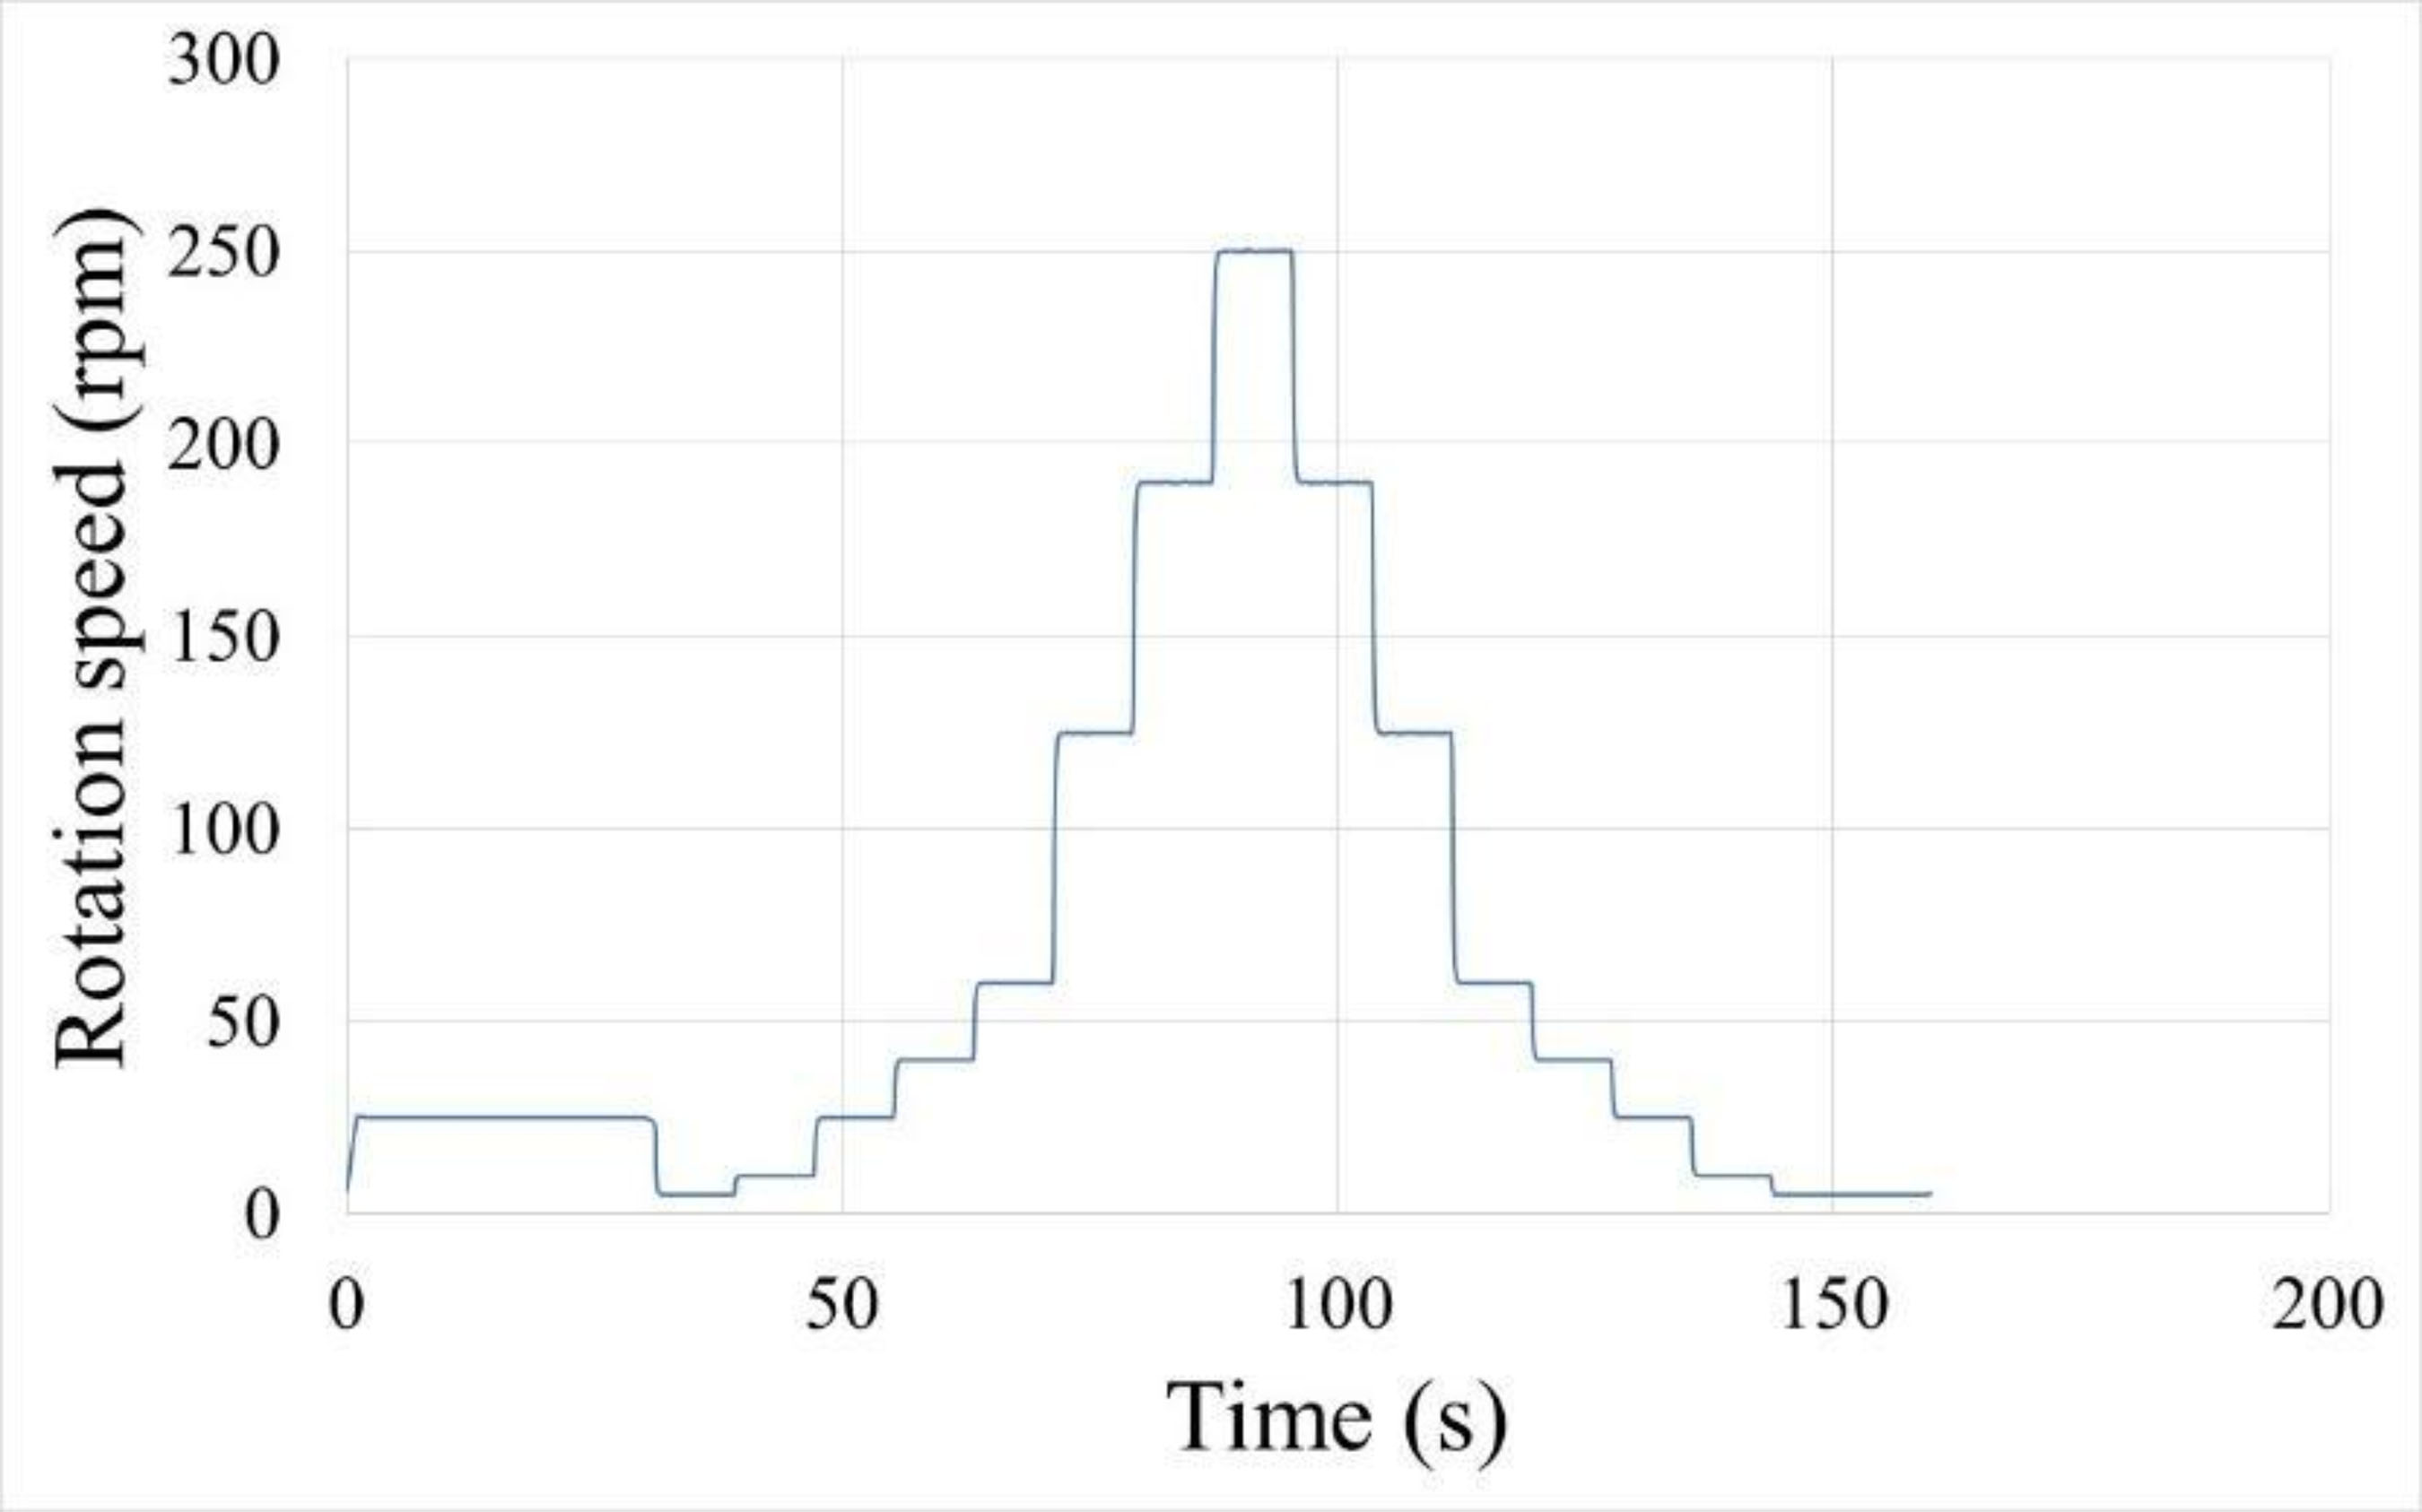
The first rheological characterization of the self-leveling mortar was performed using rotational flow tests on the Pheso rheometer immediately after mixing. The flow test protocol, shown in Figure 4, began with a pre-shear stage of 30 seconds at a rotational speed of 25 rpm. Following the pre-shear, two cycles of increasing and decreasing rotational speeds were performed. Each cycle plateau lasted 8 seconds and included the following sequential speed values (in rpm): 5, 210, 25, 40, 60, 125, 190, and 250. Torque values were continuously recorded throughout the test to characterize the material's rheological behavior.
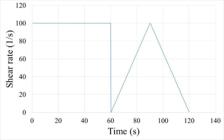
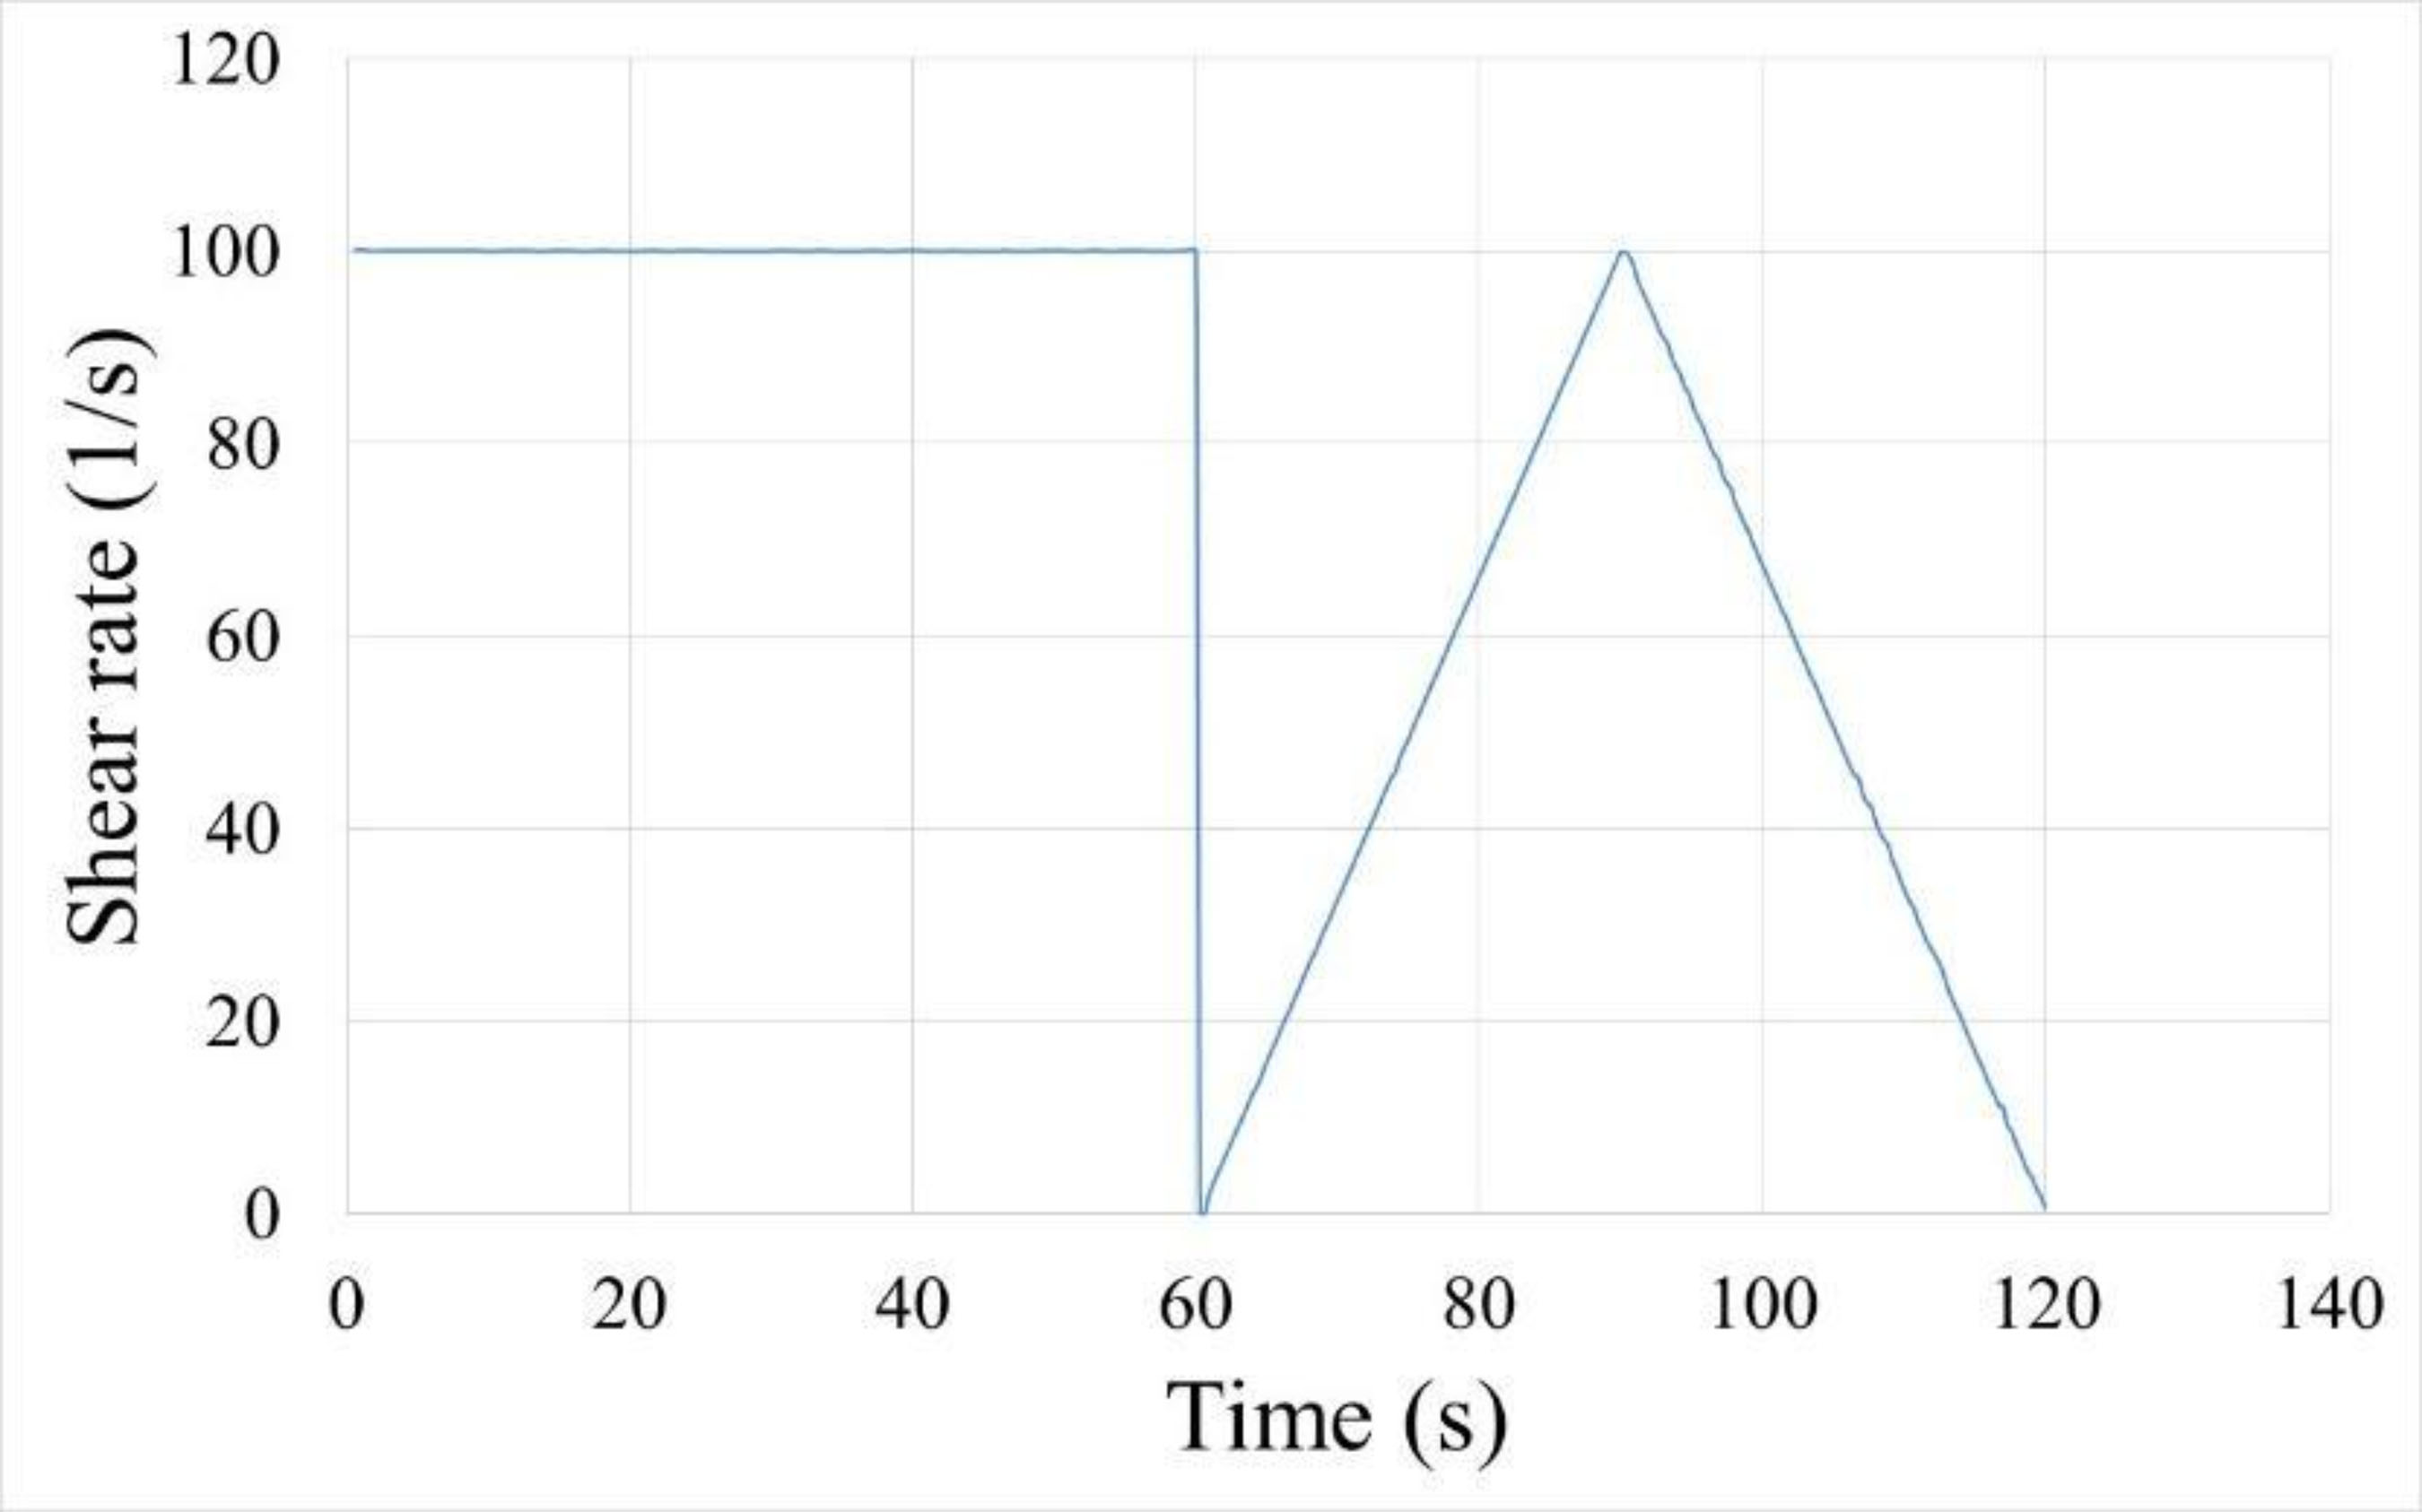
Due to the complex geometry of the Pheso rheometer, the direct determination of fundamental rheological parameters (shear stress and shear rate) was not feasible. Therefore, a flow test was performed using a Haake Mars 40 rotational rheometer equipped with a concentric cylinder geometry to determine the shear stress at a given shear rate. This measurement was carried out approximately five minutes after testing the mortars with the Pheso rheometer. A 25 mL sample was tested with an 11 mm gap at a controlled temperature of 23 °C ± 0.1 °C. First, a pre-shear was applied at a shear rate of 100 s⁻¹ for 60 seconds. The sample was then subjected to an acceleration cycle (ramp-up) from a shear rate of 0.1 s⁻¹ to 100 s⁻¹, followed by a deceleration cycle (ramp-down) from 100 s⁻¹ to 0.1 s⁻¹. (Figure 5). The rheological parameters, including yield stress were determined by the deceleration cycle using Herschel-Bulkley model and the plastic viscosity was determined at the highest shear rate. The hysteresis area (torque difference between acceleration and deceleration), which indicates the dispersion state of the mortar (França; Cardoso; Pileggi, 2012), was also determined.
The second rheological characterization consisted of evaluating the self-levelling mortars using the oscillatory method, which is an ideal technique for assessing the kinetics of cement hydration without disturbing the continuously developing microstructure (Betioli et al., 2009). This is achieved by applying small deformations that effectively keep the material in an undisturbed state. The method has been widely used to investigate the rheological evolution of cementitious materials, from the initial mixing stage through the setting process (Winnefeld; Holzer, 2003; Betioli, 2007). It has also been applied to polymeric adhesive mortars (Modler; Mohamad; Lubeck, 2025) and to self-levelling underlayments based on ettringite binders (Lam, 2021).
To study the initial structuring of the mortar, a sample was prepared to be as uniformly dispersed as possible. A high-efficiency mixer operating at 10,000 rpm was used for this purpose. The mixing procedure involved first adding all the water, followed by the anhydrous mortar. The mixture was initially stirred manually for 30 seconds before being mixed in the high-efficiency mixer for 70 seconds.
First, a sample was prepared with 220g of anhydrous mortar and the manufacturer's recommended water-to-dry-materials ratio: Mortar 1 (0.22), Mortar 2 (0.20), and Mortar 3 (0.21). Additionally, a second set of samples for all mortars was prepared using a fixed ratio of 0.20 for comparative analysis.
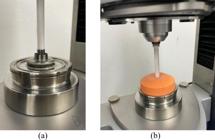
Rheological tests began five minutes after the initial contact between water and anhydrous mortar. A Haake Mars 40 rotational rheometer with a plate-to-plate geometry (Figure 6a) was used, following the same geometry adopted by Betioli (2007), Lam (2021), and Modler, Mohamad and Lubeck (2025). The setup included serrated test plates with a 35 mm diameter and a 1.0 mm gap. A plastic apparatus with a solvent trap was employed to enclose the specimen and minimize water evaporation (Figure 6b). All tests were conducted at temperatures between 22 °C and 23 °C.
A time sweep test was conducted at a critical strain of 10−4 and a constant frequency of 1 Hz for approximately 90 minutes. The critical strain value was selected based on prior research by Romano et al. (2021) and Modler, Mohamad and Lubeck (2021) to maintain the sample within the Linear Viscoelastic (LVE) range.
Based on data directly acquired from the rheometer, the elastic component (G’) and the shear stress were evaluated throughout the test period. An additional parameter, the Elasticity Factor (EF), was evaluated as the proportion of elastic energy developed during the test. This factor, as proposed by Modler, Mohamad and Lubeck (2021), shows that the imposed deformation is divided into an elastic component (related to G′) and a viscous component (related to G′′) as shown in Equation 1:
Where:
EF is the Elasticity Factor (Pa/ Pa);
G′ is the elastic component (Pa); and
G′′ is the viscous component (Pa).
Modler, Mohamad and Lubeck (2021) explain that this parameter makes it possible to observe the material's transformations. They noted that with a continuous increase in shear stress, the material's behavior shifted over time, characterized by a progressive gain in elastic energy and a loss of viscous energy.
2.3.2 Fluidity, spread, and healing time
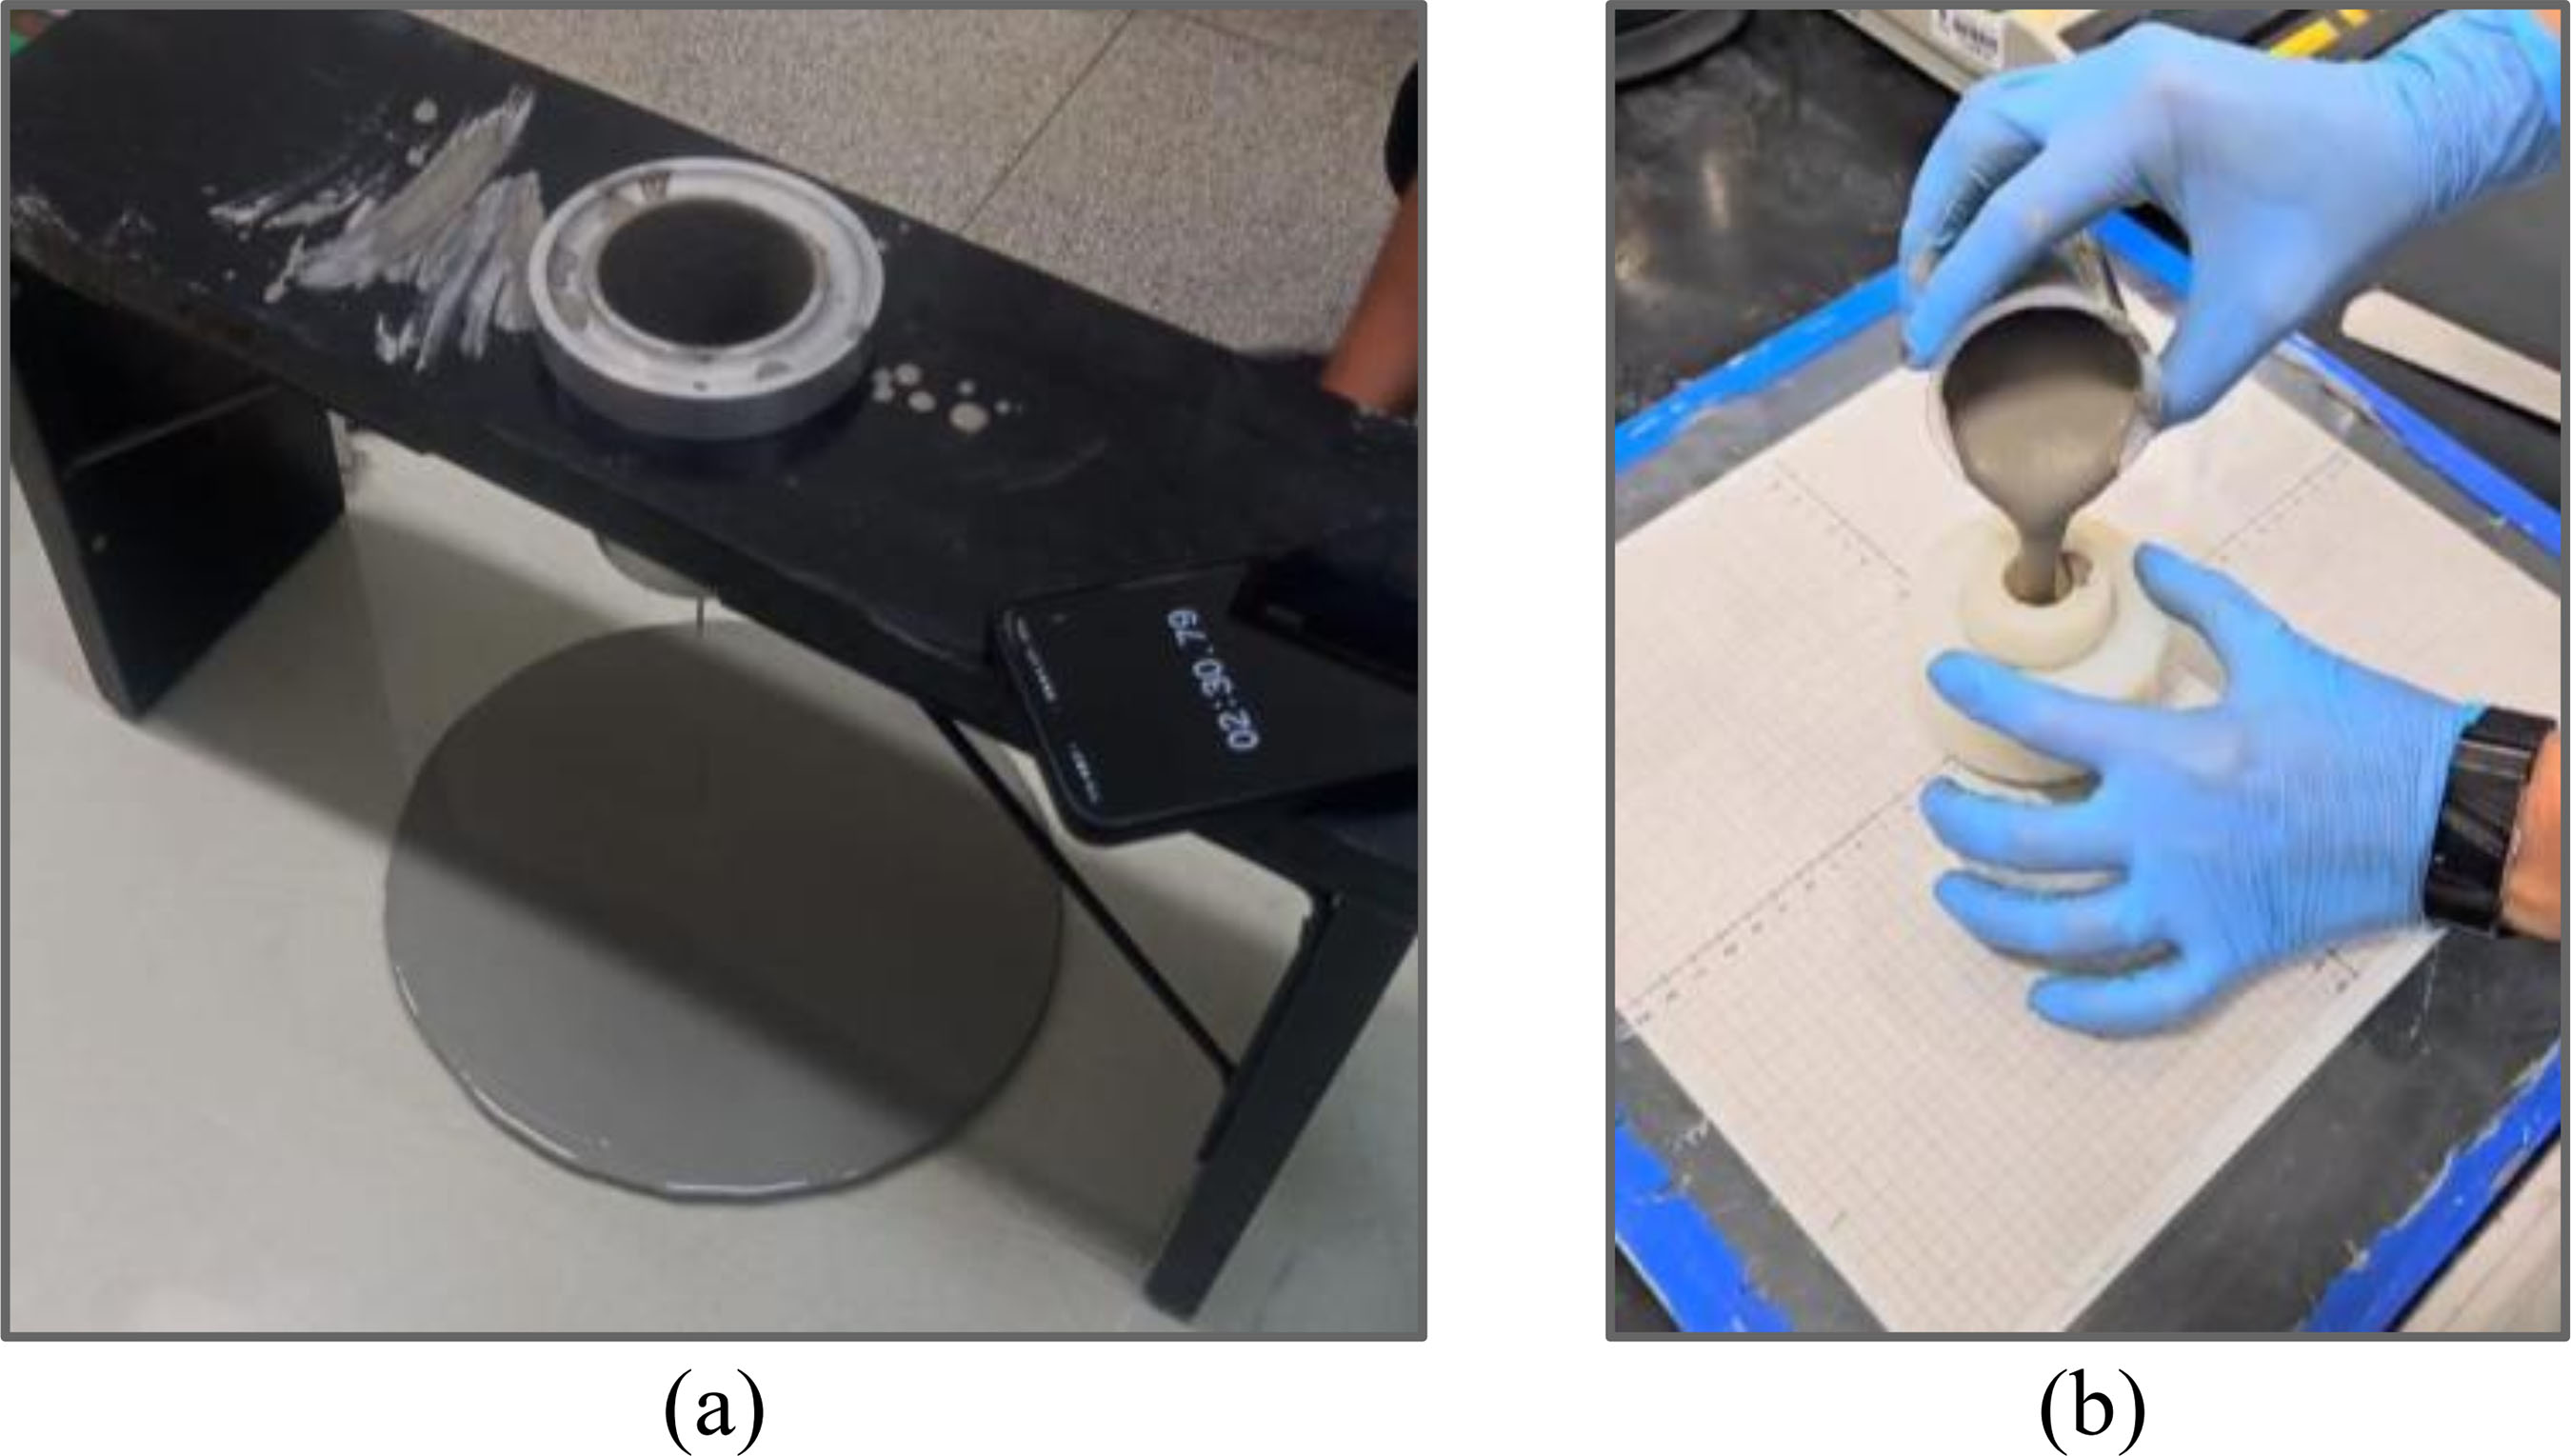
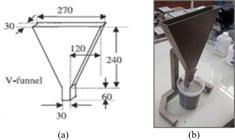
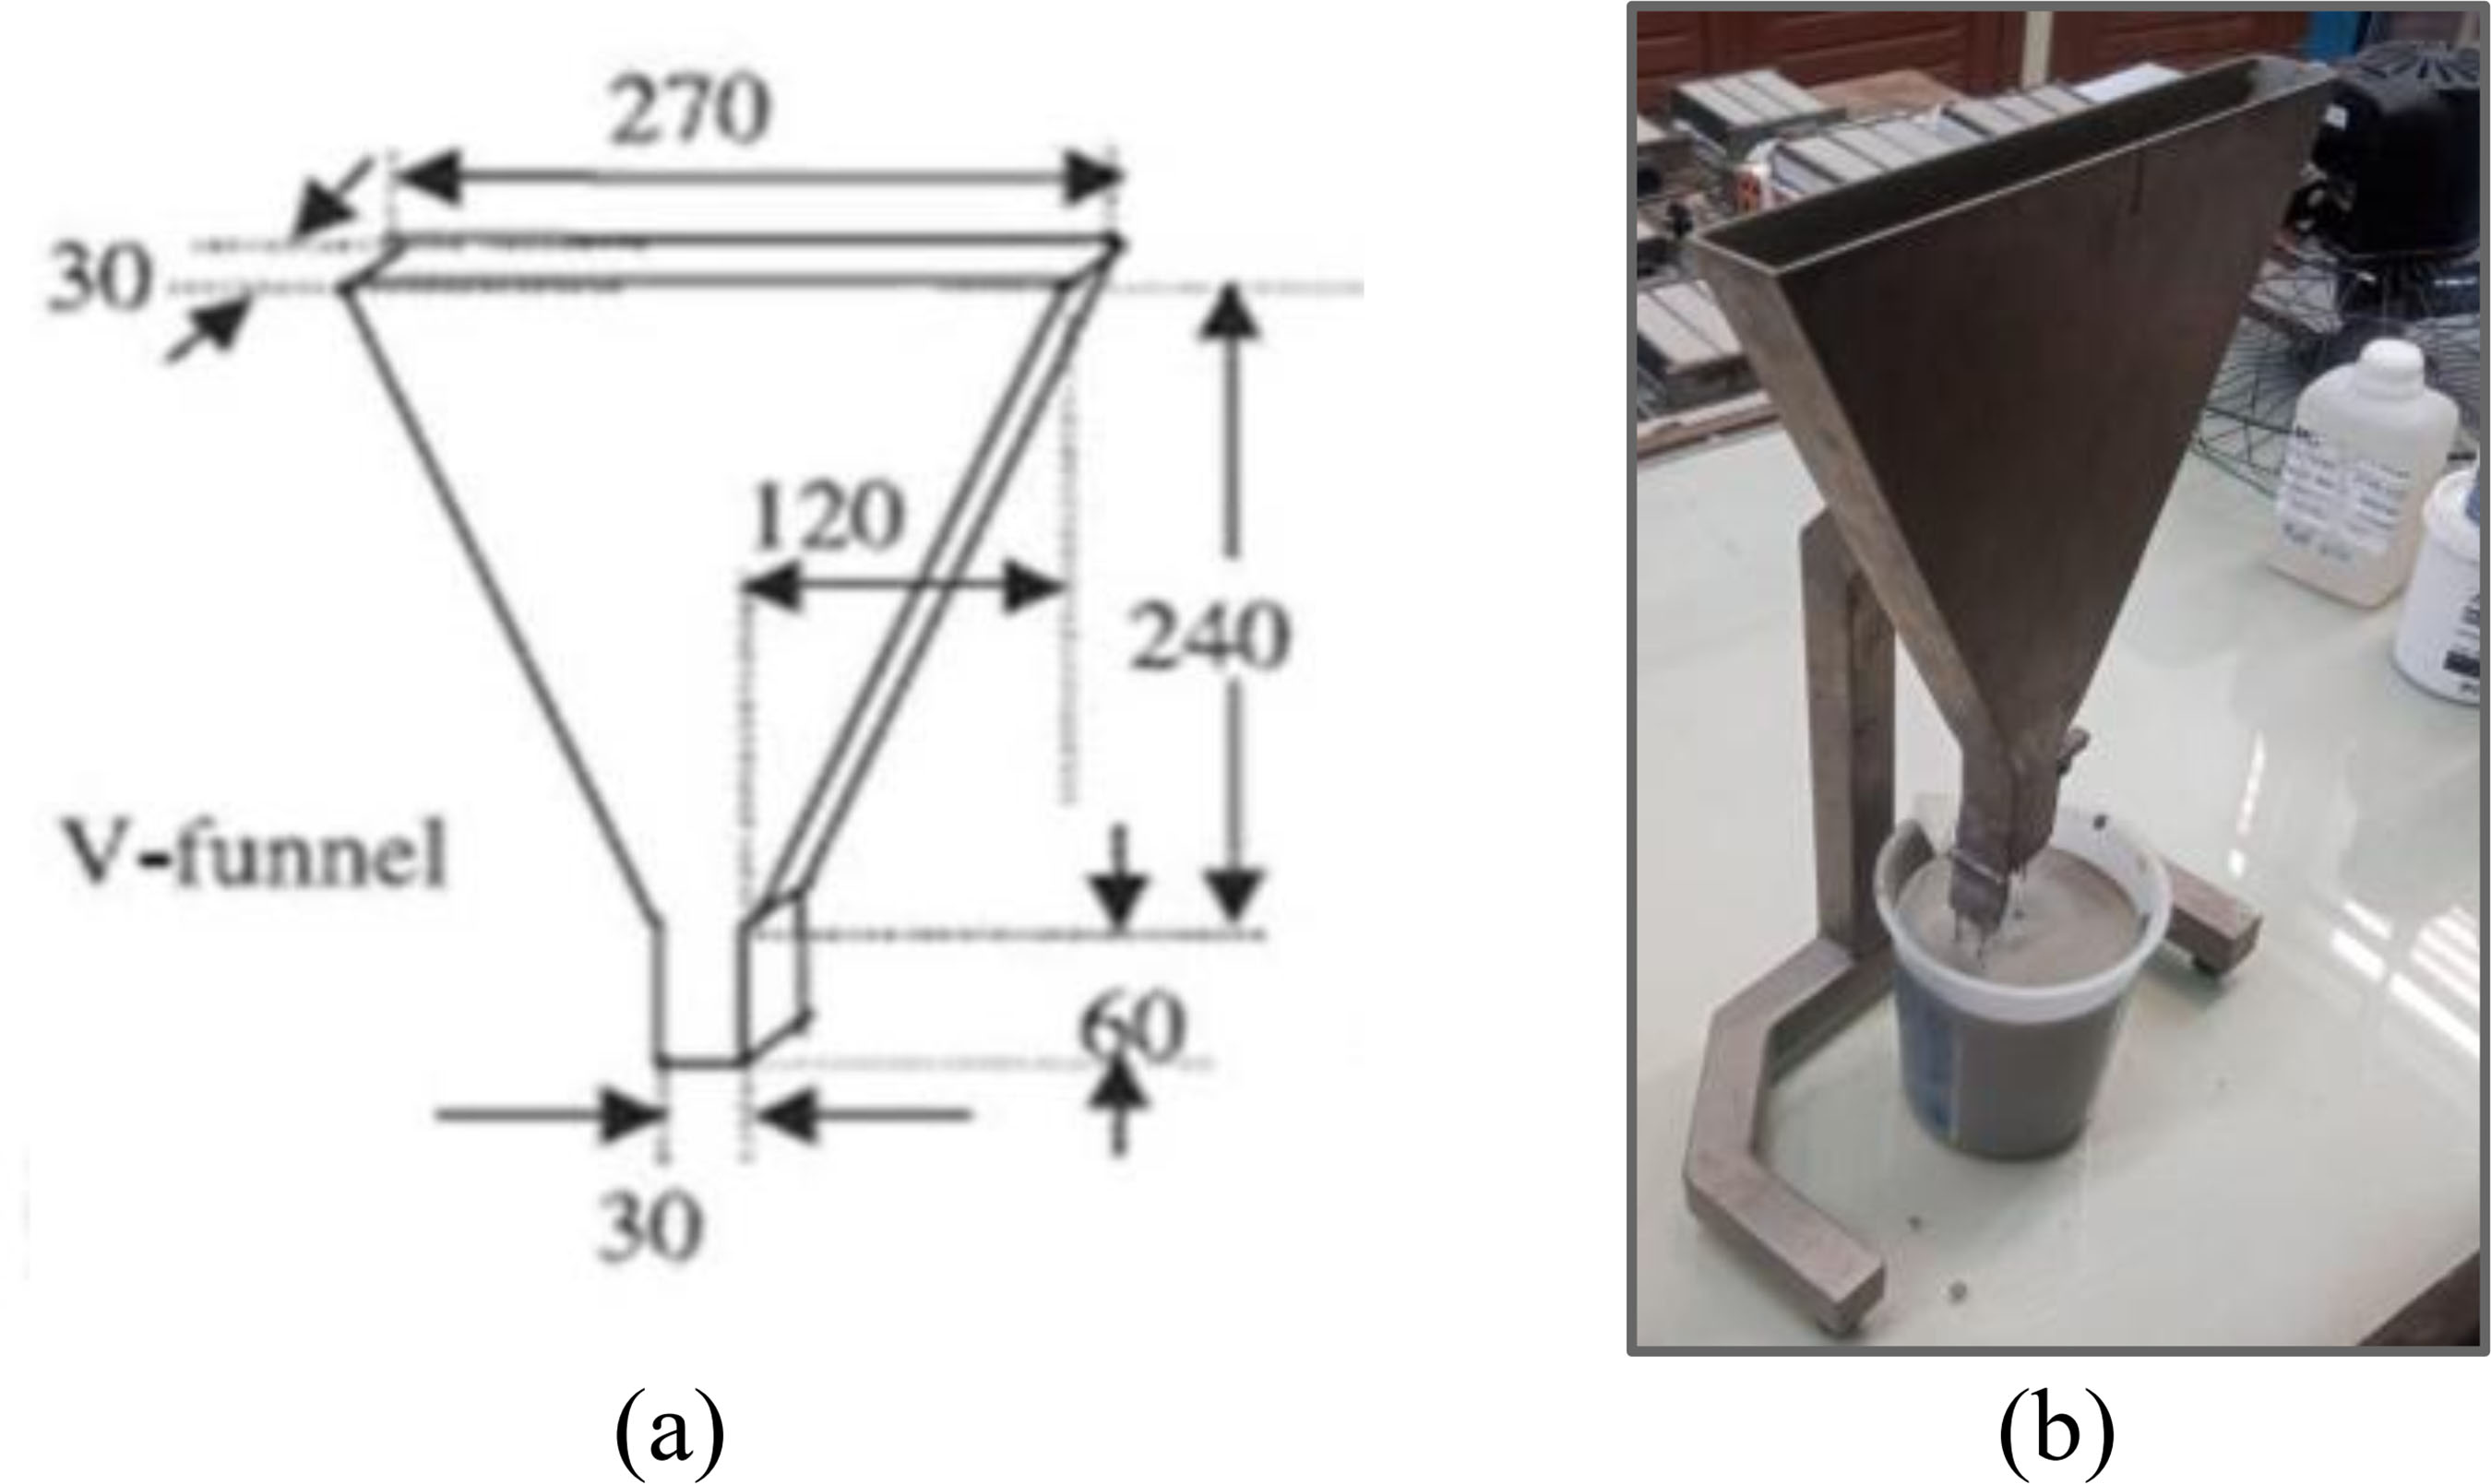
Fluidity and spread were evaluated using four methods: the V-funnel apparatus, the Spanish cylinder, the Marsh cone, and the Kantro cone. First, the V-funnel apparatus (Figure 7) was used to measure the time required to flow into a container positioned below the apparatus. Second, the Spanish cylinder method, as described by Martins (2009) (Figure 8a), was employed. In this test, the self-leveling mortar sample was placed inside a cylinder with an opening at the bottom, positioned 200 mm above a flat surface. Both the time for the mortar to flow out and the maximum spread diameter were recorded. The third method was the Marsh cone test, in which the flow time of a determined mortar portion was measured. These three tests were conducted immediately after the mortar analysis in the Pheso rheometer, essentially at the same time. The fourth method involved evaluating the spread using the Kantro cone (Figure 8b), as described by Oliveira (2016). This test was performed simultaneously with the rheological measurements in the Haake Mars 40 rheometer, approximately five minutes after the completion of the mortar evaluation in the Pheso rheometer.
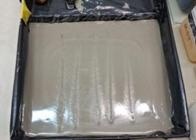
The healing time of each self-leveling mortar was determined in accordance with C1708 (ASTM, 2016). In this test, the self-leveling mortar was applied to a flat surface at a thickness of 0.8 cm. After a 10 minute interval, the first groove was made on the surface using a spatula. The procedure was then repeated every 5 minutes, observing whether the grooves closed completely after the spatula was removed (Figure 9). The healing time was defined as the moment when the grooves no longer fully closed. This test made it possible to evaluate the mortar’s workable time, an essential parameter for ensuring proper application and achieving a uniform surface finish. The test was conducted after the fluidity and spreadability measurements, approximately 3 minutes after the completion of the evaluation in the Pheso rheometer. It is important to note that the working period complied with the manufacturer’s recommendation presented in Table 2.
For further fresh-state analysis, the rheological behavior was evaluated by two methods: rotational flow test and oscillatory test as will be described in the sequence.
2.3.3 Correlation between the variables
The experimental data from fresh state evaluation were subjected to descriptive analysis and Pearson correlation analysis, using the “R” statistical software (R Core Team, 2024).
A correlation analysis was conducted among the following variables: physical characteristics (D90 and average particle diameter), mixing efficiency parameters (maximum torque, mixing time, and mixing energy), rheological properties (yield stress, plastic viscosity, and hysteresis area), and flowability indicators obtained from fluidity and spread tests (V-funnel, Spanish cylinder - time and maximum diameter - , Kantro cone, and Marsh cone).
2.4 Hardened state testing
At 28 days, the self-leveling mortars were tested in the hardened state to determine their apparent density in the hardened state (ABNT 2005b), flexural tensile strength and compressive strength (ABNT 2005a) and dynamic modulus of elasticity (ABNT 2008). Figure 10 shows the testing setup for dynamic modulus of elasticity determination.

Considering the lack of a specific Brazilian standard that indicate minimum mechanical resistance requirements for self-leveling mortars, the evaluation of this parameters was conducted due to European standard (EFSCCC, 2001) criteria. This international standard recommends a minimum tensile flexural strength of 5MPa and a minimum compressive strength of 20MPa.
3 Results and discussion
In this section, the results of the tests conducted on the self-leveling mortars are presented and discussed in both fresh and hardened states.
3.1 Mixing efficiency
The mixing efficiency for each self-leveling mortar is illustrated in Figure 11, which plots torque (N.m) against time (s). This graph allows for analysis of three key parameters, as detailed in the methodology:
-
maximum torque (measured after water addition);
-
the time to reach a plateau (indicated by the dashed lines), which corresponds to the necessary mixing time to achieve a constant torque; and
-
the mixing energy. The corresponding values for these parameters are summarized in Table 3.
As shown in Figure 11 and summarized in Table 3, the mortars exhibited clear differences in mixing efficiency. Mortar 2 required the longest time to reach the torque plateau, demanded the highest torque, and consumed the greatest amount of mixing energy, with a total mixing time of 300 s (13.2% higher than the shortest mixing time). The longer mixing time required and higher energy demand may be related to the particle size distribution observed for Mortar 2 (Table 1). This mortar presented the finest particle size distribution, as indicated by both the D90 and average particle diameter values. Consequently, due to its likely higher specific surface area compared to the other mortars – and with a similar water content – greater energy and time were required for adequate dispersion. Conversely, Mortar 1 required the least mixing energy and had a short mixing time, corresponding to its higher D90 value. These findings demonstrate that, even when designed for the same purpose, the mortars exhibit distinct mixing efficiencies, with Mortar 1 being the easiest to mix and Mortar 2 the most difficult. These results are correlated with the physical properties discussed in Section 3.4. It is observed that the mixing energy is influenced by the mixing time, a result that aligns with expectations, since mixing energy is obtained by the area under the curve torque versus time.

3.2 Rheological properties
Figure 12 illustrates the torque versus rotational speed values obtained from the flow rheology test cycle using the Pheso rheometer. The evaluated self-leveling mortars consistently exhibited thixotropic behavior, evidenced by the distinct difference (hysteresis loop) between the torque values recorded during the speed increase and speed decrease segments. This difference was particularly pronounced at the 125 rpm rotational speed. This typical behavior in cement-based composites is attributed to the continuous restructuring of the internal network, governed by hydration processes, particle interaction (agglomeration), and dispersion dynamics (Melo et al., 2024).

Torque versus rotation for the evaluated mortars: increasing speed stage (I) with decreasing speed stage (D)
For flow characterization, Figure 13 focuses exclusively on the decreasing rotational speed stage. This figure includes the rheological models obtained from the flow test, which were fitted to power-law type equations. A good fit of the equation to the data points was observed for mortar 1 and mortar 3. This behavior was not observed for mortar 2. However, this approach is consistent with the pseudoplastic behavior typically observed in cementitious materials (Singh; Thakare; Chaudhary, 2023).
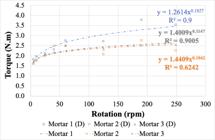
In Figure 13, the highest torque values were recorded for Mortar 1, while Mortars 2 and 3 demonstrated similar behavior. This trend contrasts with the observations made during the mixing process (Table 2). Interestingly, the behavior observed in Figure 13 aligns with the shear stress versus shear rate values determined using the Haake Mars 40 rheometer (Figure 14), where Mortar 1 yielded the highest shear stress and Mortar 3 showed the lowest.
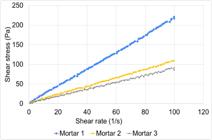
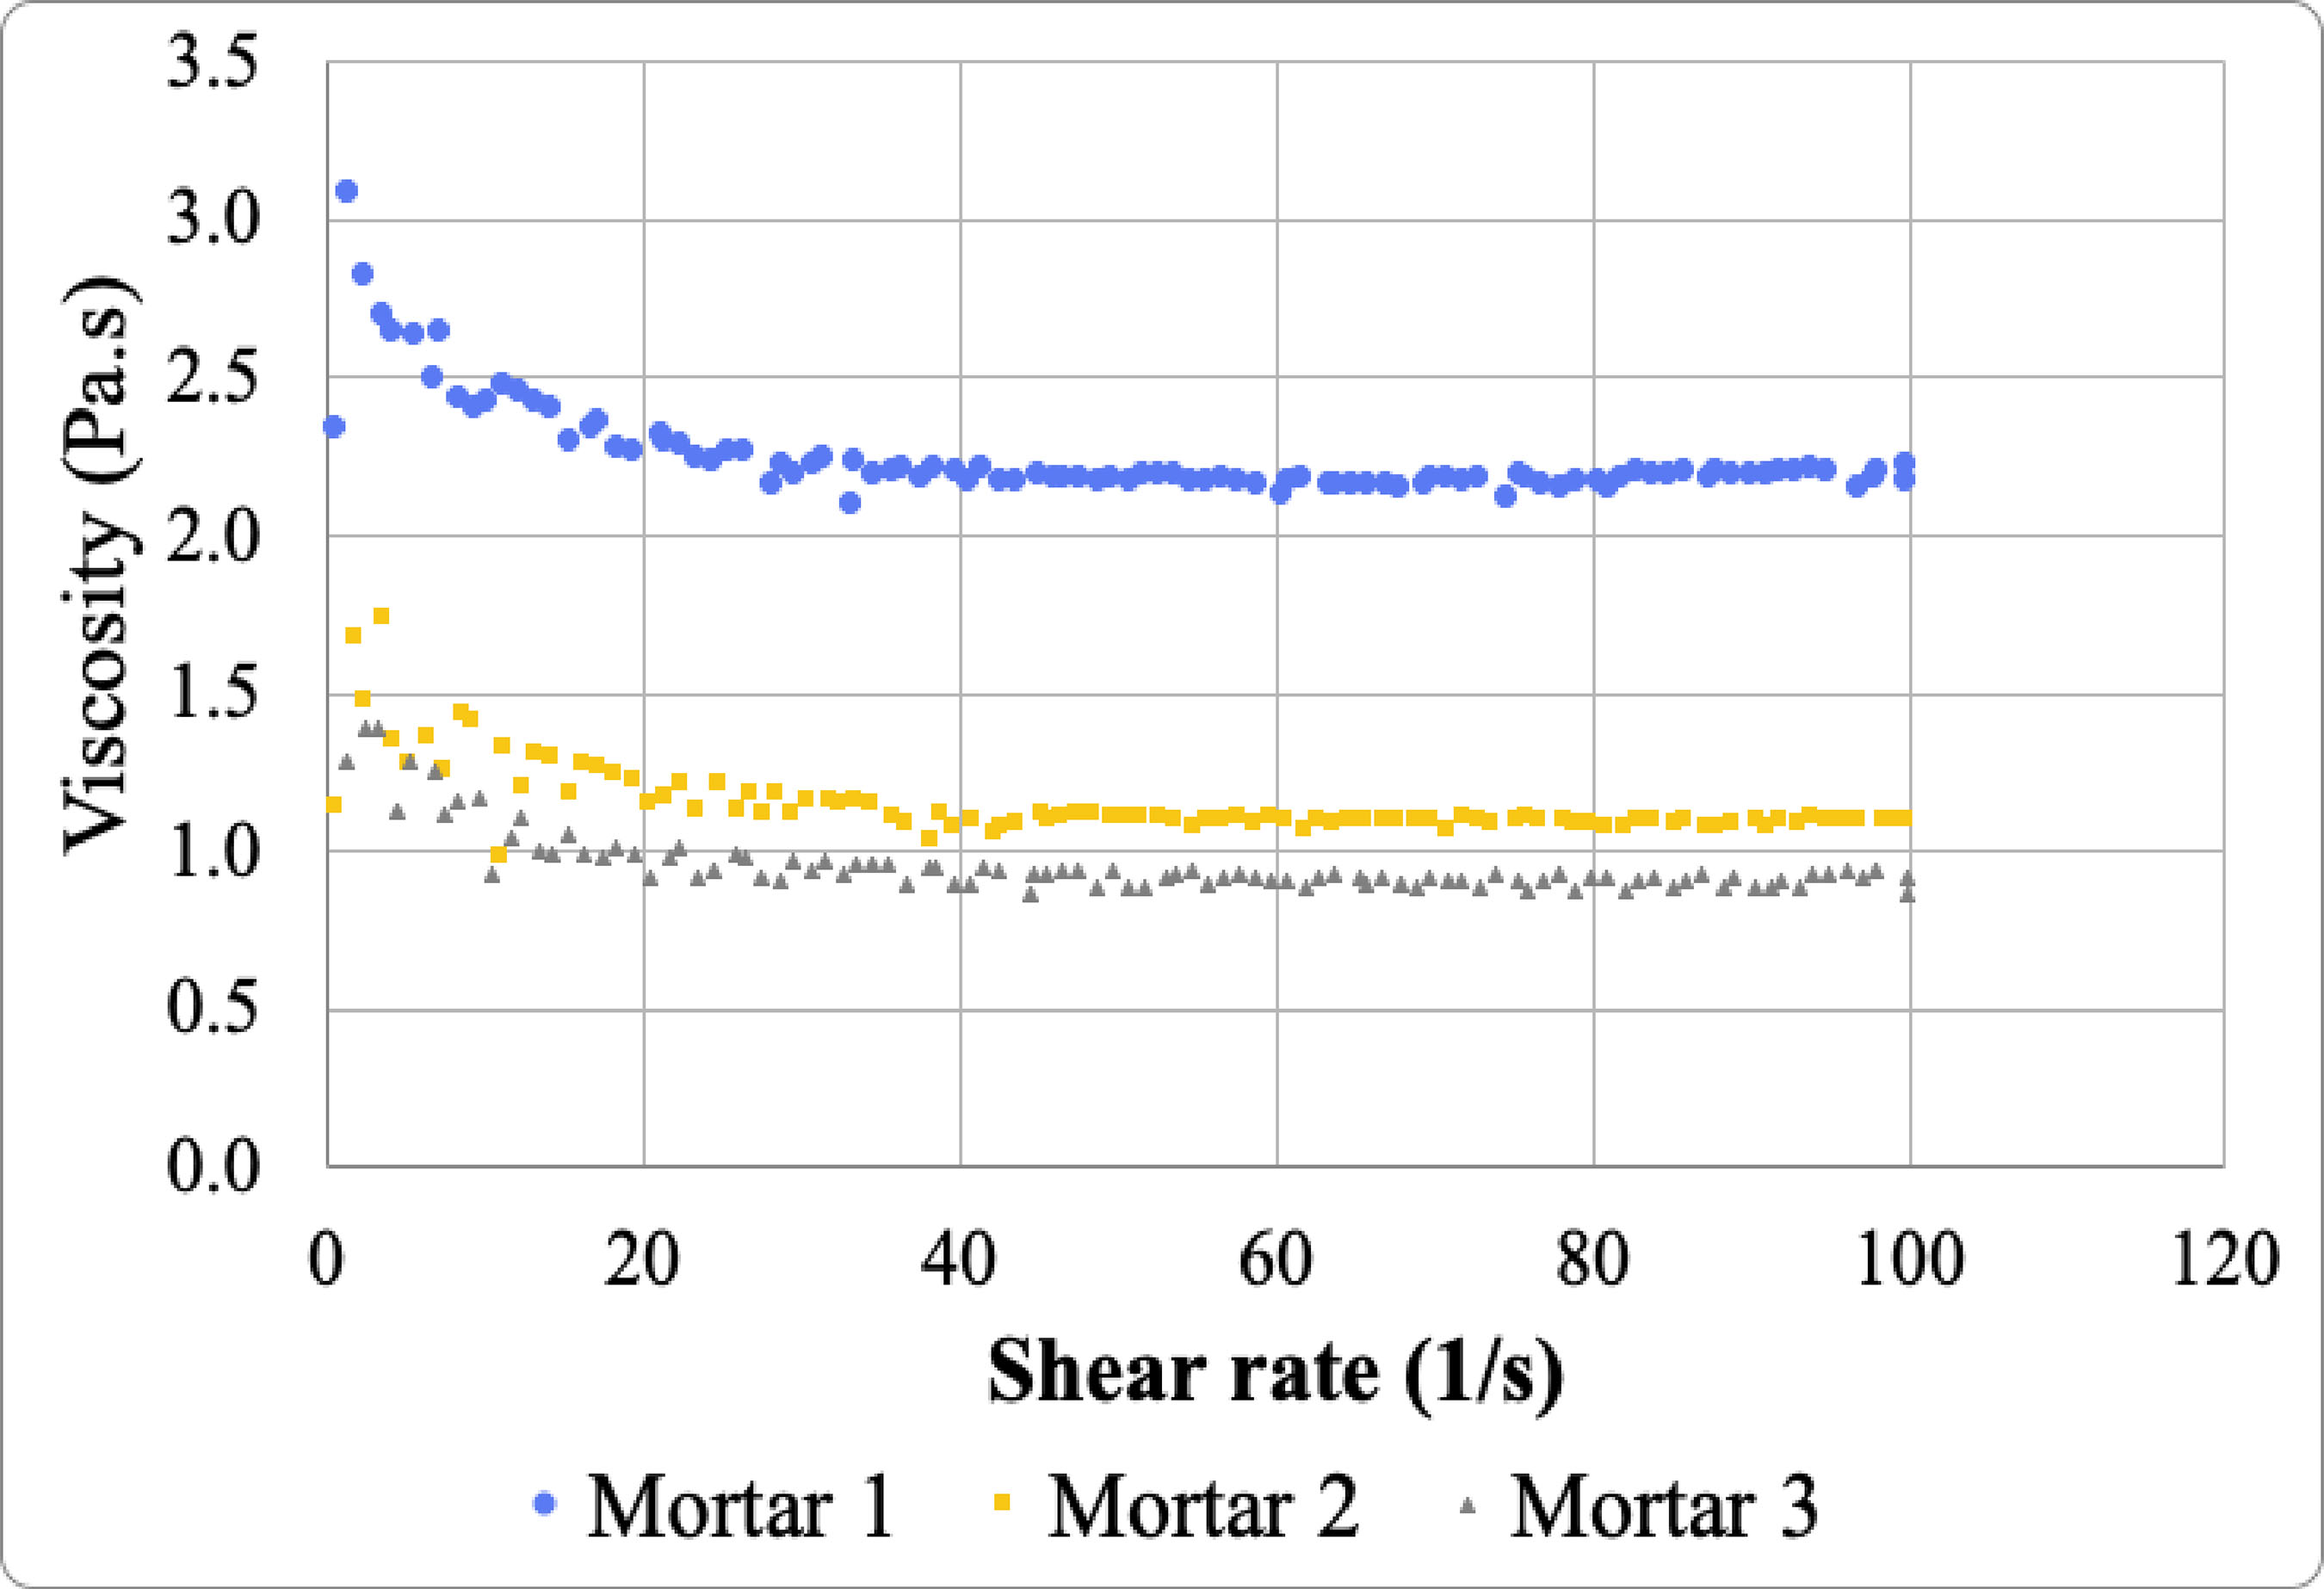
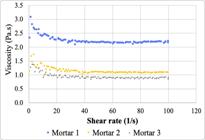
It can be seen in Figure 14 and Table 4 that the yield stress is very low, which is consistent with findings by Brasileiro (2023) and Lam (2021). This means that a very little stress is required for the material to begin flowing. The highest yield stress was observed for mortar 1, as well as the highest plastic viscosity (Figure 15 and Table 3). Furthermore, the largest hysteresis area was observed for this mortar, demonstrating that it has the worst dispersion in relation to the others for the applied mixing process. It is important to highlight that Mortar 1 demonstrated the largest D90 diameter (Table 1), suggesting a potential correlation with the observed result. This relationship will be explored in detail in Section 3.4.
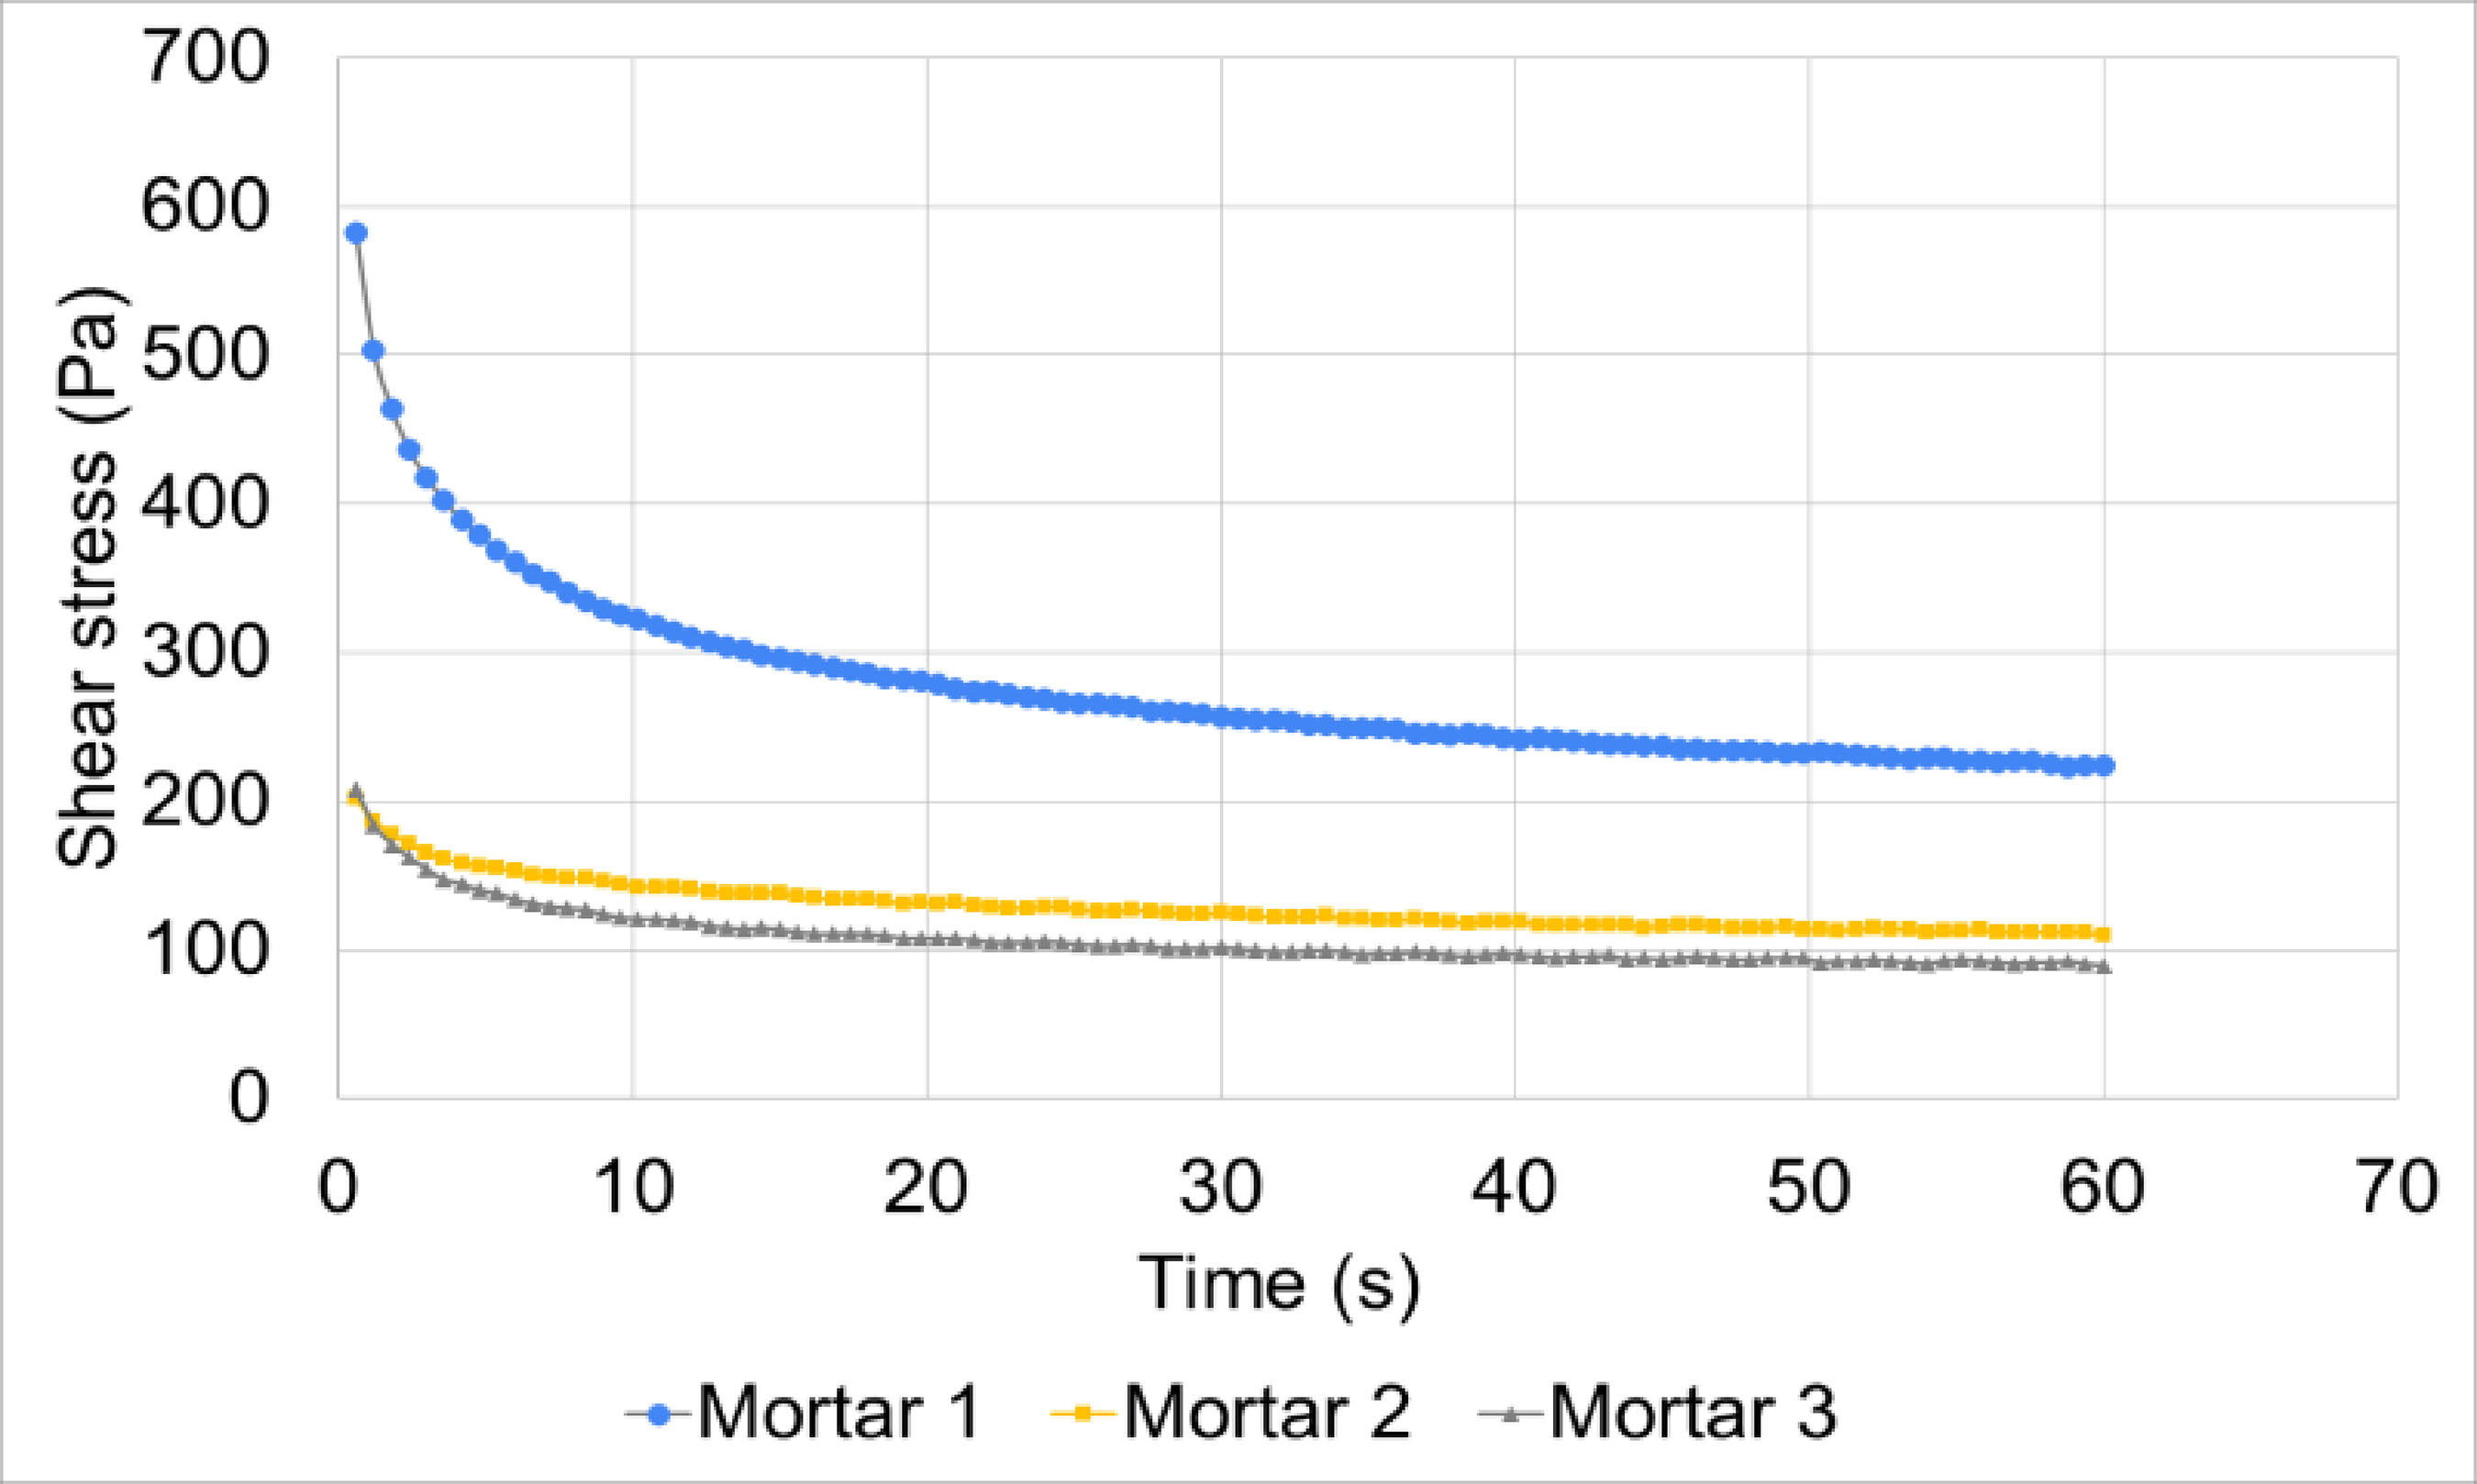
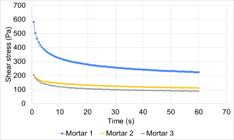
The distinction between mortar 1 and the other mortars became apparent at the beginning of the test, specifically during the pre-shear phase (Figure 16). Despite displaying a comparable behavioral pattern, mortars 2 and 3 registered significantly lower shear stresses than mortar 1. Mortar 1's performance was unique, as it demonstrated the higher initial shear stress and continued to exhibit the greater shear stress even after shearing. This sustained higher stress level is likely the reason for its previously observed higher yield stress and viscosity.
The rheological behavior captured by the Haake Mars 40 (Figure 14) was more sensitive than that of the Pheso rheometer (Figure 13), which is likely attributable to the former's superior precision. To enhance the sensitivity of the Pheso rheometer, it may be necessary to explore alternative measurement cycles or geometries for this type of mortar.
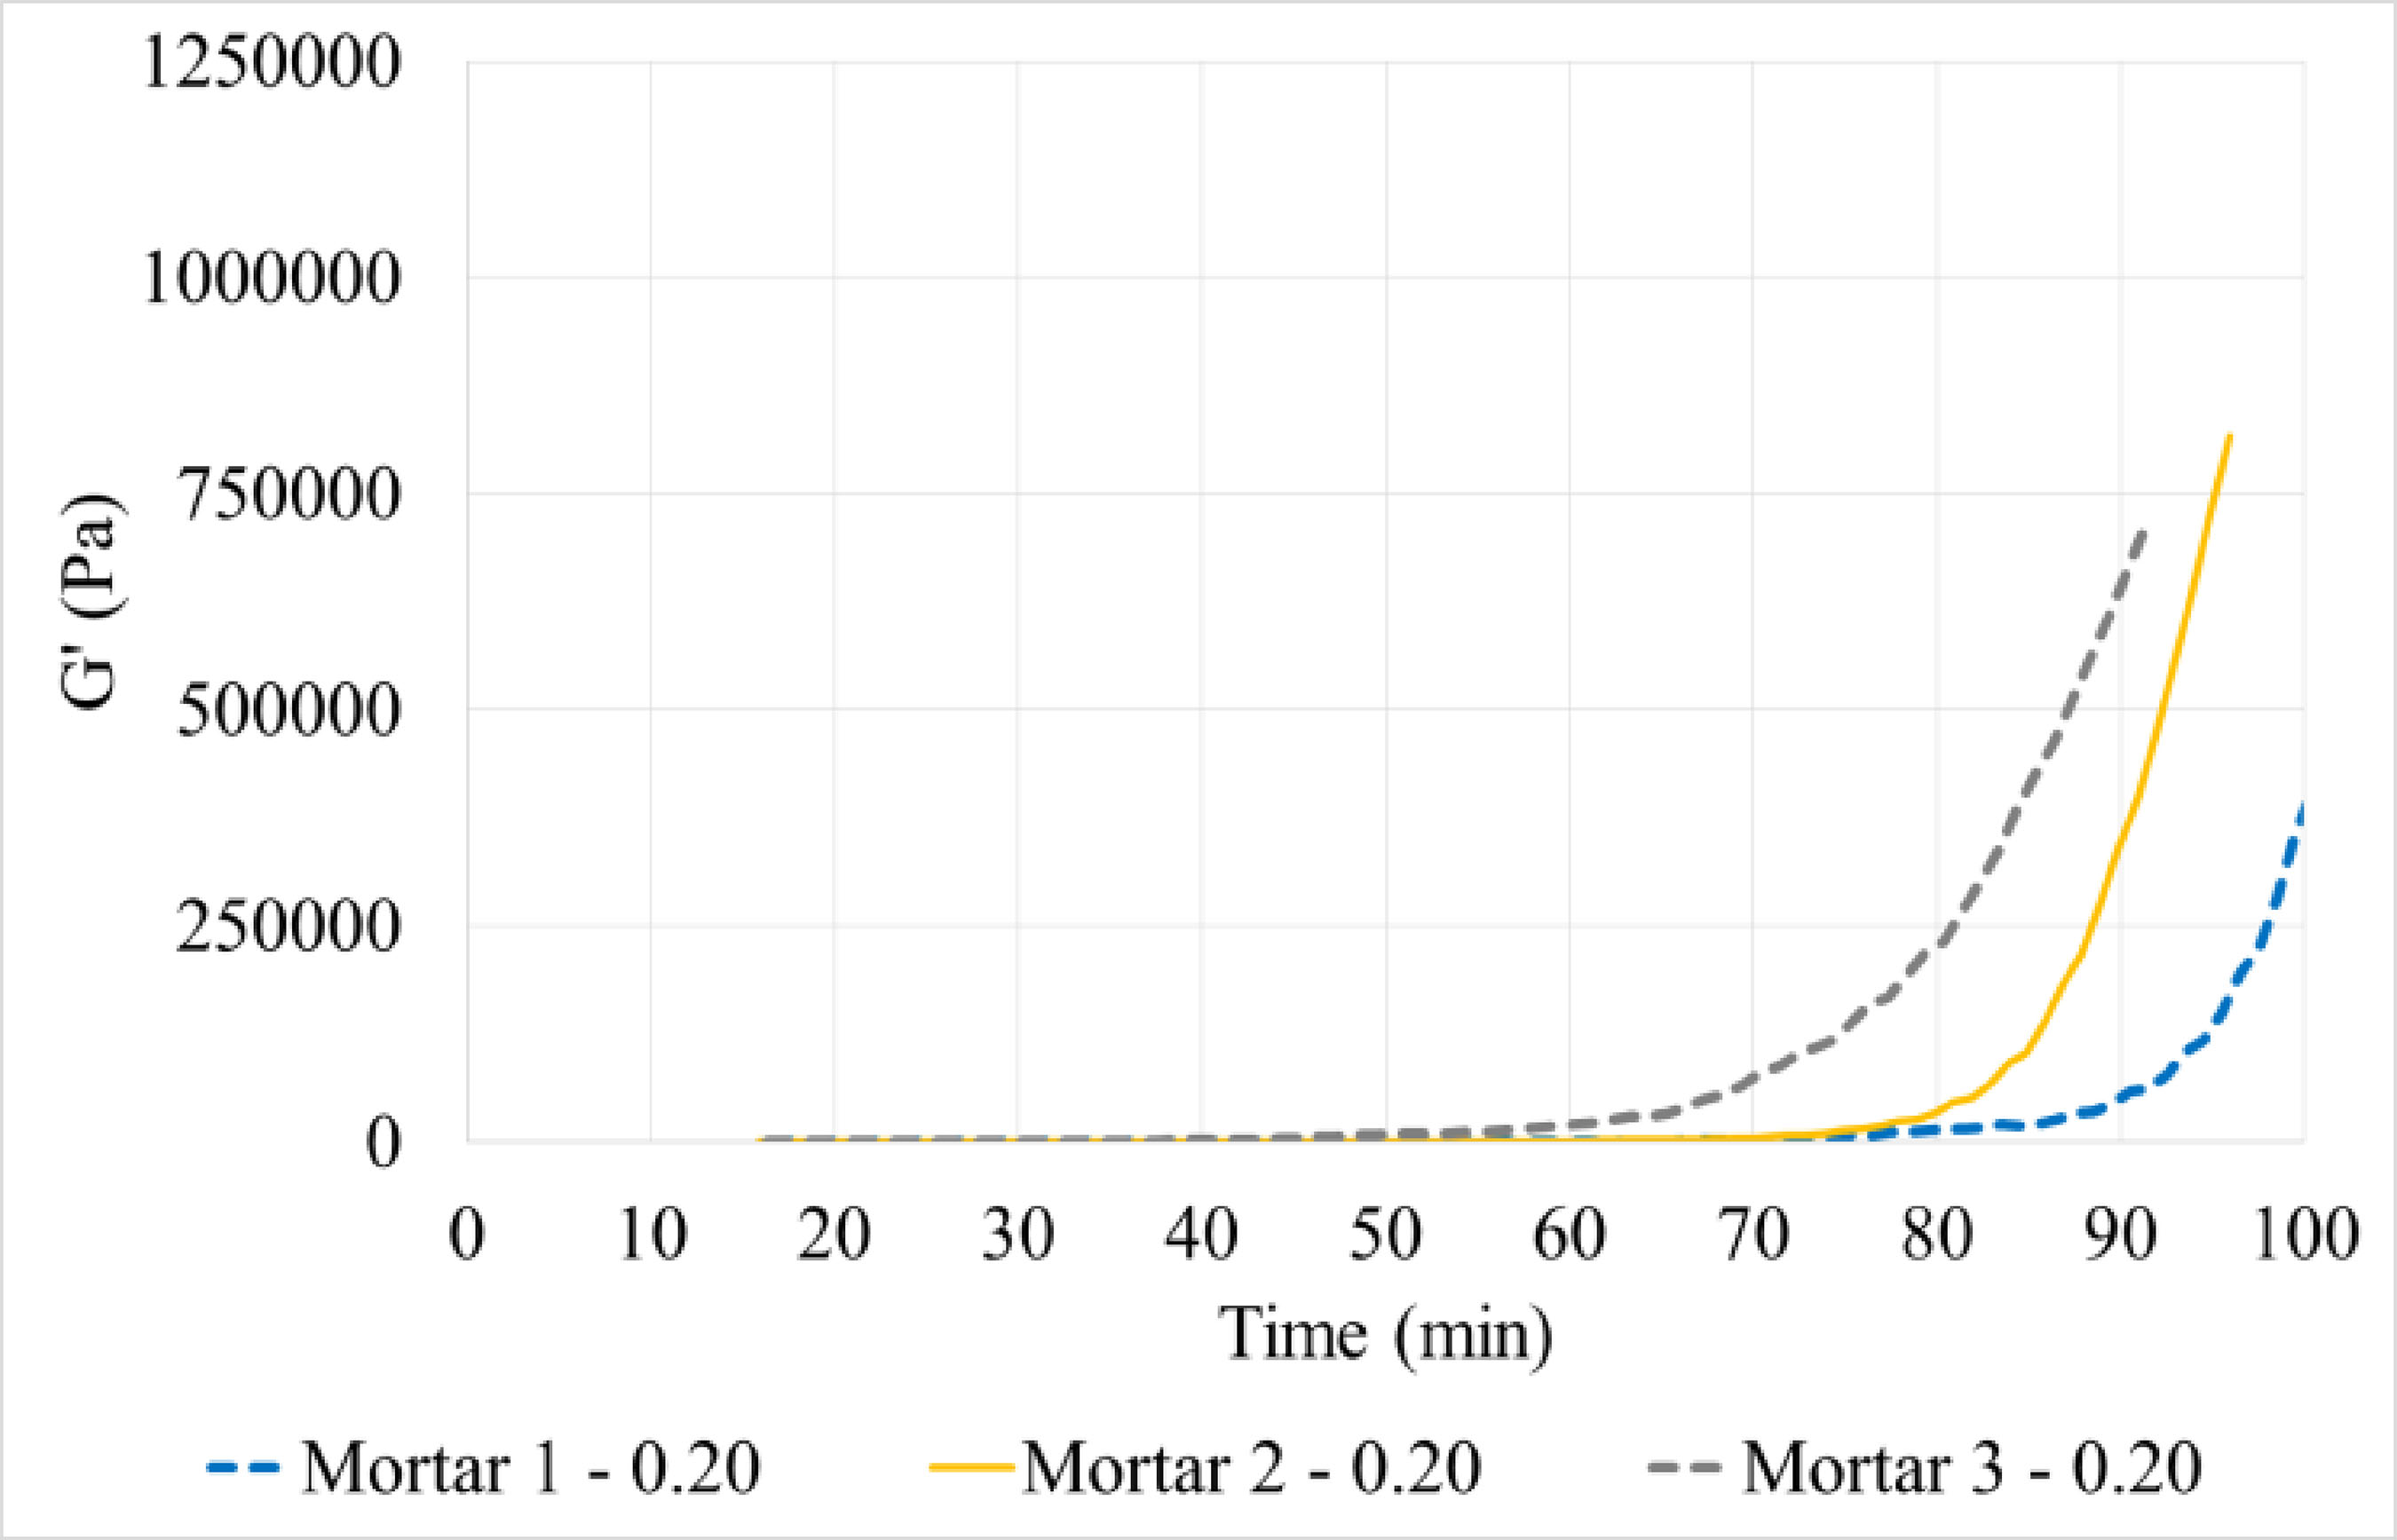
The storage modulus (G′) was monitored in oscillation mode and is presented in Figure 17 for mortars prepared with the manufacturer's recommended water-to-dry-materials ratio.
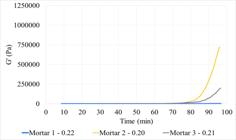
Evolution of storage modulus G’ versus time of samples with the manufacturer's recommended water-to-dry-materials ratio
As shown in Figure 17, the storage modulus (G’) of Mortar 2 and Mortar 3 began to increase rapidly after approximately 80 and 85 minutes of mixing, respectively. This contrasts with the behavior of Mortar 1, for which no significant increase in G′ was observed during testing time. This phenomenon can be attributed to the highest water-to-dry-materials ratio of Mortar 1, a factor that likely led to segregation and inhibited the formation of a structured network. For a comparative analysis, samples with a uniform water-to-dry-materials ratio were also evaluated, with the results presented in Figure 18.
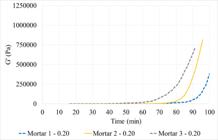
Evolution of storage modulus G’ versus time of samples with the same water-to-dry-materials ratio
In Figure 18, mortars with the same water-to-dry-materials ratio demonstrate an increase in the storage modulus (G′) over a shorter time period. This behavior is expected because a lower water content places the particles closer together, thereby reducing the time required for agglomeration to begin. The behavior obtained in Figures 17 and 18 was also observed by Lam (2021) for self–levelling underlayment based on ettringite binder.
Furthermore, Figure 18 also shows that even at the same water-to-dry-material ratio, the mortars exhibit different behaviors. This can be attributed to the unique compositions, as well as the particle size distribution, that each manufacturer formulates for mortars with the same intended purpose.
The differences in self-leveling mortar compositions and water-to-dry-materials ratios among manufacturers also influenced the elasticity factor (EF), determined by Equation 1, as shown in Figure 19. This figure reveals that Mortar 2 and Mortar 3 exhibit similar behavior, while Mortar 1 behaves differently. These findings are consistent with the previously mentioned rheological measurements (plastic viscosity and yield stress, shown in Table 4 and Figures 14 and 15).

Evolution of elasticity factor (EF) e shear stress (SS) versus time of samples with the manufacturer's recommended water-to-dry-materials ratio
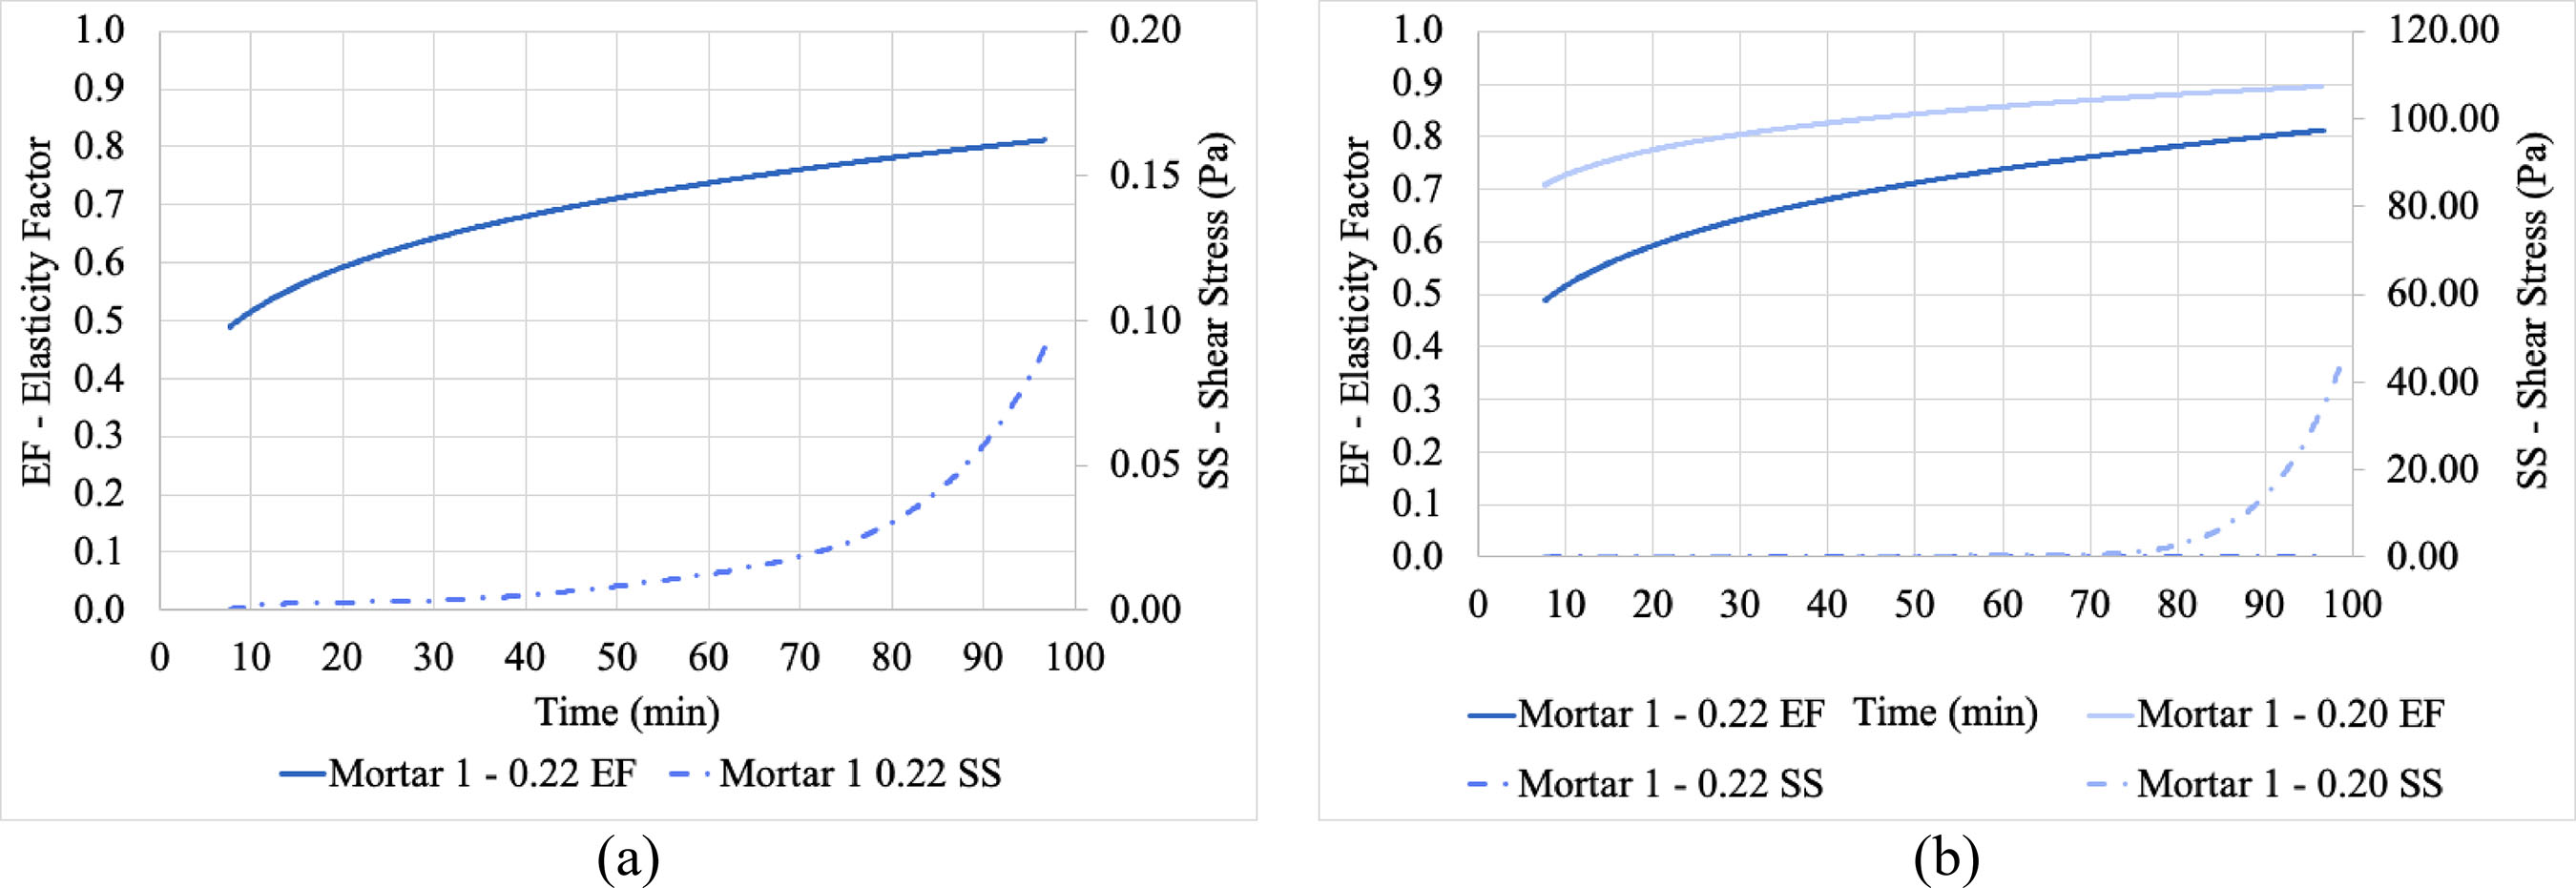
Figure 19 also demonstrates that the shear stress values for Mortar 1 in the oscillatory test were significantly lower than those of the other mortars. It's noteworthy that for Mortar 1, a subtle increase in shear stress over time was also observed, though only visible when the scale was reduced, as illustrated in Figure 20a.

Evolution of elasticity factor (EF) e shear stress (SS) versus time of samples for mortar 1 with: (a) the manufacturer's recommended water-to-dry-materials ratio (0.22) and (b) water-to-drymaterials ratio 0.22 and 0.20
As previously discussed, the excessive water-to-dry-material ratio, which leads to significant particle dispersion, may have caused the mortar to segregate. When the water-to-dry-materials ratio was lower than the manufacturer’s recommendation, this mortar showed an increase in both the elasticity factor and shear stress (Figure 20b). However, these shear stress values remained lower than those of the other mortars.
3.3 Fluidity, spread and healing time
Table 5 presents the fluidity and spread values obtained by V-funnel, Marsh Cone, Spanish cylinder and Kantro cone for all mortars.
The mortars showed a clear difference in behavior depending on the test. The fluidity measurements (V-funnel, Marsh cone, and Spanish cylinder) had no correlation with each other, as different increasing value sequences among the tree mortars were obtained for each test (Table 5). As Betioli et al. (2009) also highlighted, this is because these "single-point" tests lack the sensitivity to capture the material's overall behaviour. A similar lack of correlation was observed in the spread measurements.
The values of spread obtained by the Kantro cone showed a trend similar to the yield stress (Table 4) from the Haake Mars 40 rheometer. The mortar with the highest yield stress and viscosity (Mortar 1) exhibited the lowest spread, indicating a greater resistance to flow. This trend also held true for Mortars 2 and 3, as the mortar with the lowest yield stress and viscosity had the highest average spread.
The fluidity and spread values showed a correlation with other evaluated parameters, including physical characteristics, mixing efficiency parameters and rheological properties. This relationship is further detailed and discussed in Section 3.4.
The healing time, which results are provided in Table 6, was an important property observed. All values obtained were higher than the 20 minutes found by Mendes, Effting and Schackow (2020). Mortar 1 exhibited the shortest healing time, a finding consistent with the increase in shear stress observed in the oscillatory test. This increase was identified by inflection of the curve at approximately 40 minutes (Figure 20a). In contrast, Mortar 2 and Mortar 3 showed a significant increase in shear stress only after much longer periods, at 75 and 80 minutes, respectively (Figure 19).
However, when analyzing the behaviour of the elastic component (G′), a significant increase was observed for Mortar 2 and Mortar 3 at 60 and 80 minutes, respectively (Figure 18). These times are consistent with the healing times measured for these mortars. The behavior of Mortar 1 was different, as the increase in its elastic component occurred over a longer period, which does not correspond to its measured healing time.
The behavior observed during this test is strongly influenced by the complex chemical composition of the used admixtures and their compatibility with the Portland cement matrix. Another critical consideration is that the experiments were consistently performed while all mortars were within the period of use recommended by the manufacturer (details available in Table 2).
3.4 Correlation between the variables
The Pearson correlation analysis, presented in Table 7, was conducted among the following variables: physical characteristics (D90 and average particle diameter), mixing efficiency parameters (maximum torque, mixing time, and mixing energy), rheological properties (yield stress, plastic viscosity, and hysteresis area), and flowability indicators obtained from fluidity and spread tests. In Table 7, the indices showing good/strong correlations, defined as coefficients, defined as coefficients above 0.80, are highlighted in gray. It is important to note that negative values indicate an inverse relationship between the corresponding variables.
As expected, clear correlations were identified between the physical characteristics (D90 and average particle diameter) and the mixing process parameters. The D90 diameter showed strong correlations with maximum torque and mixing energy, while the average diameter correlated with both mixing time and mixing energy. These relationships, previously discussed in Section 3.1, were statistically confirmed. A correlation between mixing time and mixing energy, also noted earlier, reinforces the internal consistency of the results.
The physical characteristics and the mixing process parameters were also correlated with the rheological properties. This finding is reasonable since both factors can directly influence rheological behavior. Specifically, the D90 diameter correlated with plastic viscosity and hysteresis area. Additionally, maximum torque showed correlations with all three rheological parameters - yield stress, plastic viscosity, and hysteresis area. As expected, the rheological parameters were intercorrelated, reflecting their intrinsic physical dependence.
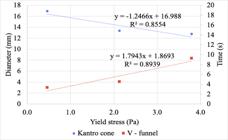
An important outcome highlighted by the statistical analysis was the correlation between the rheological parameters and the flowability and spreadability results. This relationship was particularly evident for "single-point" tests, although the strength of correlation varied among them. Yield stress, for instance, correlated with both the V-funnel flow time and the spread diameter obtained with the Kantro cone. This can be attributed to the high fluidity of the mortars: even with flow restrictions in the V-funnel, very short flow times were recorded, which limited the correlation with viscosity. Furthermore, these parameters exhibit a good fit to a linear correlation model that is visually represented in Figure 21.
Among all the flow and spreading tests, the Spanish cylinder (time measurement) stood out for its stronger and more consistent correlations. In this case, viscosity correlated with flow time due to the greater flow restriction imposed by the cylinder compared with the V-funnel. The Spanish cylinder time also correlated with the hysteresis area, reflecting the thixotropic behavior of the material. As expected, the mixing process parameters correlated with the Spanish cylinder time, particularly mixing energy and maximum torque, as well as with the physical characteristics (D90 and average diameter).
When comparing the flow and spreading tests, a correlation was found between the V-funnel and Spanish cylinder flow times. However, due to the greater flow restriction in the Spanish cylinder, this test demonstrated superior sensitivity and reliability for evaluating self-leveling mortars. This higher accuracy is supported by the number of significant correlations observed (eight in total), encompassing physical, mixing, and rheological parameters. Therefore, the Spanish cylinder test can be considered the most appropriate method for assessing self-leveling mortars - an interpretation consistent with the recommendations of the C1708 (ASTM, 2016).
3.5 Hardened state properties
Table 8 shows the specific gravity and dynamic elasticity modulus of the mortars in their hardened state. Mortar 1 had the highest average elasticity modulus, while Mortar 2 had the lowest average and the highest variability. For applications like screeds that require greater flexibility, these values are important for product selection. Once again, this demonstrates a clear influence of the mortar's composition on its hardened properties.
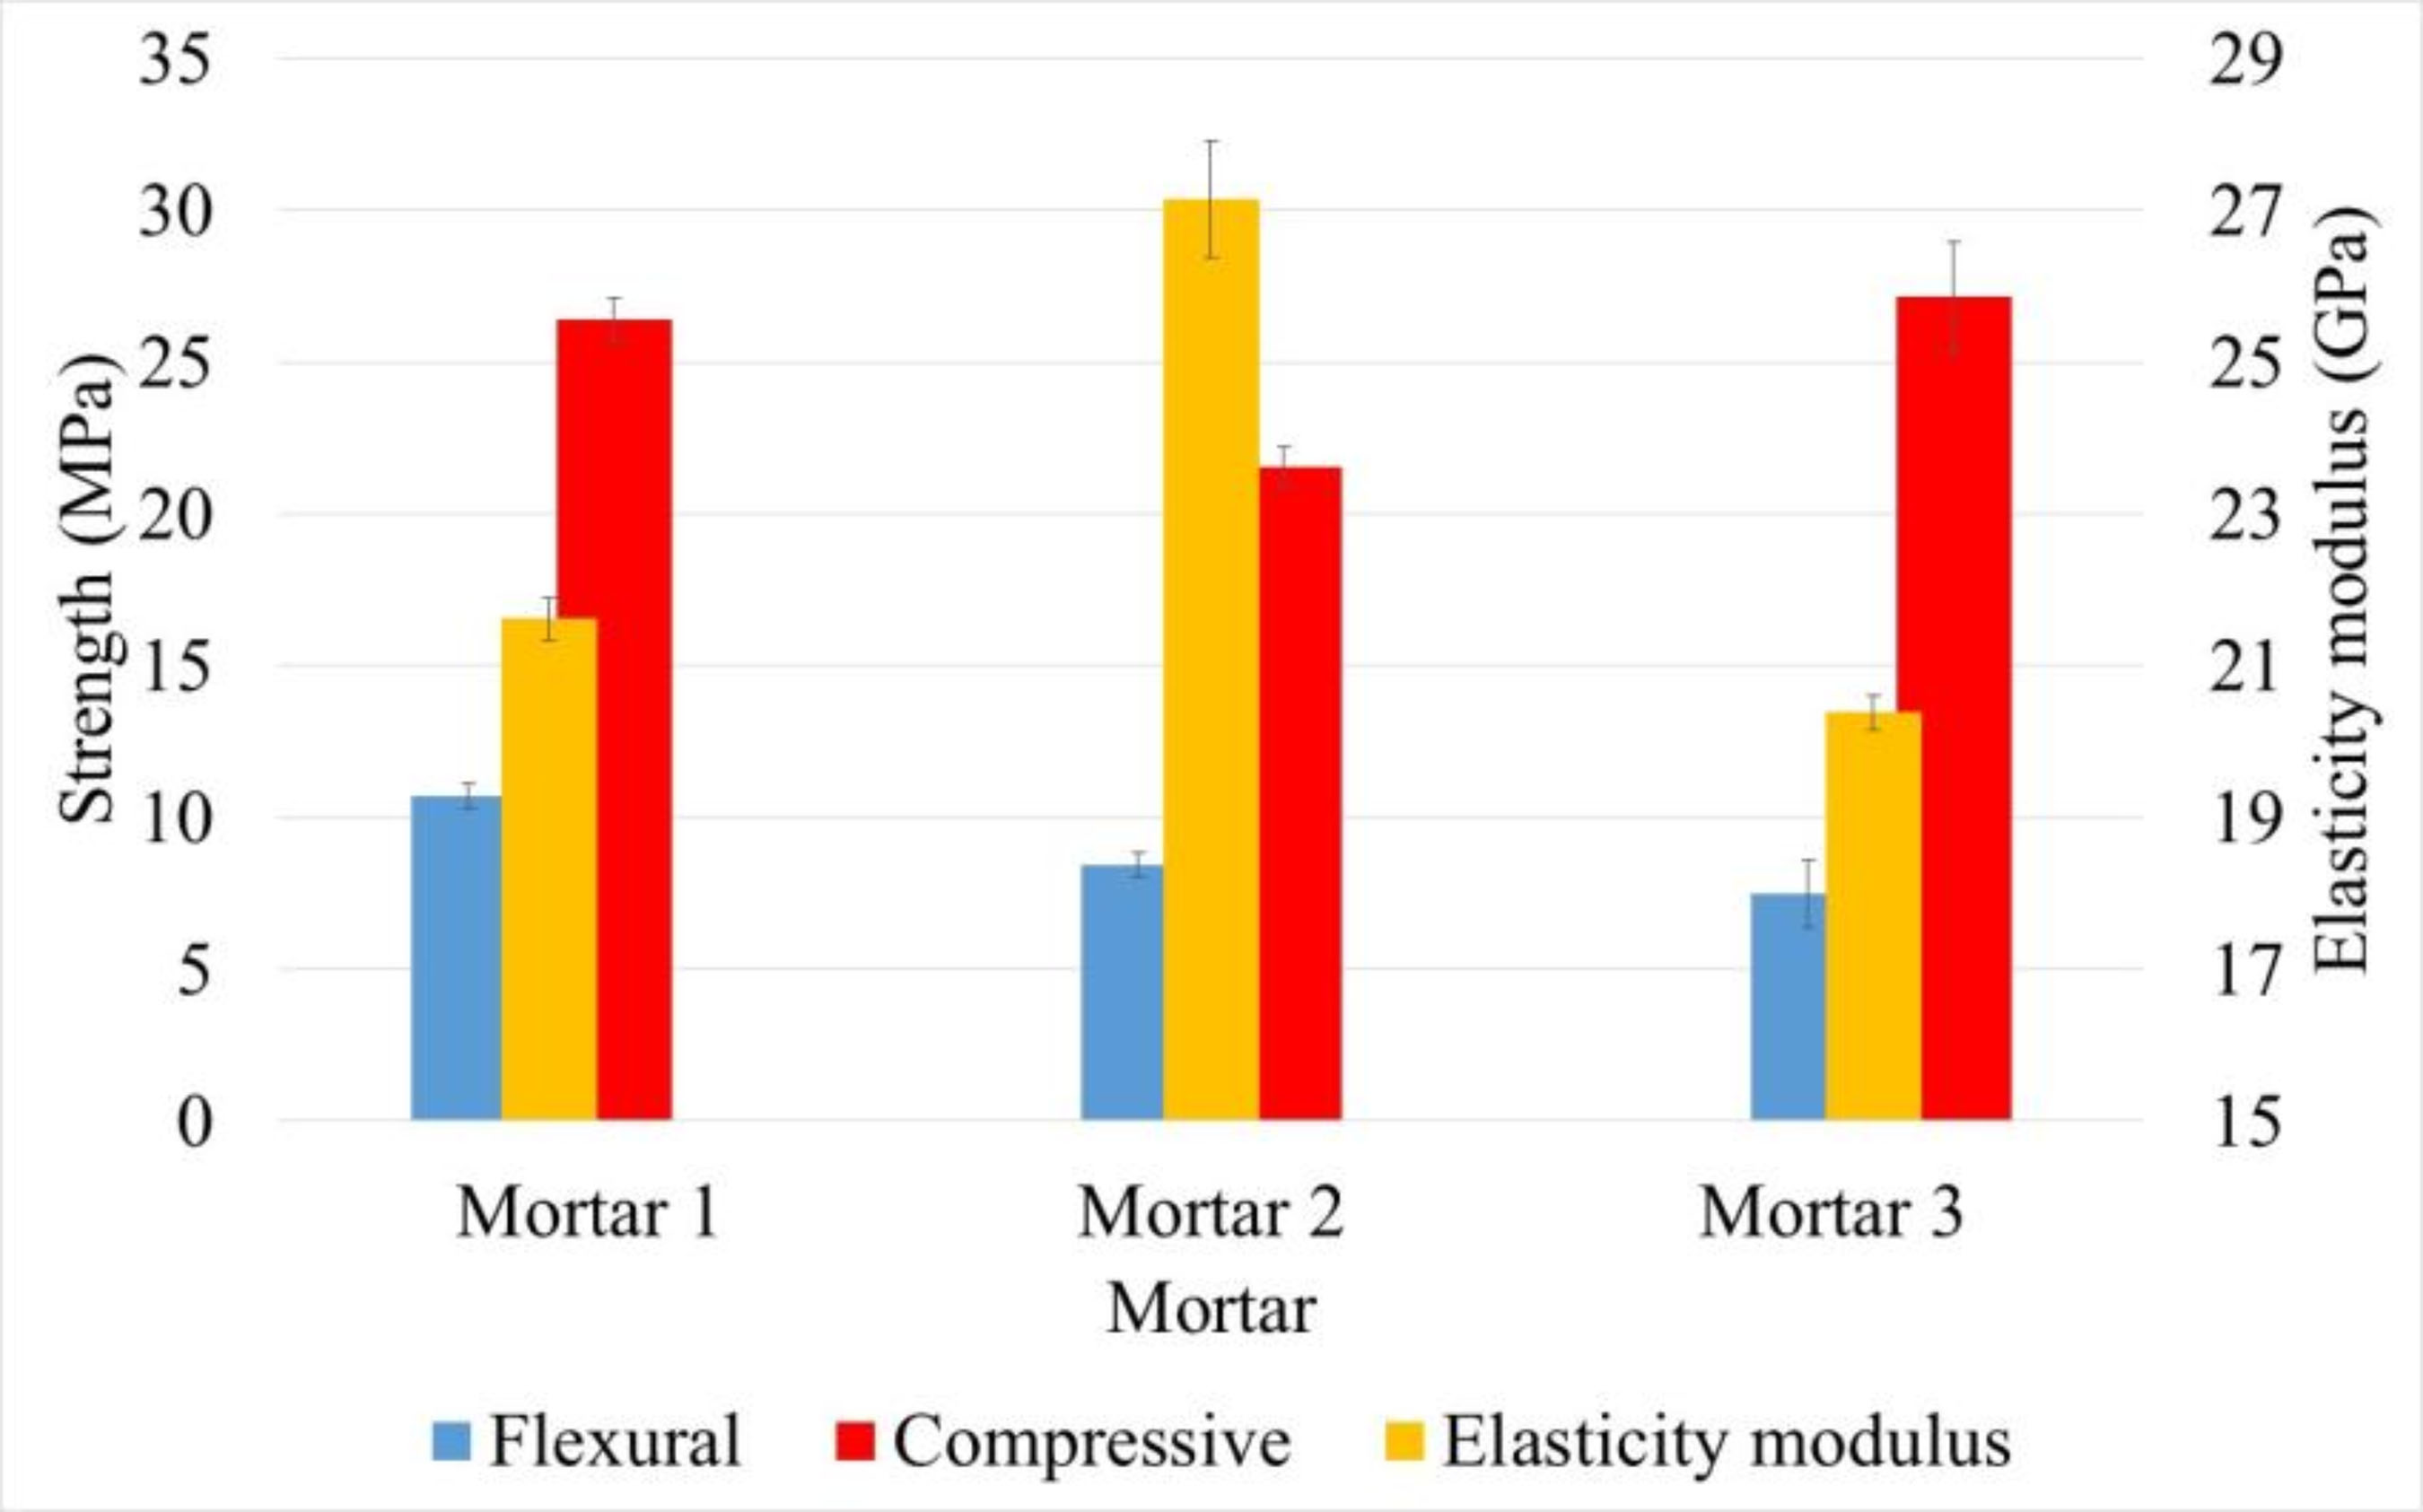
The average values for both flexural and compressive strength are displayed in Table 9 and Figure 22.

Interestingly, Mortar 3 exhibited the highest compressive strength (26% higher - compared to the lowest resistance) but the lowest flexural strength (30% lower - compared to the highest resistance). Conversely, the lowest compressive strength was recorded for Mortar 2. Furthermore, Figure 21 illustrates that the dynamic modulus of elasticity is proportional to the compressive strength for the mortars under evaluation.
It is important to emphasize that the hardened-state properties are largely governed by the composition and mix design adopted by each manufacturer. Accordingly, this study aimed to characterize and compare commercially available self-leveling mortars to identify differences in their performance, particularly considering the absence of specific Brazilian standards. Analyzing the results against the European standard, all analyzed mortars exceeded the minimum required values for both flexural tensile strength and compressive strength.
4 Conclusions
The results demonstrate that, although the three mortars analysed were developed for the same intended application, the distinct formulation of each manufacturer led to significant differences in both fresh and hardened properties.
In the fresh state, substantial variations in mixing efficiency were observed. Mortar 2 required the longest time to reach the torque plateau, exhibited the highest torque, and consumed the greatest amount of mixing energy. Clear correlations were identified between the physical characteristics (D90 and average particle diameter) and the mixing process parameters. The D90 diameter showed strong correlations with maximum torque and mixing energy, while the average particle correlated with both mixing time and mixing energy.
The influence of the water-to-dry material ratio and of the material composition on the initial structuring behavior was evident through their effects on the storage modulus (G′), elasticity factor, and shear stress obtained in the oscillatory test. It is important to highlight that these rheological parameters directly affect the product’s preparation and usability.
Among all the flow and spreading tests, the Spanish cylinder (time measurement) stood out by demonstrating the strongest and most consistent correlations with other parameters studied. This higher accuracy is supported by the number of significant relationships observed, encompassing physical, mixing, and rheological parameters. Therefore, the Spanish cylinder test can be considered, according to this study, the most suitable method for evaluating self-leveling mortars, an interpretation consistent with the recommendations of C1708 (ASTM, 2016).
In the hardened state, clear differences were also observed. Mortar 3 achieved the highest compressive strength, whereas Mortar 1 exhibited the highest flexural tensile strength. Variations were also noted in the dynamic modulus of elasticity, reflecting the influence of each formulation’s composition and microstructure. These final properties are directly related to the product’s intended application.
In conclusion, a comprehensive evaluation of these properties is essential when selecting a self-leveling mortar, ensuring that the material meets the specific performance requirements of each application. For example, Mortar 1, which exhibited a shorter regeneration time, also showed higher yield stress and viscosity, along with superior flexural strength. Its shorter regeneration time requires quicker application rates or mixing in smaller batches to prevent premature stiffening and loss of flow. Moreover, its unfavorable rheological characteristics (high yield stress and viscosity) indicate that its placement would inevitably require greater physical effort from the installer.
Based on these findings, future research should focus on establishing robust correlations between laboratory-derived rheological parameters (such as yield stress and viscosity) and practical and sensitive field tests (such as the V-funnel and Spanish cylinder tests). Ultimately, such correlations are essential to allow users to accurately tailor product use to the specific requirements and specifications of each construction project.
Furthermore, considering the marked differences observed among the three mortars, the results underscore the importance of developing national standard specifications to support quality control and ensure consistent performance of self-leveling mortars in the Brazilian market.
-
CASALI, J. M.; NUNES, L. E.; SILVEIRA, L. G.; ROSA, A. C. da; REICHMANN, A. da M.; CALÇADA, L. M. Analysis of the rheological and mechanical properties of three commercial self-leveling mortars. Ambiente Construído, Porto Alegre, v. 26, e149947, jan./dez. 2026. ISSN 1678-8621 Associação Nacional de Tecnologia do Ambiente Construído. http://dx.doi.org/10.1590/s1678-86212026000100954
-
Declaração sobre IA Generativa e Tecnologias Assistidas por IA no Processo de Escrita
Durante a preparação deste trabalho, o(s) autor(es) utilizou(aram) o ChatGPT para verificar problemas gramaticais e melhorar a legibilidade. Após a utilização desta ferramenta/serviço, o(s) autor(es) revisou(aram) e editou(aram) o conteúdo conforme necessário e assume(m) total responsabilidade pelo conteúdo da publicação.
Declaração de Disponibilidade de Dados
Dados de pesquisa somente disponíveis mediante solicitação ao autor correspondente.
References
- AMERICAN SOCIETY FOR TESTING AND MATERIALS. C1708: standard test methods for self-leveling mortars containing hydraulic cements. West Conshohocken, 2016.
- ASSOCIAÇÃO BRASILEIRA DE NORMAS TÉCNICAS. NBR 13279: argamassa para assentamento e revestimento de paredes e tetos: determinação da resistência à tração na flexão e à compressão. Rio de Janeiro, 2005a.
- ASSOCIAÇÃO BRASILEIRA DE NORMAS TÉCNICAS. NBR 13280: argamassa para assentamento e revestimento de paredes e tetos: determinação da densidade de massa aparente no estado endurecido. Rio de Janeiro, 2005b.
- ASSOCIAÇÃO BRASILEIRA DE NORMAS TÉCNICAS. NBR 13281: argamassa para assentamento e revestimento de paredes e tetos: requisitos. Rio de Janeiro, 2023.
- ASSOCIAÇÃO BRASILEIRA DE NORMAS TÉCNICAS. NBR 13753: revestimento de piso interno ou externo com placas cerâmicas e com utilização de argamassa colante: procedimento. Rio de Janeiro, 1996.
- ASSOCIAÇÃO BRASILEIRA DE NORMAS TÉCNICAS. NBR 15630: argamassa para assentamento e revestimento de paredes e tetos: determinação do módulo de elasticidade dinâmico através da propagação de onda ultra-sônica. Rio de Janeiro, 2008.
- ASSOCIAÇÃO BRASILEIRA DE NORMAS TÉCNICAS. NBR 16765: contrapiso autonivelante de gesso: métodos de ensaio. Rio de Janeiro, 2019.
- ASSOCIAÇÃO BRASILEIRA DE NORMAS TÉCNICAS. NM 23: cimento portland e outros materiais em pó: determinação da massa específica. Rio de Janeiro, 2001.
- ASSOCIACIÓN ESPAÑOLA DE NORMALIZACIÓN Y CERTIFICACIÓN. UNE-EN 13813: pastas autonivelantes y pastas autonivelantes para suelos: características y específicaciones. Madri, 2014.
- BETIOLI, A. M. et al. Caracterização reológica de pasta cimentícia: associação de técnicas complementares. Ambiente Construído, Porto Alegre, v. 9, n. 4, p. 37-48, out./dez. 2009.
- BETIOLI, A. M. Influência dos polímeros MHEC e EVA na hidratação e comportamento reológico de pastas de cimento portland Florianópolis, 2007. 211 f. Tese (Doutorado em Engenharia Civil) - Programa de Pós-Graduação em Engenharia Civil, Universidade Federal de Santa Catarina, Florianópolis, 2007.
- BRASILEIRO, G. C. P. Avaliação do comportamento reológico de argamassas através de reometria rotacional: variação dos tipos de geometria e protocolos de ensaio. São Paulo, 2023. Dissertação (Mestrado em Engenharia de Construção Civil e Urbana) – Universidade de São Paulo, São Paulo, 2023.
- CARVALHO, I. C. et al Evaluation of the effect of rubber waste particles on the rheological and mechanical properties of cementitious materials for 3D printing. Construction and Building Materials, v.411, 134377, 2024.
- EUROPEAN FEDERATION FOR SPECIALIST CONSTRUCTION CHEMICALS AND CONCRETE SYSTEMS. Specification for synthetic resin and polymer-modified cementitious floorings as wearing surfaces for industrial and commercial use London, 2001.
- FRANÇA, M. S.; CARDOSO, F. A.; PILEGGI, R. G. Avaliação do comportamento de mistura de argamassas através de reometria rotacional. Ambiente Construído, Porto Alegre, v. 12, n. 2, p. 165–174, 2012.
- FREITAS, E. R. F. et al. Estudo das adições e aditivos minerais nas propriedades de argamassas auto-nivelantes. In: CONGRESSO NORTE NORDESTE DE PESQUISA E INOVAÇÃO, 5., Maceió, 2010. Proceedings [..] Natal: Connepi, 2010.
- LAM, N. N. Structuration investigation of fast: setting self leveling underlayment based on ettringite binder. Archives of civil engineering, v. 67, 2021.
- MARTINS, E. J. Procedimento para dosagem de pastas para argamassa autonivelante Curitiba, 2009. 140 f. Dissertação (Mestrado em Engenharia Civil) - Programa de Pós-Graduação em Construção Civil, setor de Tecnologia, Universidade Federal do Paraná, Curitiba, 2009.
- MELO, A. R. S. et al. Análise comparativa de propriedades reológicas e mecânicas de diferentes tipos de concreto. In: CONGRESSO BRASILEIRO DO CONCRETO, 65., Maceió, 2024. Proceedings […] Maceió: CBC, 2024.
- MENDES, G. A.; EFFTING, C.; SCHACKOW, A. Argamassa autonivelante com adição de resíduo do corte de Mármores e Granitos (RCGM): propriedades físicas e mecânicas. In: SIMPÓSIO BRASILEIRO DE TECNOLOGIA DAS ARGAMASSAS, 13., Goiânia, 2019. Proceedings [....] Goiânia. ANTAC, 2019.
- MENDES, G. A.; EFFTING, C.; SCHACKOW, A. Argamassa autonivelante com adição de resíduos de mármores e granitos: propriedades físicas e mecânicas. Ambiente Construído, Porto Alegre, v. 20, n. 3, p. 403-418, jul./sep. 2020.
- MODLER, L. E. A.; MOHAMAD, G.; LUBECK, A. Estudo do processo de consolidação de argamassas colantes através da reometria oscilatória. Ambiente Construído, Porto Alegre, v. 25, e143465, jan./dez. 2025.
- MODLER, L. E. A.; MOHAMAD, G.; LUBECK, A. Hardening process of polymeric adhesive mortars: Approach by phase angle analysis from oscillatory rheometry. Construction and Building Materials, v. 271, 121521, 2021.
-
MORDOR INTELLIGENCE. Tamanho do mercado de cobertura de piso e análise de ações: tendências e previsões de crescimento (2024–2029) 2024. Available: https://www.mordorintelligence.com/pt/industry-reports/global-floor-covering-market Access: 26 jul. 2025.
» https://www.mordorintelligence.com/pt/industry-reports/global-floor-covering-market - OLIVEIRA, M. A. P. Estudo comparativo das propriedades reológicas e mecânicas dos concretos produzidos com diferentes aditivos redutores de água Belo Horizonte, 2016. Dissertação (Mestrado em Construção Civil) – Programa de Pós-Graduação em Engenharia de Materiais e Construção, Universidade Federal de Minas Gerais, Belo Horizonte, 2016.
- R CORE TEAM. R: A language and environment for statistical computing. R Foundation for Statistical Computing, Vienna, 2024. Available: //www.R-project.org/. Access: 15 oct. 2025
- ROMANO, R. C. O. et al. Combined evaluation of oscillatory rheometry and isothermal calorimetry for the monitoring of hardening stage of Portland cement compositions blended with bauxite residue from Bayer process generated in different sites in Brazil. Revista IBRACON de Estruturas e Materiais, v. 14, 2021.
- RUBIN, A. P. Argamassas autonivelantes industrializadas para contrapiso: análise do desempenho físico-mecânico frente às argamassas dosadas em obra. Porto Alegre, 2015. Dissertação (Mestrado em Engenharia Civil) – Programa de Pós-Graduação em Engenharia Civil, Universidade Federal do Rio Grande do Sul, Porto Alegre, 2015.
- SANGTARASHHA, A. et al Shrinkage of highly flowable cement paste reinforced with glass fiber. In: INTERNATIONAL CONFERENCE ON CEMENT COMPOSITES AND COMPOSITE MATERIALS, Johannesburg, 2009. Proceedings [...] Johannesburg, 2009.
- SEIFERT, S.; NEUBAUER, J.; GOETZ-NEUNHOEFFER, F. Spatially resolved quantitative in-situ phase analysis of a self-leveling compound. Cement and Concrete Research, v. 42, n. 7, p. 919–927, 2012.
- SILVA, B. J. et al. Levantamento das composições utilizadas na produção de argamassas autoadensáveis. In: ENCONTRO NACIONAL DE TECNOLOGIA DO AMBIENTE CONSTRUÍDO, 19., Canela, 2022. Proceedings [...] Porto Alegre: ANTAC, 2022.
- SINGH, A.; THAKARE, A. A.; CHAUDHARY, S. A case study on examining the fresh-state behavior of self-compacting mortar containing waste powders from various sources. Case Studies in Construction Materials, v.19, e02684, 2023.
- WINNEFELD, F.; HOLZER, L. Monitoring early cement hydration by rheological measurements. In: INTERNATIONAL CONGRESS ON THE CHEMISTRY OF CEMENT, 11., Durban, 2003. Proceedings […] Durban: ICCC, 2003.
Edited by
-
Editor:
Enedir Ghisi



 Source: (a)