
 Multi-criteria decision-making model for economic-financial performance assessment to support investment decisions
ABSTRACT
To select an investment in the banking sector, it is essential to assess not only the profitability of the organization, but also conduct an overall analysis of its efficiency. Thus, investors study a large amount of financial data, which is an extremely complex task. The aim of this study is to propose a multi-criteria model to assess the economic-financial performance of the main banks listed on the Brazilian Stock Exchange, by integrating the accounting indicators in order to support investment decisions. To that end, twelve criteria were considered, divided into three categories to assess the economic-financial indicators of eight banking institutions listed on the stock exchange. The Swing Weights Procedure was used to establish the relative importance of the criteria and IV-TOPSIS to analyze and rank the alternatives. The results demonstrate that the BTG Pactual, Pine and Modal banks are the best institutions to invest in. It was concluded that the model proposed contributed to consistent and reliable investment decisions.
KEYWORDS:
Economic-financial performance assessment; Investment decisions; Multi-criteria decision making
RESUMO
Para a seleção de um investimento no setor bancário, é necessário avaliar não somente a lucratividade da organização, mas também efetuar uma análise global de sua eficiência. Os investidores passaram então a estudar grande quantidade de dados financeiros, tornando-se tarefa de extrema complexidade. Nesse contexto, o objetivo do estudo foi propor um modelo multicritério de avaliação do desempenho econômico-financeiro dos principais bancos listados na Bolsa de Valores Brasileira (B3) por meio da integração de indicadores contábeis para apoiar decisões de investimentos. Para isso, foram considerados doze critérios divididos em três categorias para avaliação dos indicadores econômico-financeiros de oito instituições bancárias que negociam ações na Bolsa de Valores. O Swing Weights Procedure foi utilizado para a definição da importância relativa dos critérios, e o método IV-TOPSIS foi responsável pela análise e ranqueamento das alternativas. Os resultados demonstraram que os bancos BTG Pactual, Pine e Modal são as melhores instituições para se investir. Concluiu-se que o modelo proposto forneceu subsídios para decisões de investimento consistentes e confiáveis.
Palavras-chaves:
Avaliação de Desempenho econômico-financeiro; Decisões de Investimentos; Apoio Multicritério à Decisão
1 INTRODUCTION
The banking sector plays an important role in the economy of every country, and is strongly influenced by numerous external factors, in addition to producing positive or negative effects in other business areas (Akkoç & Vatansever, 2013). Considered a driving force for the economy, banks are one of the main entities responsible for achieving macroeconomic objectives, given their key function of driving monetary policy (Amile et al., 2013; Banu & Santhiyavalli, 2019).
Financial institutions traditionally exert two basic functions: 1) stimulating payment mechanisms in the country and 2) intermediating the receipt of resources from surplus spending units and transferring them to deficit spending units (Assaf Neto, 2020). However, due to competition, globalization, and the pressures caused by the highly volatile market, these are now considered not only money negotiators, but also entities that promote financial development. They diversify their business portfolios, offering services such as mutual funds, factoring, leasing, real estate financing, risk capital, and share trading, among others (Banu & Santhiyavalli, 2019).
Due to the diversification of business banking, public offering of their shares on the investment market became commonplace. Banks started to occupy an important position in this segment, attracting the interest of numerous investors (Gupta et al., 2020). To that end, reliable financial management analysis and the economic performance of these institutions became decisive in supporting the investment decision-making process (Onder & Hepsen, 2013). In this respect, quantitative methods that help decision-making are useful for this type of business.
Decision-making methods for investment selection in the banking sector are challenging, with both organizational profitability and overall analysis of its efficiency considered essential in this process. As such, investors study a large amount of financial data, such as profitability, liquidity, and solvency indicators, making the task extremely complex (Gupta et al., 2020; Nguyen et al., 2020).
Investors typically have access to basic information for the investment decision-making process, such as share price, published financial reports, and other data related to the company and disseminated by other institutions (Bortoluzzi et al., 2012). Prior study of these data would help select a financially solid banking institution for individuals channeling their resources, given that a poorly analyzed investment could compromise the financial future of the investor (Gupta et al., 2020).
As such, analysis of economic-financial performance began to attract the attention of managers, financial specialists, creditors, and investors (Nguyen et al., 2020). This analysis consists of executing procedures aimed at summarizing operational and financial data to obtain an overview of the economic and financial aspects of the institution (Banu & Santhiyavalli, 2019).
Several concepts associated with financial management help determine organizational performance, such as liquidity and debt level. This technique makes it possible for managers to obtain information that helps in the economic decision-making process (Gupta et al., 2020). Measuring this performance is considered one of the most effective methods to establish the real economic and financial situation of institutions (Amile et al., 2013).
Thus, the combination of several indicators to analyze a banking institution makes it possible to provide detailed knowledge that will support the investor in selecting the best investment (Akkoç & Vatansever, 2013). However, the individual use of these traditional indicators is considered a mono-criterion. In other words, if analyzed separately, they will not be able to adequately correlate the overall financial performance of the entity (Bortoluzzi et al., 2012). On the other hand, multi-criteria analysis encompasses several indicators and provides a more robust analysis.
Thus, multi-criteria methods are rapidly gaining popularity due to their ability to integrate economic-financial indicators and provide an overall view of the organization (Bortoluzzi et al., 2012; Sama et al., 2020). Applying this methodology allows the assessment of several alternatives in different units, differentiating it from traditional decision-making support methods, where criteria are changed in each unit (Akkoç & Vatansever, 2013).
Given the relevance of the problem, this study proposes a multi-criteria model to assess the economic-financial performance of the main banks listed on the Brazilian Stock Exchange (B3) by integrating accounting indicators to support investment decisions.
2 MULTI-CRITERIA DECISION MAKING (MCDM) TO ASSESS ECONOMIC-FINANCIAL PERFORMANCE
In the MCDM literature, pioneering research in financial indicator analysis was conducted by Balezentis et al. (2012). The authors aimed to provide a new procedure for the integrated assessment and comparison of Lithuanian economic sectors, using financial indicators in a set of Fuzzy multi-criteria methods. Comparison involved a set of financial indicators from different economic sectors in the country, applying multi-criteria methods. The study was conducted between 2007 and 2010, starting at the onset of the economic recession and ending near the beginning of the recovery period, thereby observing the economic sectors with the highest and lowest development.
As a result, it was found that companies operating in the hospital, mining, information, and converting industries were the most efficient in executing their activities. On the other hand, the construction, real estate, and transport industries were the most affected by the economic crisis that devastated the world during the study period (Balezentis et al., 2012).
Krivka (2014) also analyzed the impact of the 2008 economic crisis, more specifically on Lithuanian industries. The author carried out a complex analysis on the impact of the crisis on Lithuanian industries, based on a system of quantitative indicators that characterized the financial situation and performance of these companies. The sample was composed of 68 companies with different economic activities between 2006 and 2011. Ten financial indicators belonging to the profitability, liquidity, solvency, and asset turnover groups were selected. The methods applied were Simple Additive Weighting (SAW), Technique for Order of Preference by Similarity to Ideal Solution (TOPSIS) and VlseKriterijumska optimizacija I Kompromisno Resenje (VIKOR), with their classifications and changes determined based on the pre-crisis, crisis, and post-crisis periods. The results showed the industrial sectors that improved and consequently obtained a higher ranking, and those with the greatest decline for the period, demonstrating the companies most affected by the economic crisis.
Vavrek et al. (2021) also used financial indicators and multi-criteria methodology to assess the efficiency of a public sector organization. The aim of their study was to highlight the importance of selecting adequate indicators using a case study that assessed the financial health of a municipality, as a way to measure management efficiency. Twenty-two financial and non-financial indicators were combined, including thirty-two Czech Republic municipalities. The results underscore the need to clearly identify the relevant alternatives for analysis even before selecting the indicators themselves, since assessing with a small number of indicators proved to be insufficient and highly variable in effectively measuring the financial management of these public entities.
With respect to applying the financial indicators and MCDM to support investment decisions, Hsu (2014) aimed to develop an investment decision-making process that could address the risks involved in this selection. The methodologies used included the VIKOR method combined with weighted entropy in order to assess and classify the businesses. Twenty-one financial and four risk indicators were used to analyze 62 low, moderate, and high-risk optoelectronic companies listed on Taiwan´s Stock Exchange (TWSE). The results identified the indicators that most affected the companies´ financial performance, such as long-term capital and stock turnover indicators. Given the diversity of investment portfolios, these data provide support for investors’ decisions.
In the agricultural sector, Nguyen et al. (2020) proposed a model to present an ideal set of investment actions, based on the performance of companies listed on the Vietnam Stock Exchange (VSE). The authors used around 20 financial indicators from 13 companies between 2016 and 2019, integrating multi-criteria techniques. As a result, the model provided useful quantitative information on ranking to investors and analysts, functioning as an excellent financial health assessment tool.
In the petrochemical sector, Shaverdi et al. (2016) developed a decision-making model that allowed information users to measure company performance by applying the analytic hierarchy process (AHP) and TOPSIS multi-criteria methods. The model was applied to seven companies on the Tehran Stock Exchange (TSE), based on their financial information between 2003 and 2013. Indicators measured liquidity, financial leverage, activity, profitability, and institutional growth. The results demonstrated company ranking based on their financial information, as reported in the abovementioned studies that used multi-criteria methods.
In the energy sector, Sun (2018) scientifically and ecologically assessed the financial performance of Chinese companies using the AHP multi-criteria method. To that end, 18 financial indicators were selected based on solvency, profitability, and operational and developmental capacity. The sample consisted of 103 companies listed on the Shanghai Stock Exchange (SSE). The results showed that in general, companies that are highly solvent and profitable obtain a higher final ranking. As such, it can be concluded that these indicators are relevant for the performance of energy companies listed on the SSE.
Finally, two studies stand out in the banking sector: Akkoç and Vatansever (2013) and Gupta et al. (2020). In the former, the authors used AHP and TOPSIS Fuzzy methods to analyze twelve commercial banks on the Borsa Istanbul (BIST), based on seventeen financial performance indicators. The study showed that both approaches obtained similar results.
Similarly, Gupta et al. (2020) classified the performance of private Indian banks based on their financial capacity, using a hybrid multicriteria decision-making technique integrating AHP and TOPSIS. The model was based on ten financial performance indicators for banks with shares on the Bombay Stock Exchange (BSE) between 2014 and 2019, in order to create a general ranking of these institutions.
The results made it possible to identify the highest ranked financial institution during the study period, based on their financial information, showing the possible reference indicators for other banks. It also revealed the institution with the lowest ranking every year. The authors concluded that the model allowed investors to efficiently analyze which institution should be invested in and the banks could compare their results with competitors to improve their results (Gupta et al., 2020).
Finally, it is worth mentioning that papers that analyze time series with MCDM are not very common, especially with real cases and in finance, as was the case of Gupta et al. (2020) and the present paper. The paper by Campello et al. (2023) presents a good explanation of this issue.
Despite the contributions of the aforementioned studies, it is worth highlighting that the proposal presented here brings new contributions to the area in question. Firstly, there is the contribution to the reality studied, that is, the model was developed based on parameters that consider the Brazilian banking sector, such as specific criteria and weightings from Brazilian experts. Furthermore, the model advances the way in which weights are determined, by proposing the use of the swing weights procedure, which simplifies the weighting process for decision makers, while at the same time being more realistic and robust.
Finally, four studies are suggested on the relationship between MCDM and finance. Zopounidis et al. (2015) and Masri et al. (2018) discuss the contributions of MCDM in different areas of financial decision making. Almeida-Filho et al. (2021) contribute by setting out a categorisation of the kinds of problems approached in the reviewed papers and by verifying a set of relevant research questions for which statistical tools are used, while Černevičienė and Kabašinskas (2022) go further by presenting a review and classification of MCDM methods in finance that help to achieve the goal of creating artificial intelligence-based methods that are explainable, transparent, and interpretable.
3 METHODOLOGICAL ASPECTS
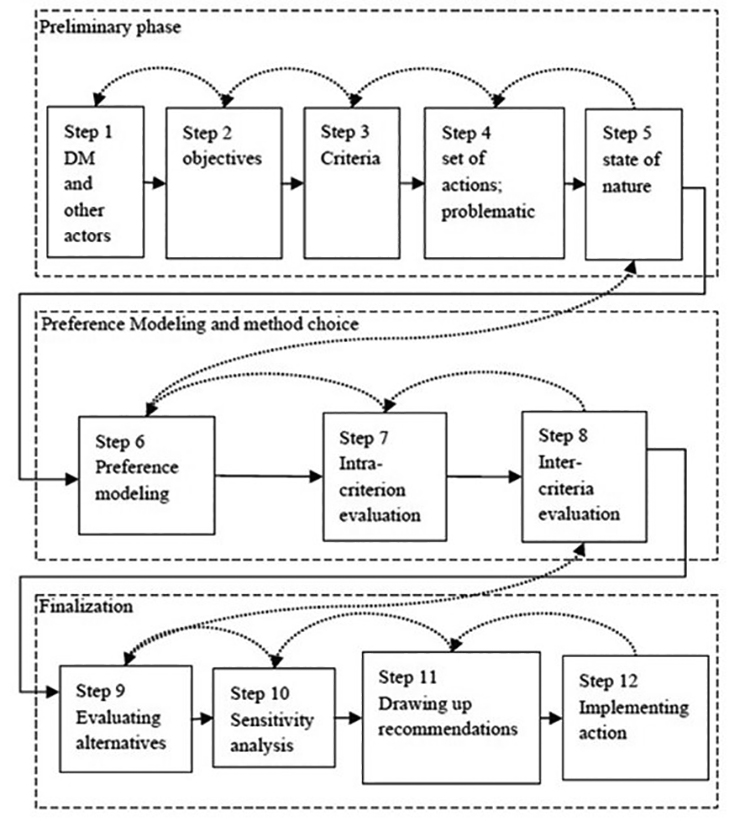
To construct the model, the study used the three phases suggested by De Almeida et al. (2015), as shown in Figure 1, where the first two are presented in this section and the last in the discussion of results.
In the preliminary phase, in line with the objective of proposing a multi-criteria assessment model of the economic-financial performance of the main banks listed on the B3, the criteria were established based on the studies of Marion (2019), Assaf Neto (2020) and Gupta et al. (2020). The indicators, criteria and their calculations are presented in Table 1.
Marion (2019) related traditional accounting indicators commonly used by different areas, while Gupta et al. (2020) observed the most relevant to be applied in the Brazilian banking industry and the paper by Assaf Neto (2020) proposed indicators specifically for banking institutions.
For numerical application, the B3 banking sector, which consisted of 26 institutions in 2021, was selected. In addition, only banks that invested in the implementation and/or execution of corporative governance were selected. In general, corporate governance mechanisms seek to align management´s goals with those of its investors and shareholders (Pinheiro et al., 2017). Thus, only institutions classified as Level 1 (N1), 2 (N2) and New Market (NM), according to the listing segments proposed by B3, were analyzed. It is important to note that institutions whose main activity is as a holding company (two institutions) were excluded, as well as those that changed the chart of accounts of their accounting statements in 2020 (three institutions), given that the location of information necessary for the study was affected.
Thus, the sample was composed of eight banks (alternatives) classified in these segments, as shown in Table 2. Tavares and Penedo (2018) reported that this listing segment is related to good corporate governance practices and the entities classified as NM are considered companies with high governance standards, while those belonging to N2 exhibit a medium level and N1 a low level of corporate governance.
After the first phase of preliminary definitions, the second phase, involved determining preferred modeling and method selection, was undertaken. In this respect, the structure (P, I) was established based on its capacity to provide a complete ordering of alternatives. In addition, given that compensation is allowed among the criteria in the problem analyzed and that it must consider a time interval, Interval-Valued TOPSIS, an extension of TOPSIS, was the method used. Interval-Valued TOPSIS was developed in 2006 by Jahanshahloo et al. to analyze interval values, identifying the alternatives that are nearest the possible best ideal solutions and farthest from the negative ideal solutions of a particular problem (Jahanshahloo et al., 2011; Mathew & Thomas, 2019).
Furthermore, the choice of IV-TOPSIS over other MCDM methods for time series was due to their success with using financial time series based on real cases, something not so common in the literature, as well as its simplicity of use, which facilitates the replication of the model proposed here in new similar cases.
About IV-TOPSIS, consider that A1 , A2 ,..., An are m possible alternatives among which decision makers have to choose, C1 , C2 ,..., Cn are criteria with which alternative performance are measured, xij is the rating of alternative A1 with respect to criterion Cj and is not known exactly and only we know xij . A MCDM problem with interval data be concisely expressed in matrix format as:
Where 𝑤 𝑗 is the weight (i.e. the relative importance of each criterion comparatively) of criterion Cij
Based on the above, Interval-Valued TOPSIS can be expressed in a series of six steps, according to Jahanshahloo et al. (2006):
Step 1: Calculate the normalized decision matrix with values of and
where I is associated with benefit criteria, and J is associated with cost criteria.
Step 2: Calculate the weighted normalized decision matrix with values of and
Step 3: Determine the positive ideal and negative ideal solution
where I is associated with benefit criteria, and J is associated with cost criteria.
Step 4: Calculate the distances of each alternative i in relation to the ideal solutions
Step 5: Calculate the relative closeness to the ideal solution
Step 6: Arrange the alternatives in descending order. The highest 𝑅 𝑗 value indicates the best performance in relation to the evaluation criteria
In addition to IV-TOPSIS, the Swing Weights Procedure (Edwards & Barron, 1994) was used to define the relative importance (weight) of the categories of each criterion. This procedure can be used to model decision problems more realistically, since scores are based on changes in attributes or the direct attribution of weight intervals (Danielson & Ekenberg, 2019), which made it widely used and accepted - see Beynon and Kitchener (2005), Medeiros and Ferreira (2018), Németh et al. (2019), and Aires and Salgado (2022).
Even with other methods that can be used, such as the Direct Assignment Technique itself, Principal Component Analysis (PCA) or AHP, used by Gupta et al. (2020), among others, the choice for the Swing Weights Procedure was made because it is a procedure that allows the inclusion of stakeholders' preferences, being considered robust and transparent (Ezell et al., 2021; Mussoi & Teive, 2021; Amaro et al., 2022), at the same time as it is simple, as it determines the weights by systematically comparing attributes with those considered less important (Ezell, Lynch, & Hester, 2021; Amaro et al., 2022).
To that end, two investment specialists were consulted. The first has a Ph.D in accounting sciences, specializing in the analysis of the feelings and influences of individuals in investment decisions. The second specialist holds a Ph.D in economics, conducting studies on the Brazilian share market.
For weight attribution, a hypothetical situation is established as the worst possible hypothesis (benchmark) for all the categories and criteria, assigning it a score of 0 (Mustajoki et al., 2005; Mustajoki et al., 2006). Next, the specialists were asked which of the criteria in each of the categories were the most important, given the objective of proposing a multi-criteria assessment model of economic-financial performance of the institutions in question. The best assessment (category and criterion) received a score of 100 and the others were defined proportionally, according to the most and least relevant.
Both specialists gave their assessment and, with this analysis, the weights of each category and criterion were calculated based on their scores divided by the sum of the scores of all the criteria in that category. Thus, the final weights were calculated by the average of the individual assessments, multiplied by the proportional weight of their category. The results are presented in Table 3.
The final phase is presented in the results section, where the alternatives are assessed by applying the decision model, and sensitivity is analyzed. In addition, final recommendations are given for the case analyzed.
4 RESULTS AND DISCUSSION
According to the model proposed by De Almeida et al. (2015), the finalization phase involves assessing the available alternatives, analyzing result sensitivity and presenting the study recommendations. To that end, the accounting indicators established as criteria for the study were calculated for the period between 2016 and 2020. These data were used to construct the decision matrix, which is compiled from the information collected. Since several options are considered in each criterion within a time interval, the first column is classified as being the lowest score and the second the highest score observed for each criterion in its respective alternative, encompassing the entire period. The data are presented in Tables 4 and 5 to facilitate understanding.
Next, the other steps were carried out, considering the weights contained in Table 3. The final result is presented in Table 6, in terms of DPIS, DNIS, CC and ranking order.
In the next result, BTG Pactual is classified as the best investment bank, considering the economic-financial aspects, followed by the Pine and Modal banks, while the worst is the BMG bank, followed by the Inter and Mercantil.
This can be explained by a number of factors, primarily the size of the institution. BTG Pactual bank was the largest institution in the sample, with total assets in 2020 of around BR$250 trillion, representing an increase of approximately 85 % when compared to the start of the period, in 2016. Revenues, in turn, rose by about 25 % during the period. As such, the institution had the highest total assets, revenues, and profits of the sample. This result corroborates what Oliveira et al. (2021) reported, given that large banking institutions have a direct influence on their results because they offer greater business diversity, contributing to the increase in revenues and consequently profits, considered by some analysts and investors as solid entities with strong growth.
With respect to liquidity and solvency, BTG Pactual obtained the best results for C1 and C2, justified by having more resources in the available groups and interfinancial applications, albeit with the worst result in C5, due to the high value of its credit operations. The ABC, Inter, and Pan banks achieved the best results in criteria C3, C4, and C5, respectively. These indicators generally involve equity resources (assets and liabilities), reflecting the financial capacity of the entity to quickly supply the demand for available resources (Assaf Neto, 2020).
The liquidity and solvency group is classified by analysts as the most relevant in banking institutions, considered an essential item for economic, financial and operational feasibility. Banks must have enough resources to deal quickly with a number of situations, such as withdrawals, investment redemption, concessional loans, and financing. (Niederauer et al., 2018). To that end, establishing the ideal liquidity level for banks is a complex task that requires in-depth analysis of the context of resource sources and investments, which sometimes cannot be measured only with accounting statements (Assaf Neto, 2020).
Regarding capital indicators, BMG bank obtained the best result in C6 and the worst in C7, Mercantil achieved the best score in C7, BTG Pactual in C8 and Pine in C9. This group of indicators are a safety parameter for banks, since they exhibit a level of financial slack that is financed by their own resources, that is, their equity. However, banking activities are vulnerable to external economic factors, such as interest rates and the country´s monetary policy, factors considered inconstant (Assaf Neto, 2020). However, it is important to accurately measure the performance of these institutions, in view of the relevant role they play in society (Akkoç & Vatansever, 2013).
In the profitability category, BTG Pactual achieved the best and Pine bank the worst results in C10, C11, and C12. These findings are justified because the former institution obtained the highest profit in the sample, while the latter was the only bank to report a loss during the period. Nevertheless, Pine was the second-best overall alternative, and despite the negative results in certain indicators, the overall result varied according to the other categories. An institution can typically achieve excellent results in an indicator and a relatively low value in another, but one result invalidates the other, making it necessary to observe a set of data (Amile et al., 2013).
The size of some institutions influence profitability because the diversity of their business portfolio means the larger the bank, the lower its risks, thereby expanding revenues (Mendonça et al., 2018). The higher the profitability, the greater the value of the institution, reaching a positive ratio with its share price in capital markets (Mendonça et al., 2017; Oliveira et al., 2021). Thus, these aspects reinforce the results found in the present study.
Analysis of the economic-financial indicators of banking institutions has several limitations, because of the numerous differences from traditional entities (Niederauer et al., 2018). However, the multi-criteria model proposed obtained relevant results in terms of overall analysis of the financial indicators of banking institutions, allowing replications and the inclusion of new alternatives in its analysis without compromising data reliability, helping investors make the ideal investment choice.
Finally, the aim of this study was to demonstrate the usefulness of the model in encompassing the multiple factors involved in assessing economic-financial performance to support investment decisions, not suggesting that it is the only correct model to use.
4.1 Sensitivity Analysis
A sensitivity analysis was conducted to assess the impact caused by a 10 % variation (more or less) in the category and criteria weights on the stability of the final classification. As one measures increases or decreases, the difference is equally distributed in the rest of the criteria. Table 7 presents the variation in weights and percentage change in the ranking.
The last line of Table 7, denominated % change, indicates the percentage of cases in which the positions of the alternatives changed from the original classifications obtained. In general, the ranking showed satisfactory stability in response to changes in criteria weights. On average, only 20.83 % of the alternative positions in the rankings were altered. It is important to note that the changes occurred due to the proximity of the results obtained by some of the alternatives in the original ranking. Thus, changes in positions caused by altered weights can be considered natural.
In general, with the new rankings created, the following was observed:
-
Alternatives A1 and A2 inverted their positions with an increase in criteria weights in the solvency/liquidity category;
-
Alternatives A4 and A7 inverted their positions with a decrease in criteria weights in the solvency/liquidity category;
-
Alternatives A1 and A2 inverted their positions with a decline in criteria weights in the capital category;
-
Alternatives A4 and A7 inverted their positions with an increase in criteria weights in the profitability category;
-
Alternatives A1 and A2 inverted their positions with a decrease in criteria weights in the profitability category.
In addition, the first three positions did not change in the rankings. Thus, the changes did not cause the same effect, since an average of 79 % of the positions remained the same. The solvency/liquidity and profitability categories were the most decisive in the changes observed in relation to the final result, influencing the change of positions of only some of the alternatives. As such, they are the most critical criteria in the model.
5 FINAL CONSIDERATIONS
This study demonstrated the use of the Interval-Valued TOPSIS multi-criteria method as an assessment tool for the economic-financial performance of banks listed on the Brazilian Stock Exchange (B3), integrating the accounting indicators to support investment decisions. The proposed model made it possible to create a ranking of alternatives, promoting an in-depth analysis of the data collected, thereby allowing investors to identify the best institution to channel their investments.
The results obtained show that, based on their financial information between 2016 and 2020, the best stock exchange institutions would be BTG Pactual, followed by Pine and Modal banks. By contrast, the institutions classified as negative were the Inter and BMG banks. The results revealed the need for continuous monitoring of economic-financial indicators, since they change constantly within the banking segment, thereby influencing overall analysis of the institution.
Given the above, the study results obtained were considered satisfactory, thereby achieving the initial objective. Based on the proposal presented, this study provides a higher degree of security in terms of the productivity and efficiency of the banking sector, demonstrating a robust mathematical model capable of producing an overall result, identifying the influence of individual indicators on the information as a whole.
Furthermore, this study brings new contributions to the area, considering that the model was developed based on parameters that consider the Brazilian banking sector, such as specific criteria and weightings by Brazilian experts, in addition to advancing the way in which weights are determined, given the use of the swing weights procedure, which simplifies the weighting process for decision makers, while being more realistic and robust.
Finally, a limitation of the study was the non-homogeneous sample in terms of institutional size. It is therefore suggested that future studies involve a more homogeneous sample, using some proportionality rate, as well as including other financial institutions and entities from different sectors that trade shares on the stock exchange. Likewise, using the model with different characteristics, such as using PCA to elicit weights, for example, something common in MCDM - see Scala et al. (2016) for more details, seems to be a good line of investigation.
References
- Aires, R. F. F. & Salgado, C. C. R. (2022). A Multi-Criteria Approach to Assess the Performance of the Brazilian Unified Health System. International Journal of Environmental Research and Public Health, 19(18), 11478.
- Akkoç, S. & Vatansever, K. (2013). Fuzzy performance evaluation with AHP and TOPSIS methods: Evidence from Turkish banking sector after the global financial crisis. Eurasian Journal of Business and Economics, 6(11), 53-74.
- Almeida- Filho, A. T., Silva, D. F. L., & Ferreira, L. (2021). Financial modelling with multiple criteria decision making: A systematic literature review. Journal of the Operational Research Society, 72(10), 2161-2179.
- Amaro, S. L., Barbosa, S., Ammerer, G., Bruno, A., Guimerà, J., Orfanoudakis, I., Ostrega, A., Mylona, E., Strydom, J., & Hitch, M. (2022). Multi-Criteria Decision Analysis for Evaluating Transitional and Post-Mining Options - An Innovative Perspective from the EIT ReviRIS Project. Sustainability, 14, 2292.
- Amile, M., Sedaghat, M., & Poorhossein, M. (2013). Performance evaluation of banks using Fuzzy AHP and TOPSIS, case study: State-owned banks, partially private and private banks in Iran. Caspian Journal of Applied Sciences Research, 2(3), 128-138.
- Assaf Neto, A. (2020). Estrutura e análise de balanços: um enfoque econômico-financeiro. (12th ed.). Atlas.
- Balezentis, A., Balezentis, T., & Misiunas, A. (2012). An integrated assessment of Lithuanian economic sectors based on financial ratios and fuzzy MCDM methods. Technological and Economic Development of Economy, 18(1), 34-53.
- Banu, A. R. R. & Santhiyavalli, G. (2019). A TOPSIS approach to evaluate the financial performance of scheduled commercial banks in Índia. IOSR Journal of Business and Management, 21(2), 24-33.
- Beynon, M. & Kitchener, M. (2005). Ranking the ‘Balance’ of State Long-Term Care Systems: A Comparative Exposition of the SMARTER and CaRBS Techniques. Health Care Management Science, 8, 157-166.
- Bortoluzzi, S. C., Ensslin, S. R., Ensslin, L., & Lyrio, M. V. L. (2012). Proposta de um modelo de avaliação de desempenho para apoiar decisões de investimento em empresas da Bovespa: a perspectiva da MCDA-C. ABCustos, 7(2), 53-78.
- Campello, B. S. C., Duarte, L. T., & Romano, J. M. T. (2023). Exploiting temporal features in multicriteria decision analysis by means of a tensorial formulation of the TOPSIS method. Computers & Industrial Engineering, 175, 108915.
- Černevičienė, J., & Kabašinskas, A. (2022). Review of Multi-Criteria Decision-Making Methods in Finance Using Explainable Artificial Intelligence. Frontiers in Artificial Intelligence, 5, 827584.
- Danielson, M. & Ekenberg, L. (2019). An improvement to swing techniques for elicitation in MCDM methods. Knowledge-Based Systems, 168, 70-79.
- De Almeida, A. T., Cavalcante, C. A. V., Alencar, M. H., Ferreira, R. J. P., Almeida- Filho, A. T., & Garcez, T. V. (2015). Multicriteria and multiobjective models for risk, reliability and maintenance decision analysis. Springer.
- Edwards, W. & Barron, F. H. (1994). SMARTS and SMARTER: Improved simple methods for multiattribute utility measurement. Organizational Behavior and Human Decision Processes, 60(3), 306-325.
- Ezell, B., Lynch, C. J., & Hester, P. T. (2021). Methods for Weighting Decisions to Assist Modelers and Decision Analysts: A Review of Ratio Assignment and Approximate Techniques. Applied Sciences, 11(21), 10397.
- Gupta, S., Mathew, M., Gupta, S., & Dawar, V. (2020). Benchmarking the private sector banks in Índia using MCDM approach. Journal of Public Affairs, 21, e2409.
- Hsu, L. C. (2014). A hybrid multiple criteria decision-making model for investment decision making. Journal of Business Economics and Management, 15(3), 509-529.
- Jahanshahloo, G. R., Khodabakhshi, M., Lotfi, F. H., & Goudarzi, M. R. M. (2011). A cross-efficiency model based on super-efficiency for ranking units through the TOPSIS approach and its extension to the interval case. Mathematical and Computer Modelling, 53(9-10), 1946-1955.
- Jahanshahloo, G. R., Lotfi, F. H., & Izadikhah, M. (2006). An algorithmic method to extend TOPSIS for decision-making problems with interval data. Applied Mathematics and Computation, 175(2), 1375-1384.
- Krivka, A. (2014). Complex evaluation of the economic crisis impact on Lithuanian industries. Journal of Business Economics and Management , 15(2), 299-315.
- Marion, J. C. (2019). Análise das demonstrações contábeis. (8th ed.). Atlas.
- Masri, H., Pérez-Gladish, B., & Zopounidis, C. (2018). Financial Decision Aid Using Multiple Criteria: Recent Models and Applications. Springer.
- Mathew, M. & Thomas, J. (2019). Interval valued multi criteria decision making methods for the selection of flexible manufacturing system. International Journal of Data and Network Science, 3(4), 349-358.
- Medeiros, M. & Ferreira, L. (2018). Development of a purchasing portfolio model: An empirical study in a Brazilian hospital. Production Planning & Control, 29(7), 571-585.
- Mendonça, D. J., Souza, J. A., Benedicto, G. C., Carvalho, F. M., & Silva, S. N. A. (2017). Relação entre eficiência econômico-financeira e lucratividade em instituições bancárias brasileiras. Revista de Finanças e Contabilidade da Unimep, 4(1), 20-37.
- Mendonça, D. J., Souza, J. A., Carvalho, F. M., & Benedicto, G. C. (2018). Relação entre a eficiência na gestão de custos mensurada pelo método de análise da fronteira estocástica (SFA) e a rentabilidade das instituições financeiras no Brasil. Revista Capital Científico, 16(3), 5-21.
- Mussoi, F. L. R. & Teive, R. C. G. (2021). An integrated multicriteria decision‐making approach for distribution system expansion planning. International Journal of Intelligent Systems, 36(9), 4962-4989.
- Mustajoki, J., Hamalainen, R. P., & Lindstedt, M. R. K. (2006). Using intervals for global sensitivity and worst-case analyses in multiattribute value trees. European Journal of Operational Research, 174(1), 278-292.
- Mustajoki, J., Hamalainen, R. P., & Salo, A. (2005). Decision support by SMART / SWING: incorporating imprecision in the SMART e SWING methods. Decision Sciences, 36(2), 317-339.
- Németh, B., Molnár, A., Bozóki, S., Wijaya, K., Inotai, A., Campbell, J. D., & Kaló, Z. (2019). Comparison of weighting methods used in multicriteria decision analysis frameworks in healthcare with focus on low- and middle-income countries. Journal of Comparative Effectiveness Research, 8(4), 195-204.
- Nguyen, P. H., Tsai, J. F., Kumar G, V. A., & Hu, Y. C. (2020). Stock investment of agriculture companies in the Vietnam stock exchange market: An AHP integrated with GRA-TOPSIS-MOORA approaches. Journal of Asian Finance, Economics and Business, 7(7), 113-121.
- Niederauer, C. B., Vendruscolo, M. I., & Sallaberry, J. D. (2018). Análise das demonstrações contábeis : um estudo da emissão de ações no Banrisul S.A. Revista de Contabilidade da UFBA, 12(3), 86-110.
- Oliveira, J. G., Pinheiro, J. L., Pinheiro, L. E. T., & Machado, E. A. Jr. (2021). Poder explicativo dos múltiplos fundamentalistas na análise de bancos brasileiros. Revista Sociedade, Contabilidade e Gestão, 16(1), 147-170.
- Onder, E., & Hepsen, A. (2013). Combining time series analysis and multi criteria decision making techniques for forecasting financial performance of banks in Turkey. International Journal of Latest Trends in Finance & Economic Sciences, 3(3), 530-555.
- Pinheiro, B. G., Vasconcelos, A. C., De Luca, M. M. M., & Crisóstomo, V. M. (2017). Estrutura de capital e governança corporativa nas empresas listadas na BM&FBovespa. Revista de Educação e Pesquisa em Contabilidade, 11(4), 451-466.
- Sama, H. R., Kosuri, S. V. K., & Kalvakolanu, S. (2020). Evaluating and ranking the Indian private sector banks - a multi-criteria decision-making approach. Journal of Public Affairs , 22, e2419.
- Scala, N. M., Rajgopal, J., Vargas, L. G., & Needy, K. L. (2016). Group Decision Making with Dispersion in the Analytic Hierarchy Process. Group Decision and Negotiation, 25, 355-372.
- Shaverdi, M., Ramezani, I., Tahmasebi, R., & Rostamy, A. A. A. (2016). Combining fuzzy AHP and fuzzy TOPSIS with financial ratios to design a novel performance evaluation model. International Journal of Fuzzy Systems, 18(2), 248-262.
- Sun, H. (2018). Ecological and financial evaluation of China’s new energy and environment industry listed companies. Ekoloji, 27(106), 429-439.
- Tavares, V. B. & Penedo, A. S. T. (2018). Níveis de governança corporativa da B3: interesse e desempenho das empresas - uma análise por meio de redes neurais artificiais. Revista Contabilidade, Gestão e Governança, 21(1), 40-62.
- Vavrek, R., Becica, J., Papcunová, V., Gundová, P., & Mitríková, J. (2021). Number of financial indicators as a factor of multi-criteria analysis via the TOPSIS technique: A municipal case study. Algorithms, 14(2), 64-79.
- Zopounidis, C., Galariotis, E., Doumpos, M., Sarri, S., & Andriosopoulos, K. (2015). Multiple criteria decision aiding for finance: An updated bibliographic survey. European Journal of Operational Research , 247(2), 339-348.
Data will be available upon reasonable request

 Source: