 Analysis of genetic diversity in soybean based on agronomic traits and microsatellite markers
ABSTRACT
The primary method of soybean breeding is artificial hybridization. Therefore, genitors must be carefully selected, especially given the crop’s restricted genetic base. This study aimed to quantify genetic diversity across soybean genotypes using agronomic traits and microsatellite markers and to identify promising parent combinations. We evaluated 26 soybean genotypes in the greenhouse and characterized 11 agronomic traits. Polymorphism for five microsatellite markers was assessed on a 2% agarose gel. Univariate and multivariate analyses were used to detect genetic variability and determine genetic diversity. All agronomic traits, except plant height at maturity, showed genetic variability. The genotypic coefficients of determination ranged from 34.41% to 69.81%. The genetic dissimilarity for agronomic traits ranged from 2.49 to 42.77, enabling the formation of five, eight, and seven groups using the UPGMA, farthest neighbor, and Tocher methods, respectively. The dissimilarity obtained by the microsatellites ranged from 0.11 to 0.93, allowing the genotypes to be divided into seven, eight, and four groups, respectively, using the UPGMA, farthest neighbor, and Tocher methods. The vegetative and total cycles were the traits that contributed most to genetic diversity. The data analysis identified Emgopa 316 x NS 7200, Emgopa 316 x UFUS (7415 x MG / BR 46 Conquista), TMG 801 x NS 7200, and TMG 801 x BRSGO Luziânia hybrids as promising for early cycle, grain yield, and disease resistance.
Index terms:
Dissimilarity; Glycine max; molecular marker; phenotypic traits; SSR.
RESUMO
O principal método de melhoramento de soja é a hibridação artificial. Logo, a escolha de genitores deve ser criteriosa, especialmente por ser uma cultura de base genética estreita. O trabalho objetivou determinar a diversidade genética entre genótipos de soja por meio de caracteres agronômicos e marcadores microssatélites e indicar combinações de genitores promissoras. Em casa de vegetação, foram avaliados 26 genótipos de soja, nos quais foram caracterizados onze caracteres agronômicos. O polimorfismo para cinco marcadores microssatélites foi avaliado em gel de agarose 2%. Realizaram-se análises uni e multivariadas para detecção da variabilidade genética e determinação da diversidade genética. Constatou-se existência de variabilidade genética para todos os caracteres agronômicos, exceto para altura da planta na maturidade. O coeficiente de determinação genotípico variou de 34,41% a 69,81%. A dissimilaridade genética oscilou de 2,49 a 42,77, possibilitando a formação de cinco, oito e sete grupos pelos métodos UPGMA, vizinho mais distante e Tocher, respectivamente. A dissimilaridade obtida pelos microssatélites variou de 0,11 a 0,93, o que permitiu separar os genótipos em sete, oito e quatro grupos, respectivamente, para os métodos UPGMA, vizinho mais distante e Tocher. Os ciclos vegetativo e total foram os caracteres que mais contribuíram para diversidade genética. A análise dos dados permitiu indicar as hibridações Emgopa 316 x NS 7200, Emgopa 316 x UFUS (7415 x MG / BR 46 Conquista), TMG 801 x NS 7200 e TMG 801 x BRSGO Luziânia, visando precocidade, produção de grãos e resistência a doenças.
Termos para indexação:
Glycine max; dissimilaridade; caracteres fenotípicos; marcador molecular; SSR.
Introduction
Soybean (Glycine max L. Merrill) is one of the world’s most significant legume crops, accounting for about two-thirds of protein concentrate in cattle feed and 25% of edible oil (Mishra et al., 2024). It is one of Brazil’s most important commodities, with approximately 148 million tons produced in the 2023/24 season and an expected increase in the following harvest (Companhia Nacional de Abastecimento - Conab, 2024).
Soybean breeding in Brazil has been successful, with clear genetic gains and increased grain yield (Campos et al., 2023). In these programs, genitors are artificially hybridized to create segregating populations with suitable genetic variability for selection. Thus, understanding germplasm’s genetic diversity is essential for successful breeding (Shaibu et al., 2022).
One of the most critical steps in hybridization is selecting genitors, particularly for Brazilian soybeans, a crop with a limited genetic base (Wysmierski & Vello, 2013) and germplasm derived from a few ancestors (Santos et al., 2016). However, research indicates the presence of a large genetic base suitable for soybean breeding in Brazil (Costa et al., 2022). In this context, soybean genetic diversity studies are significant because they enable the identification and selection of divergent genitors, which, when crossed, produce hybrid combinations with increased variability in the segregating generations.
Soybean genetic diversity was examined using multivariate analyses that included morpho-agronomic traits, kinship coefficients, and molecular markers. Morpho-agronomic traits that can be assessed throughout soybean development in different phenological periods have been widely used in genetic divergence analyses (Naik et al., 2016; Oliveira et al., 2017; Sousa et al., 2020), as they are inexpensive compared to molecular markers, and the breeding institutions do not make the genealogies of cultivars available.
On the other hand, molecular markers allow for the characterization of germplasm based on DNA information, a technique that may be utilized at any time and is not stage-dependent (Kachare et al., 2020). Microsatellite markers in soybeans have proven effective and efficient for detecting genetic variability between cultivars (Soares, Sediyama, & Matsuo, 2020). Glasenapp et al. (2015) found substantial genetic variability in soybean germplasm using microsatellite marker polymorphisms. Therefore, determining genetic divergence and assessing the germplasm in a breeding program provides relevant information for developing breeding strategies.
The simultaneous use of morpho-agronomic traits and molecular markers reveals genetic diversity in a more comprehensive and complementary manner. It is an efficient strategy for selecting genetically dissimilar genotypes (Kachare et al., 2020; Ullah et al., 2021). This phenotypic and molecular data is analyzed using multivariate approaches to draw inferences about genetic diversity. Multivariate approaches commonly employed in investigations of soybean genetic diversity include the Tocher optimization method, the hierarchical UPGMA (Unweighted Pair Group Method with Arithmetic Mean), and the farthest neighbor methods (Cantelli et al., 2016). Principal component analysis is another tool for analyzing genotypes using two- or three-dimensional figures (Cruz, Ferreira, & Pessoni, 2020).
Assessing and determining the genetic diversity of germplasm is critical for more assertively targeting hybrid combinations with higher genetic variability (Soares et al., 2023). Given this knowledge, our study aimed to determine genetic diversity across soybean genotypes using agronomic traits and microsatellite markers and identify promising hybrid combinations for the breeding program.
Material and Methods
The experiment was conducted at the Federal University of Uberlândia’s (UFU) greenhouse at Capim Branco Farm (18º52’S; 48º20’W and 805m altitude) in the municipality of Uberlândia, Minas Gerais during the 2022/2023 harvest. The evaluation included 23 soybean cultivars and three progenies. The following genotypes were selected based on desirable agronomic traits and sources of resistance to soybean disease-causing phytopathogens: UFUS 6901 (identified as treatment 1), BRSGO 8061 (2), EMGOPA 305 (3), UFUS 7415 (4), EMGOPA 309 (5), EMGOPA 316 (6), EMGOPA 306 (7), MSoy 7110 (8), BRSMG 68 Vencedora (9), BRSGO Ipameri (10), NS 7670 (11), BRSGO 8360 (12), MG/BR 46 Conquista (13), TMG 801 (14), UFUS (Guará x MG / BR 46 Conquista) (15), BRSGO Chapadões (16), UFUS (7415 x MG / BR 46 Conquista) (17), NS 7200 (18), BRSGO Luziânia (19), UFUS (Guará x UFUS 7415) (20), BRS 511 (21), UFUS Guará (22), BRS 8381 (23), MSoy 6101 (24), UFUS 7910 (25), and TMG 803 (26).
We employed a randomized complete block design with four replications. Each experimental unit consisted of a 3.0 dm3 pot filled with substrate and was used to grow two plants. The substrate consisted of soil, sand, and manure in a 3:1:1 ratio. Sowing fertilizer was applied with the equivalent of 400 kg ha-1 NPK of the 4-30-16 formulation, which equates to 16 kg of N (source: urea), 120 kg of P2O5 (source: simple superphosphate), and 64 kg K2O (source: KCl) per hectare.
Manual sowing took place in October 2022 at a depth of 2.5 cm, with five seeds sown in each pot. Subsequently, thinning was carried out at the V1 stage (Fehr & Caviness, 1977), with two plants per pot. Weeds were manually removed, and the pots received regular watering. The fungicide trifloxystrobin 125 g L-1 a.i. + propiconazole 125 g L-1 a.i. was applied with a backpack pump at a dose of 0.5 L ha-1 of the commercial product, and the insecticide thiamethoxam 141 g L-1 a.i. + lambda-cyhalothrin 106 g L-1 a.i. at a dose of 0.15 L ha-1 of the commercial product, according to the manufacturer’s recommendations.
Each plant was examined for the following agronomic traits:
a) Plant height at flowering (PHF) and maturity (PHM): the distance in centimeters from the soil surface to the end of the main stem was measured while the plants were in the R1 and R8 reproductive stages.
b) Number of nodes on the main stem at flowering (NNF) and maturity (NNM): the number of nodes on the main stem was counted when the plants were in the R1 and R8 reproductive stages.
c) Number of days to flowering (NDF) and to maturity (NDM): the number of days from emergence to flowering, when approximately 50% of the plants in the useful plot had at least one flower open (R1) and 95% of the pods in the plot’s useful area were mature (R8).
d) Number of pods with one grain (NP1), two grains (NP2), and three grains (NP3): following harvest, the number of pods with one, two, and three grains were counted.
e) Total number of pods per plant (TNP): calculated by adding the number of pods containing one, two, or three grains.
f) Grain production per plant (PROD): calculated by measuring the grain mass of each plant.
Molecular analyses were carried out at the UFU Molecular Genetics Laboratory. Genomic DNA was isolated from 200 mg of fresh leaf tissue collected from the 26 soybean genotypes investigated. The leaf tissue was pulverized in liquid nitrogen, and the extraction process was based on the methodology proposed by Doyle and Doyle (1990), with some modifications. The sample was treated with 900 µL of preheated (65ºC) extraction buffer (2% CTAB, 1.4 M NaCl, 0.2% 2-β-mercaptoethanol, 20 mM EDTA, 100 mM Tris-HCl pH 8, and 1% PVP 40). The extracted DNA was electrophoresed in 0.8% agarose gel (100 V) for 2.5 hours, stained with ethidium bromide (0,5 µg/mL) to confirm the integrity and quality of the bands, and visualized in a UV gel transilluminator. DNA was quantified using a NanoDrop® spectrophotometer. The yield was determined by measuring absorbance at 260, 280, and 230 nm. The purity of the DNA was determined by the absorbance ratios 260/280 and 260/230.
The amplification of the target sequence was optimized by standardizing the annealing temperature for each SSR marker pair and adjusting the DNA concentration to 10 ng/µL. The amplification reactions were carried out in a final volume of 15μL, containing Tris-HCL 10mM (pH 8,3), KCl 50 mM, MgCl2 20mM, Triton X100 0,1%, 100μM of each deoxynucleotide, 0,6μM of each primer, one unit of Taq polymerase, and 20ng of DNA. The thermal cycler was configured to start at 94ºC for 4 minutes, followed by 30 cycles of 94ºC for 1 minute, 52ºC (standardized temperature for the primer pairs) for 1 minute, 72ºC for 2 minutes, and the final step of 72ºC for 7 minutes. The amplification products were separated by electrophoresis on 2.0% agarose gels stained with ethidium bromide in 0.5X TBE buffer. Following electrophoresis, the gels were photographed under UV light.
The PCR reaction was conducted using the primers Satt 191, Satt 217, Satt 233, Satt 269, and Satt 454, which were previously selected based on their polymorphism pattern. The primer sequences are available at https://legacy.soybase.org/search/ (Grant et al., 2010). We analyzed the gel banding pattern and created a codominant data sheet for the 26 genotypes, which was then used to calculate the weighted similarity index. The genetic dissimilarity was obtained by the complement (Cruz, 2008).
The quantitative data underwent analysis of variance using the following model (Equation 1):
Yij is the value of each trait for the i-th genotype in the j-th block, μ is the overall average, Gi is the effect of the i-th genotype, Bj is the effect of the j-th block, and Εij is the random error.
The coefficient of genotypic determination (H²) was estimated using the methodology of Cruz, Regazzi and Carneiro (2014). The polymorphic information content (PIC) for each SSR marker was calculated following Botstein et al. (1980).
When the F-test was significant (p≤0.05), the Scott-Knott test was performed at the 5% probability level to categorize the genotypes. We used the Generalized Mahalanobis Distance (D²ii’) to quantify genetic dissimilarity among genotype pairs (Cruz, Regazzi, & Carneiro, 2014). The relative contribution of traits to the genetic dissimilarity of 26 soybean genotypes was also examined using the method proposed by Singh (1981).
Multivariate analyses were performed on the dissimilarity matrices acquired by agronomic traits and microsatellite markers to generate dendrograms using the UPGMA and farthest neighbor methods. Groupings were created using the Tocher method with identical matrices, and 5,000 simulations were applied to ascertain the correlation between the matrices (Cruz, 2008). We used the Genes program (Cruz, 2016) and RStudio software to perform the analyses.
Results and Discussion
The F test revealed significant effects at the 5% level for all agronomic traits, except plant height at flowering (PHF) (Table 1). The significance indicates genetic variability among the soybean genotypes evaluated, the possibility of determining genetic dissimilarity between them, and the selection of superior genotypes.
The coefficient of variation (CV) varied from 3.08 % (number of days to maturity) to 58.82 % (number of pods with three grains). The highest CV estimates were obtained for the production components, as they are quantitative and highly influenced by the environment. This is comparable with previous soybean research, which found similarly high CV values (Gastl Filho et al., 2022; Martin et al., 2022).
When the effects of genotypes are constant, the heritability estimate is known as the coefficient of genotypic determination (H2). It is deemed high when the value exceeds 70% (Cruz, Regazzi, & Carneiro, 2014). In this study, H2 values varied between 34.4% for plant height at maturity and 69.8% for number of nodes on the main stem at flowering (Table 1). The estimates were generally of low to medium magnitude, indicating a contribution from genetic effects, with a prevalence of environmental effects influencing phenotypic trait expression.
The traits of each parent and the genetic divergence between them must guide the establishment of hybrid combinations. Developing early-cycle cultivars is one of the primary demands in soybean breeding (Daronch et al., 2019). Our study identified fourteen cultivars with shorter cycles ranging from 100 to 108 days (Table 2).
Plant height is a vital trait in soybean breeding, with an optimal genotype measuring between 60 and 110 cm (Nepomuceno, Farias, & Neumaier, 2021). All the investigated genotypes had plant heights within acceptable limits, with averages ranging from 58 to 100 cm (Table 2).
Developing cultivars with high yield potential is essential in the soybean breeding program. An optimal genitor must have a high number of branched nodes, pods with 2 or 3 grains, and total pods (Machado et al., 2017), as these are traits associated with yield. The trait for the number of pods with 3 grains had the highest effect on yield increase, making it beneficial for indirect selection of highly productive soybean genotypes (Machado et al., 2017). As shown in Table 2, these seven genotypes in particular exhibited concomitant higher number of 3-grain pods and a high grain yield per plant: EMGOPA 305 (3), EMGOPA 309 (5), EMGOPA 306 (7), NS 7670 (11), MG/BR 46 Conquista (13), BRSGO Chapadões (16), and UFUS (7415 x MG / BR 46 Conquista) (17) (Table 2).
Dissimilarity measures were estimated using the generalized Mahalanobis distance (D2) to study genetic diversity, with higher D2 values indicating increased genotype divergence. The estimates between genotype pairs varied from 2.45 (BRSGO 8061 and BRSGO Ipameri) to 42.77 (TMG 801 and UFUS (Guará x UFUS 7415)) (Table 3), suggesting variation among the genotypes studied. The TMG 801 cultivar showed the highest divergence in proportion to the other genotypes, around 60%, and a high grain yield per plant (Table 2). It is thus a potential genitor for artificial hybridization.
The shortest and longest Mahalanobis distances for eleven agronomic traits evaluated in 26 soybean genotypes during the 2022/2023 harvest.
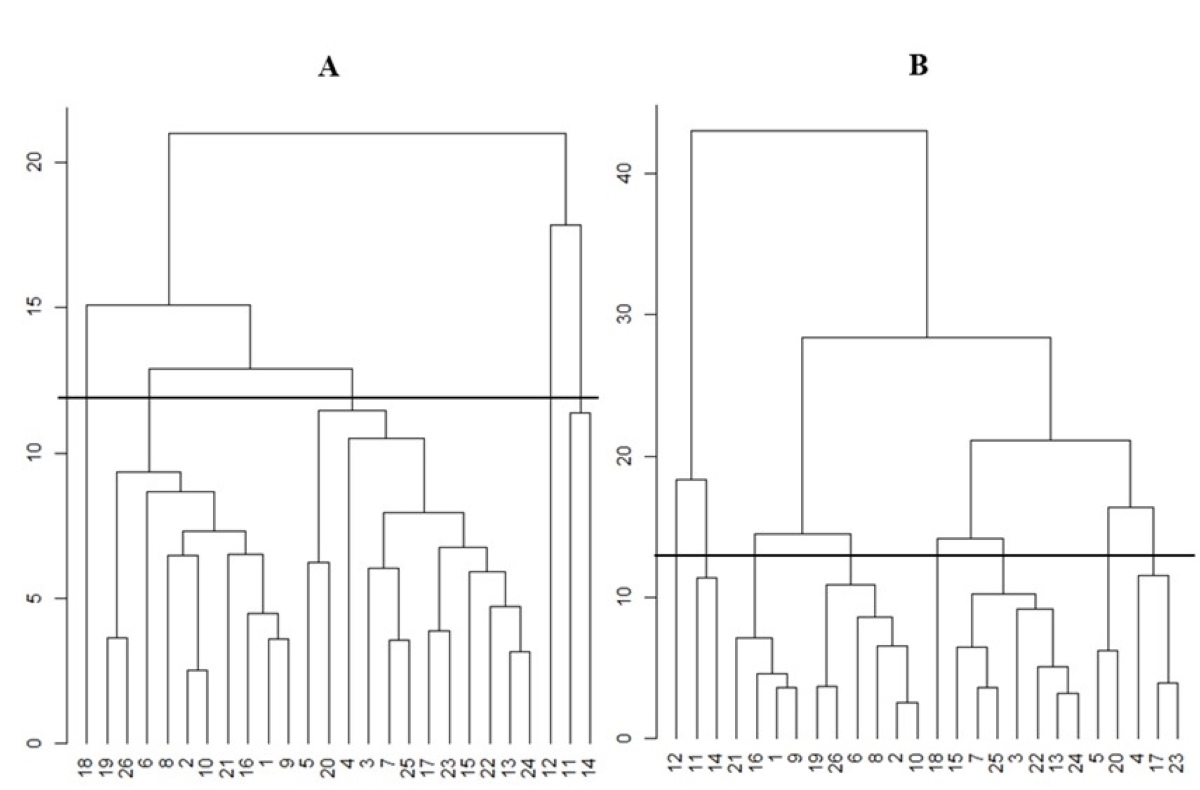
Figure 1 depicts the dendrograms generated by the UPGMA and farthest neighbor methods to account for genotype dissimilarity based on agronomic traits. The cohenetic correlation coefficient (CCC) results were identical (0.71**) and statistically significant at the 1% level using a t-test. This indicates a satisfactory fit between the graphical representation of the genetic distances between the genotypes and their original matrix, as the CCC must be equal to or greater than 0.70 (Cruz, Ferreira, & Pessoni, 2020).

Dendrograms depicting the genetic dissimilarity in 26 soybean genotypes derived from phenotypic data based on the generalized Mahalanobis matrix (D2). A) UPGMA method; B) Farthest neighbor method.
The cut-off for dissimilarity was approximately 13%, indicating a significant change (Figure 1). The UPGMA approach yielded five groups (Figure 1A), while the farthest neighbor method formed eight (Figure 1B).
The farthest neighbor method and UPGMA separated the genotypes into groups in similar ways. However, the farthest neighbor method provided a more diverse distribution for genotypes included in a single group by UPGMA. Although the two methodologies are hierarchical, they can collaborate to uncover genetic divergence between genotypes, justifying the simultaneous adoption of the methods.
The Tocher optimization method resulted in the formation of seven groups (Table 4). Cultivars 12 (BRSGO 8360) and 18 (NS 7200) were grouped separately in the three methods analyzed (UPGMA, farthest neighbor, and Tocher), indicating that they are more divergent genotypes than the others (Figure 1 and Table 4).
Optimization grouping of 26 soybean cultivars by the Tocher method, using the generalized Mahalanobis distance.
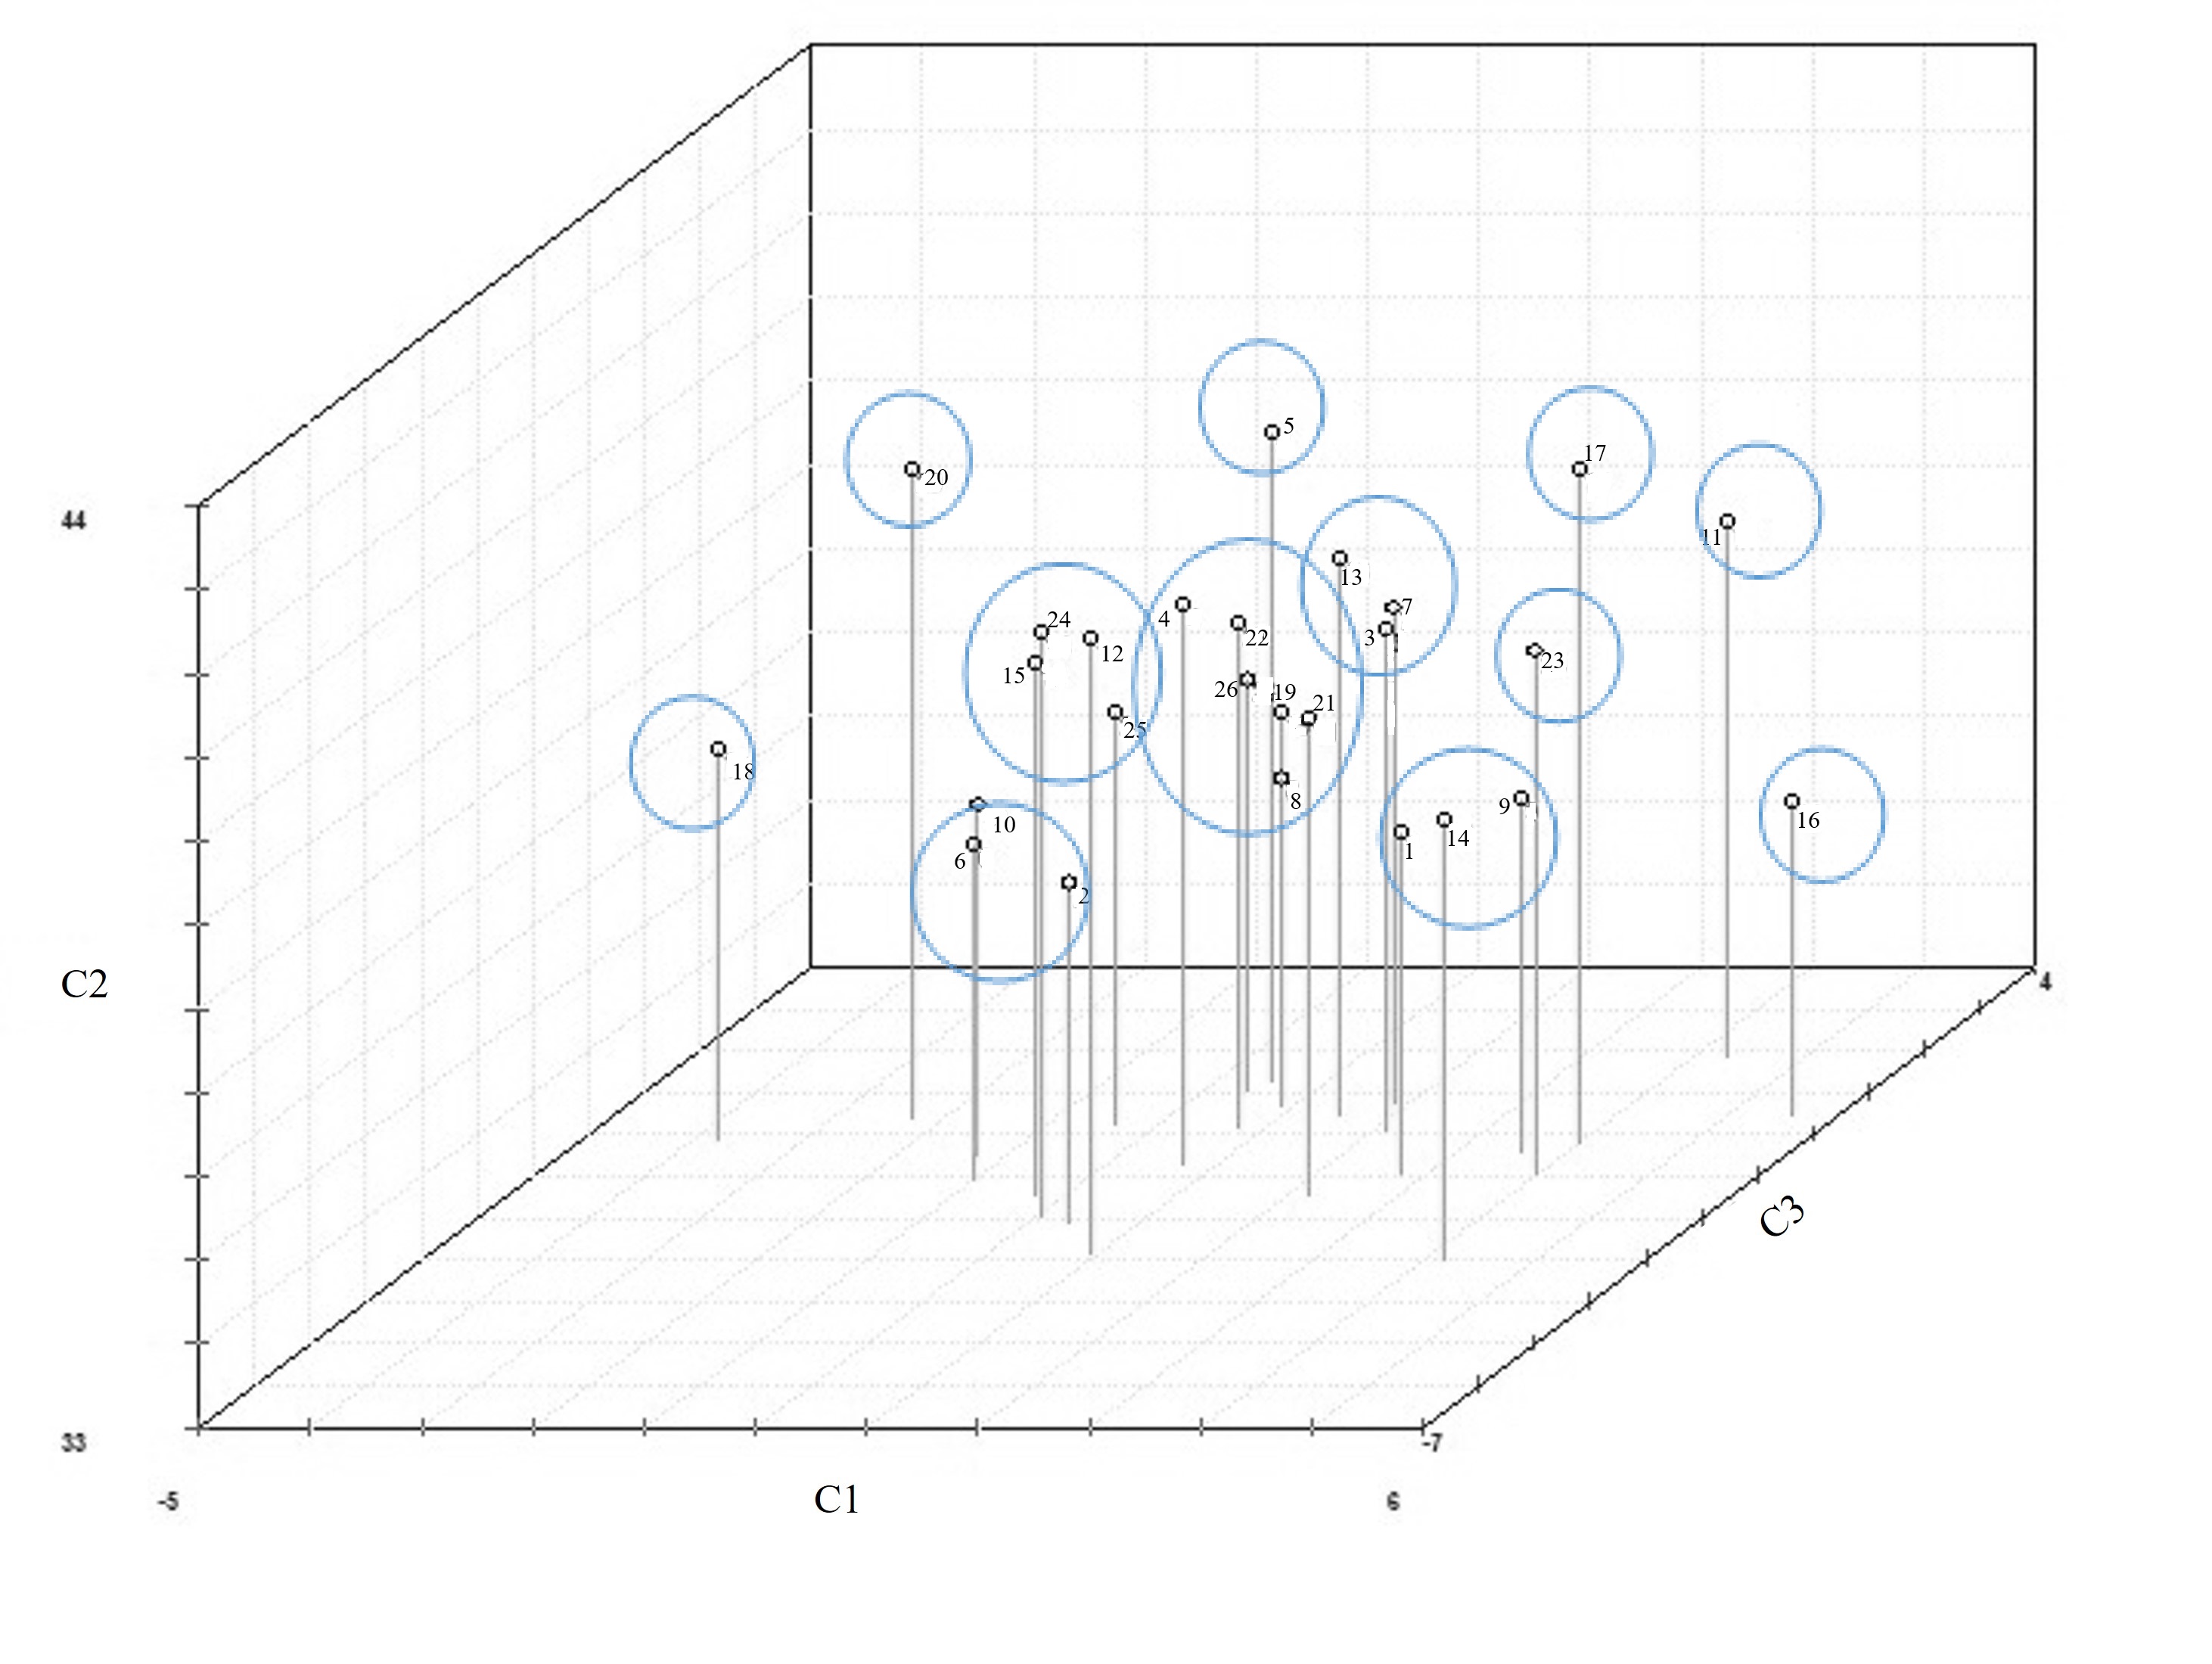
Principal component analysis was used to examine the genotype grouping pattern before deciding on the direction of the crosses, allowing the genotypes to be dispersed in a three-dimensional plane (Figure 2). The first three principal components accounted for 74.3% dissimilarity, close to the recommended 80% (Cruz, Ferreira, & Pessoni, 2020). Similar genotypes are those nearest each other, while genotypes further apart are more dissimilar. There was a wide dispersion of genotypes, resulting in 12 groupings. Seven of these were individual groups: genotypes 18 (NS 7200), 20 (UFUS (Guará x UFUS 7415)), 5 (EMGOPA 309), 17 (UFUS (7415x MG/BR 46 Conquista)), 23 (BRS 8381), and 16 (BRSGO Chapadões).
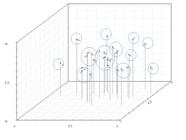
Graphical dispersion of the first three principal components obtained from the averages of 11 agronomic traits in 26 soybean genotypes.
When the hierarchical approaches and the three-dimensional graphic dispersion acquired by the principal components were combined, there was agreement in establishing the unitary group formed by the NS 7200 cultivar, emphasizing the significance of this genotype in soybean crosses. This cultivar possesses an early cycle, resistance to lodging and root rot induced by Phytophthora sojae races 1 and 7, and tolerance to harvesting in the rain (Nidera, 2023).
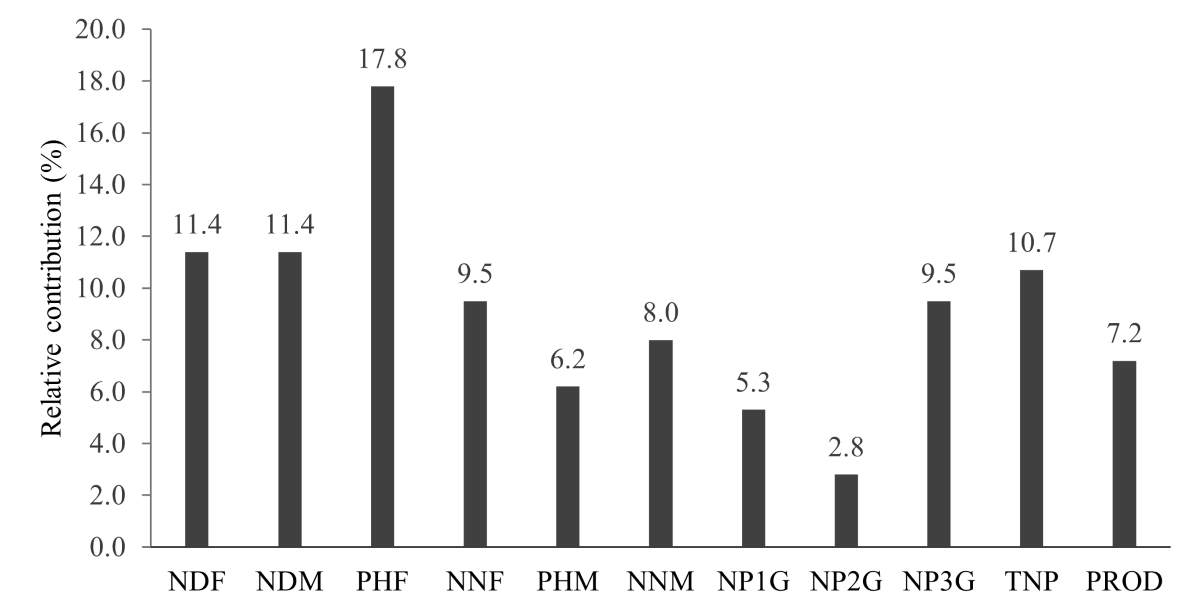
The traits that contributed the most to genetic divergence were plant height at flowering (PHF) and cycle, as measured by the number of days to flowering (NDF, vegetative cycle) and maturity (NDM, total cycle) (Figure 3). Due to their higher genetic diversity, these traits are projected to yield more decisive selection advantages, as evidenced by their combined contribution of more than 40% to genetic divergence (Soares et al., 2023). Sousa et al. (2020) evaluated 35 soybean genotypes for seven traits. They observed that the number of days to maturity was the most significant trait, accounting for 29.44% of the divergence, followed by plant height at maturity, total number of pods, and number of days to flowering.

The relative contribution of agronomic traits to genetic divergence using Singh’s method (1981). NDF: number of days to flowering; NDM: number of days to maturity; PHF: plant height at flowering (cm); PHM: plant height at maturity (cm); NNF: number of nodes on the main stem at flowering; NNM: number of nodes on the main stem at maturity; NP1G: number of pods with 1 grain; NP2G: number of pods with 2 grains; NP3G: number of pods with 3 grains; TNP: total number of pods; and PROD: grain production per plant (g plant-1).
The traits having the least significance in expressing genetic divergence were the number of pods with 1 (NP1G) and 2 grains (NP2G). The grain production per plant, which is likewise directly related to yield, contributed just 7.2% to genetic divergence. This finding is consistent with other authors evaluating soybean genotypes in Brazil (Oliveira et al., 2017; Sousa et al., 2020; Soares et al., 2023).
The literature contains variable results about the contribution of traits to genetic divergence. Sousa et al. (2015) discovered that plant height at maturity, number of pods with one grain, and grain yield were the variables that most contributed to genetic diversity among the soybean crosses studied. In contrast, Soares et al. (2023) observed that the weight of 100 grains, the number of nodes per plant, and the number of pods per plant contributed more. Thus, we conclude that the findings are specific to the genotypes and environmental conditions under consideration. Exploring the diversity and contribution of traits is highly relevant in genetic breeding because it allows for the guidance of new crossings, which can result in significant increases in selection within populations by leveraging greater genetic variability (Soares et al., 2023). This implies that more selection gains can be expected when exploring these traits, owing to a richer and more diversified genetic variability.
We analyzed the molecular data and observed that the markers amplified three or two alleles (Table 5). In their study, Surbhi et al. (2021) found a similar amplification pattern with 47 soybean genotypes and 12 SSR markers, identifying 75% of the markers as having two or three alleles. Sousa et al. (2020) evaluated the genetic divergence of 35 soybean genotypes using nine SSR markers, including Satt 191 and Satt 233, and discovered that 89% possessed two or three alleles.
Number of alleles, allele frequency, polymorphism information content (PIC), and Shannon-Weaver index (I) for five SSR primers assessing 26 soybean genotypes.
Our study’s average PIC value (0.3056, Table 5) was lower than those published previously (Gwinner et al., 2017; Rani et al., 2023). These studies reaffirm that markers with high PIC values can be utilized to distinguish soybean accessions. We observed that the Satt 269 had the highest PIC (0.5724) and Shannon-Weaver index (1.2351). Therefore, it was the most informative primer for differentiating genotypes and the most useful for molecular genotyping.
The average genetic diversity index (I) was 0.7492 (Table 5), which is similar to the results reported by Rani et al. (2023). The low genetic diversity observed among the soybean genotypes analyzed in this and other studies is noteworthy. This is most likely due to the high selection pressure applied over the years. Additionally, cultivated soybean has diverged significantly from its wild genotype (G. soja), which inherently exhibits a high level of genetic diversity (Gwinner et al., 2017).
The dissimilarities between genotype pairings ranged from 0.60 to 0.79, demonstrating a high level of genetic diversity using the five microsatellite markers. Glasenapp et al. (2015) proved the feasibility of examining genetic dissimilarity with fewer markers in their study on soybean genetic diversity, which included three genotypes similar to those evaluated in this study. Using the weighted index based on microsatellite markers, the lowest dissimilarity value obtained was 0.11 between genotypes 1 (UFUS 6901) and 6 (EMGOPA 316), followed by the pair of genotypes 1 (UFUS 6901) and 18 (NS 7200), which had a dissimilarity of 0.18. The cultivars EMGOPA 306 and MSoy 7110 showed maximum dissimilarity at 0.93. The dissimilarity estimations between genotypes 7 (EMGOPA 306) and 9 (BRSMG 68 Vencedora), 8 (MSoy 7110) and 9 (BRSMG 68 Vencedora), 14 (TMG 801) and 16 (BRSGO Chapadões), and 22 (UFUS Guará) and 24 (MSoy 6101) ranged from 0.82 to 0.89. Glasenapp et al. (2015) also identified the TMG 801 cultivar among the most dissimilar pairs of genotypes in their study.
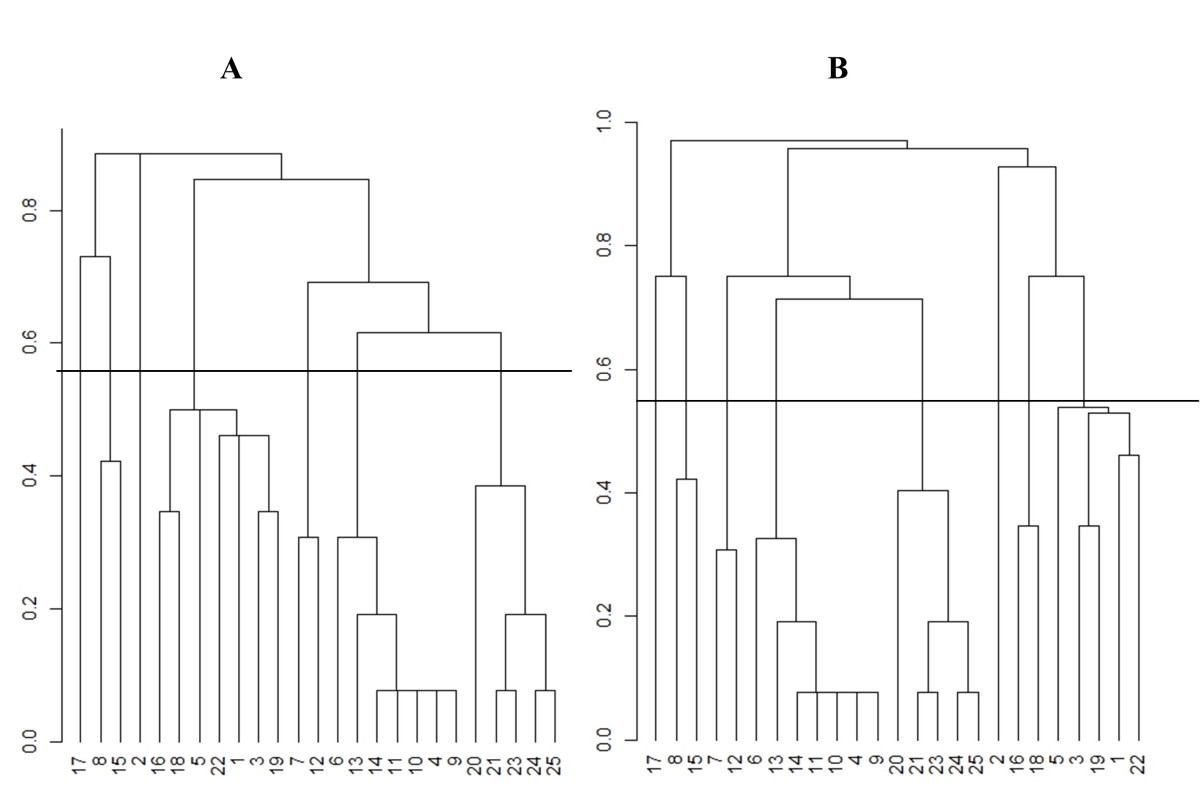
Figure 4 depicts the dendrograms generated from the dissimilarity obtained by the markers, whose coefficients of co-phenetic correlation were higher than 0.95** and significant at 1% by the Mantel test. The cut-off threshold was set at 58%, and seven and eight groups were formed using the UPGMA and farthest neighbor methods, respectively. Two unit groups, consisting of genotypes 2 (BRSGO 8061) and 17 UFUS (7415 x MG/BR 46 Conquista), were formed in both hierarchical methods. There was a pattern of partial similarity between the UPGMA (Figure 4A) and farthest neighbor (Figure 4B) methods. However, the farthest neighbor method created an additional group, which included genotypes 16 (BRSGO Chapadões) and 18 (NS 7200).
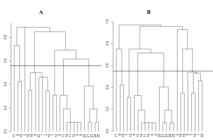
Representative dendrograms of the dissimilarities obtained by complementing the weighted index in 26 soybean genotypes acquired from molecular data. A) UPGMA method; B) Farthest neighbor method.
Table 6 shows the five groups formed by the Tocher optimization method. Group I included approximately 54% of the genotypes studied, while Group IV contained only one genotype (BRSGO 8061). This grouping also revealed that two genotypes from the same parent (MG/BR Conquista) were placed in the same group (Group III). Ferreira Júnior et al. (2015) evaluated advanced strains from biparental, quadruple, and octuple crosses and discovered similar results, with related genotypes clustering in the same group.
Optimization grouping of 26 soybean genotypes generated by the Tocher method, utilizing the dissimilarity obtained by the complement of the weighted index.
The dissimilarity matrices derived from phenotypic and molecular data revealed distinct clustering patterns. This was further supported by the null correlation between the Mahalanobis matrices and the dissimilarity matrix generated by the complement of the weighted index. Other studies have revealed limited consistency across soybean genotype groupings based on phenotypic and molecular data (Sousa et al., 2020; Ullah et al., 2021). The lack of correlation between phenotypic and molecular data is due to the variation displayed by molecular markers, which is non-adaptive and thus not subject to selection. In contrast, morpho-agronomic traits are subject to natural and artificial selection and are heavily influenced by environmental factors (Singh, & Nodari Gepts, 1991; Agre et al., 2019).
The simultaneous use of phenotypic traits and molecular markers reveals genetic diversity in a broader and more complementary manner, making it an effective strategy for selecting genetically divergent genotypes (Kachare et al., 2020; Ullah et al., 2021).
In light of all the results, the Emgopa 316 genotype is the most notable. This cultivar possesses an essential and unique feature: resistance to white mold, a disease caused by the fungus Sclerotinia sclerotiorum (Garcia et al., 2015; Polloni-Barros et al., 2022). The TMG 801 genotype is the most divergent, resistant to Asian rust, and has an early cycle, all target traits in soybean breeding programs (Daronch et al., 2019). Early-cycle cultivars reduce the plant’s exposure to phytopathogens, and using disease-resistant genotypes is one of the most effective long-term strategies (Juliatti & Zambolim, 2021). The NS 7200 cultivar exhibits super-precocity and high yield (Nidera, 2023), whereas BRSGO Luziânia is resistant to the gall nematode Meloidogyne javanica (Empresa Brasileira de Pesquisa Agropecuária -Embrapa, 2023).
Thus, the Emgopa 316 x NS 7200 and Emgopa 316 x UFUS (7415 x MG / BR 46 Conquista) hybrids are promising. This last cross supports producing a segregating population with a higher likelihood of individuals being resistant to white mold, as the MG/BR 46 Conquista was also identified as having moderate resistance to the fungus S. sclerotiorum (Garcia et al., 2015). Crosses between the TMG 801 cultivar and the NS 7200 and BRSGO Luziânia cultivars are also promising.
Conclusions
Based on morphological and molecular features, genetic diversity was detected among 26 soybean genotypes, which were then grouped and identified as potential genitors. Plant height at flowering and the number of days to flowering and maturity were the factors that had the most significant impact on genetic divergence. Emgopa 316 x NS 7200, Emgopa 316 x UFUS (7415 x MG/BR 46 Conquista), TMG 801 x NS 7200, and TMG 801 x BRSGO Luziânia are the recommended hybrid combinations.
Acknowledgment
The authors thank CAPES, CNPq, Fapemig and Instituto Federal Goiano Campus Urutaí for the financial support.
References
- Agre, P. et al. (2019). Phenotypic and molecular assessment of genetic structure and diversity in a panel of winged yam (Dioscorea alata) clones and cultivars. Scientific Reports, 9:e18221.
- Botstein, D. et al. (1980). Construction of a genetic linkage map in man using restriction fragment length polymorphism. American Journal of Human Genetics, 32:314-331.
- Campos, L. H. R. et al. (2023). Genetic progress of 18 years of a soybean breeding program for the Brazilian Central-West. Revista Ciência Agronômica, 54:e20217833.
- Cantelli, D. A. V. et al. (2016). Analysis of the genetic divergence of soybean lines through hierarchical and ocher optimization methods. Genetics and Molecular Research, 15(4):gmr.15048836.
- Companhia Nacional de Abastecimento - CONAB. (2024). Acompanhamento da safra brasileira de grãos: 1º levantamento da safra 2024/25. 12(1) Brasília, DF: Companhia Nacional de Abastecimento. 104p.
- Costa, W. G. et al. (2022). Genetic diversity and interaction between the maintainers of commercial soybean cultivars using self-organizing maps. Crop Science, 62(6):2233-2245.
- Cruz, C. D. (2008). Programa Genes: Diversidade genética Viçosa, Minas Gerais, Brasil: Editora UFV, 278p.
- Cruz, C. D. (2016). Genes software: Extended and integrated with the R, Matlab and Selegen. Acta Scientiarum. Agronomy, 38(4):547- 552.
- Cruz, C. D., Ferreira, F. M., & Pessoni, L. A. (2020). Biometria aplicada ao estudo da divergência genética 2. Ed. Viçosa, Minas Gerais, Brasil: Editora UFV, 626p.
- Cruz, C. D., Regazzi, A. J., & Carneiro, P. C. S. (2014). Modelos biométricos aplicados ao melhoramento genético 3. Ed. Vol. 2. Viçosa, Minas Gerais, Brasil: Editora UFV, 668p.
- Daronch, D. J. et al. (2019). Eficiência ambiental e divergência genética de genótipos de soja na região central do Tocantins. Revista Cultura Agronômica, 28(1):1-18.
- Doyle, J. J., & Doyle, J. L. (1990). Isolation of plant DNA from fresh tissue. Focus, 12:13-15.
-
Empresa Brasileira de Pesquisa Agropecuária - EMBRAPA. (2023). BRSGO Luziânia Available in: https://www.embrapa.br/documents/1355202/1529289/BRSGOLuziania_convencional.pdf/50ec2bcd-f6d5-4999-8db8-561d955579f4
» https://www.embrapa.br/documents/1355202/1529289/BRSGOLuziania_convencional.pdf/50ec2bcd-f6d5-4999-8db8-561d955579f4 - Fehr, W. R., & Caviness, C. E. (1977). Stages os soybean development (Special Report, 80) Ames, United States: Iowa State University, 12p.
- Ferreira Júnior, J. A. et al. (2015). Diversidade genética em linhagens avançadas de soja oriundas de cruzamentos biparentais, quádruplos e óctuplos. Revista Ciência Agronômica, 46(2):339-351.
- Garcia, R. A. et al. (2015). Métodos de inoculação de Sclerotinia sclerotiorum para triagem de cultivares de soja resistentes ao mofo-branco. Pesquisa Agropecuária Brasileira, 50(8):726-729.
- Gastl Filho, J. et al. (2022). Genetic parameters and selection strategies for soybean progenies aiming at precocity and grain productivity. Ciência e Agrotecnologia, 46:e004322.
- Glasenapp, J. S. et al. (2015). Diversidade de características agronômicas e moleculares em cultivares de soja com diferentes graus de resistência à Phakopsora pachyrhizi Bioscience Journal, 31(1):25-36.
- Grant, D. et al. (2010). SoyBase, the USDA-ARS soybean genetics and genomics database. Nucleic Acids Research, 38:D843-D846.
- Gwinner, R. et al. (2017). Genetic diversity in Brazilian soybean germplasm. Crop Breeding and Applied Biotechnology, 17:373-38.
- Juliatti, F. C., & Zambolim, L. (2021). Etiology, epidemiology and management of asian soybean rust (ASR) in Brazil and vulnerability of chemical control of specific without multisite fungicides. In A. K. Goyal. Cereal grains London, England: IntechOpen, v.1. (pp.1-31).
- Kachare, S. et al. (2020). Assessment of genetic diversity of soybean (Glycine max) genotypes using qualitative traits and microsatellite markers. Agricultural Research, 9(1):23-34.
- Machado, B. Q. V. et al. (2017). Phenotypic and genotypic correlations between soybean agronomic traits and path analysis. Genetics and Molecular Research, 16(2):gmr16029696.
- Martin, T. N. et al. (2022). Fontes alternativas de adubação na cultura da soja. Vivências, 18(37):245-261.
- Mishra, R. et al. (2024). Soybean (Glycine max L. Merrill): A multipurpose legume shaping our world. Plant Cell Biotechnology and Molecular Biology, 25(3):17-37.
- Naik, S. M. et al. (2016). Diversity in soybean (Glycine max) accessions based on morphological characterization and seed longevity characteristics. Progressive Research - An International Journal, 11(3):377-381.
-
Nidera. (2023). Nidera sementes. Catálogo de produtos 2023 Available in: https://www.niderasementes.com.br/portfolio/ns-7200-rr/
» https://www.niderasementes.com.br/portfolio/ns-7200-rr/ -
Nepomuceno, A. L., Farias, J. R. B., & Neumaier, N. (2021). Características da soja Embrapa - Empresa Brasileira de Pesquisa Agropecuária. Available in: https://www.embrapa.br/agencia-de-informacao-tecnologica/cultivos/soja/pre-producao/caracteristicas-da-especie-e-relacoes-com-o-ambiente/caracteristicas-da-soja
» https://www.embrapa.br/agencia-de-informacao-tecnologica/cultivos/soja/pre-producao/caracteristicas-da-especie-e-relacoes-com-o-ambiente/caracteristicas-da-soja - Oliveira, M. M. et al. (2017). Evaluation of genetic diversity among soybean (Glycine max) genotypes using univariate and multivariate analysis. Genetics and Molecular Research, 16(2):gmr16029661.
- Polloni-Barros, L. C. et al. (2022). Soybean genotypes selection with resistance to white mold and agronomic performance from moderately resistant parents. Scientia Agricola, 79(5):e20210050.
- Rani, R. et al. (2023). Genetic diversity and population structure analysis in cultivated soybean (Glycine max [L.] Merr.) using SSR and EST-SSR markers. PLoS One, 18(5):e0286099.
- SANTOS, J. V. M. et al. (2016). Evaluation of genetic variation among Brazilian soybean cultivars through genome resequencing. BMC Genomics, 17(1):110.
- Shaibu, A. S. et al. (2022). Assessment of the genetic structure and diversity of soybean (Glycine max L.) germplasm using diversity array technology and single nucleotide polymorphism markers. Plants, 11(1):68.
- Singh, D. (1981). The relative importance of characters affecting genetic divergence. Indian Journal of Genetics and Plant Breeding, 41(2):237-245.
- Singh, S. P., Nodari, R., & Gepts, P. (1991). Genetic diversity in cultivated common bean: I. allozymes.Crop Science, 31:19-23.
- Soares, M. M., Sediyama, T., & Matsuo, E. (2020). Efficiency and responsiveness of using phosphorus and molecular diversity among soybean cultivars. Agronomy Science and Biotechnology, 6:1-11.
- Soares, S. L. et al. (2023). Combining performance and estimated genetic diversity among soybean parents and F1 populations. Revista Ceres, 70(2):81-90.
- Sousa, L. B. et al. (2015). Genetic variability among soybean biparental crosses evaluated by multivariate analysis. Bioscience Journal, 31(5):1404-1412.
- Sousa, L. B. et al. (2020). Microsatellites and phenotypic characteristics used to select soybean lines in a Brazilian university breeding program. Genetics and Molecular Research, 19(1):gmr18105.
- Surbhi, K. et al. (2021). Assessment of genetic diversity among soybean genotypes differing in response to aerial blight (Rhizoctonia solani Kuhn) using SSR markers. Journal of Phytopathology, 169(1):37-44.
- Ullah, A. et al. (2021). Assessment of phenotypic and molecular diversity in soybean [Glycine max (L.) Merr.] germplasm using morpho-biochemical attributes and SSR markers. Genetic Resources and Crop Evolution, 68:2827-2847.
- Wysmierski, P. T.; Vello, N. A. (2013). The genetic base of Brazilian soybean cultivars: Evolution over time and breeding implications. Genetics and Molecular Biology, 36(4):547-555.
-
Editor de seção:
Renato Paiva