
 Geospatial mapping, trends, and factors associated with tuberculosis treatment interruption: an ecological study
ABSTRACT
Objective: To analyze the spatial and temporal patterns and factors associated with tuberculosis treatment interruption in Brazil from 2010 to 2020.
Method: Ecological study using geoprocessing. The Joinpoint method was used for temporal analysis. Spatial autocorrelation and scan statistics identified clusters. Spatial and non-spatial regression models, considering p < .05, detected factors associated with the outcome.
Results: A stationary trend in tuberculosis treatment interruption was observed across the country, with increases in the Central-West and North regions. Associated socioeconomic indicators included the Gini index, household density > 2, retreatment rate, social vulnerability index, illiteracy rate, percentage of individuals in extreme poverty, and Family Health Strategy coverage.
Conclusion: Treatment interruption showed a stationary trend. Spatial regression showed that socioeconomic vulnerability indicators influence the outcome, positively or negatively, depending on the region, which calls for intensified prevention and control efforts in those areas.
DESCRIPTORS:
Tuberculosis; Epidemiology; Treatment Interruption; Spatial Analysis; Social Determinants of Health.
HIGHLIGHTS
1. An increase in treatment interruption was identified in the Central-W est and North regions.
2. Relevant clusters were found in the Southeast region and Mato Grosso state.
3. Social vulnerability was associated with loss to follow-up in treatment.
4. Greater primary care coverage reduced treatment discontinuity.
RESUMO
Objetivo: Analisar os padrões espaciais, temporais e os fatores associados à interrupção do tratamento da tuberculose no Brasil entre 2010 e 2020.
Método: Estudo ecológico com uso de geoprocessamento. O método Joinpoint foi utilizado para análise temporal. A autocorrelação espacial e a varredura scan identificaram aglomerados. Modelos de regressão espacial e não espacial, considerando p<0,05, detectaram fatores associados ao desfecho.
Resultados: Observou-se tendência estacionária da interrupção do tratamento da tuberculose no país, com crescimento nas regiões Centro-Oeste e Norte. Os indicadores socioeconômicos associados foram: Índice de Gini, densidade domiciliar >2, taxa de retratamento, índice de vulnerabilidade social, taxa de analfabetismo, percentual de pessoas extremamente pobres e cobertura da Estratégia de Saúde da Família.
Conclusão: A interrupção do tratamento apresentou tendência estacionária. A regressão espacial mostrou que indicadores de vulnerabilidade socioeconômica influenciam o desfecho, positiva ou negativamente, conforme o território, o que demanda intensificação das ações de prevenção e controle nesses locais.
DESCRITORES:
Tuberculose; Epidemiologia; Interrupção do Tratamento; Análise Espacial; Determinantes Sociais da Saúde.
HIGHLIGHTS
1. Identificou-se aumento da interrupção do tratamento no Centro-Oeste e Norte.
2. Foram encontrados agrupamentos relevantes no Sudeste e Mato Grosso.
3. Vulnerabilidade social mostrou associação com a perda de seguimento do tratamento.
4. A maior cobertura da atenção primária reduziu a descontinuidade no tratamento.
RESUMEN
Objetivo: Analizar los patrones espaciales, temporales y los factores asociados con la interrupción del tratamiento de la tuberculosis en Brasil entre 2010 y 2020.
Método: Estudio ecológico con uso de geoprocesamiento. Se utilizó el método Joinpoint para el análisis temporal. La autocorrelación espacial y el rastreo scan identificaron conglomerados. Modelos de regresión espacial y no espacial, considerando p<0,05, detectaron factores asociados con el desenlace.
Resultados: Se observó una tendencia estacionaria en la interrupción del tratamiento de la tuberculosis en el país, con crecimiento en las regiones Centro-Oeste y Norte. Los indicadores socioeconómicos asociados fueron: Índice de Gini, densidad domiciliaria >2, tasa de retratamiento, índice de vulnerabilidad social, tasa de analfabetismo, porcentaje de personas en situación de extrema pobreza y cobertura de la Estrategia de Salud de la Familia.Conclusión: La interrupción del tratamiento presentó una tendencia estacionaria. La regresión espacial mostró que los indicadores de vulnerabilidad socioeconómica influyen en el desenlace, positiva o negativamente, según el territorio, lo que demanda la intensificación de acciones de prevención y control en esos lugares.
DESCRIPTORES:
Tuberculosis; Epidemiología; Interrupción del Tratamiento; Análisis Espacial; Determinantes Sociales de la Salud.
HIGHLIGHTS
1. Se identificó un aumento de la interrupción del tratamiento en el Centro-Oeste y el Norte.
2. Se encontraron conglomerados relevantes en el Sudeste y Mato Grosso.
3. La vulnerabilidad social mostró asociación con la pérdida de seguimiento del tratamiento.
4. La mayor cobertura de la atención primaria redujo la discontinuidad en el tratamiento.
INTRODUCTION
Tuberculosis (TB) is a compulsory-notification infectious disease caused by the bacillus Mycobacterium tuberculosis, which presents in pulmonary and extrapulmonary forms. This infection is both preventable and curable; however, it remains prevalent under conditions of social vulnerability and contributes to the perpetuation of social inequality1-2.
According to the World Health Organization (WHO), an estimated 10.8 million people fell ill with TB in 2023 and 1.25 million died worldwide. In the Americas, approximately 900 new cases and 100 TB-related deaths occur daily, with Brazil being one of the few high-burden countries in the region3-4.
It should be highlighted that, in 2024, Brazil recorded more than 84,000 new cases and an incidence rate of 39.7 cases per 100,000 inhabitants. The country also registered 6,025 deaths and a mortality rate of 2.8 deaths per 100,000 inhabitants5. Compared to 2023, incidence and mortality increased by 5% and 40%, respectively, indicating a rising trend6.
Treatment interruption is one of the main obstacles to TB control and cure, as it increases treatment costs, contributes to higher morbidity and mortality, promotes relapse, and fosters drug resistance. Moreover, it reflects social and structural barriers, revealing potential failures in prevention and treatment strategies, as well as deficiencies in healthcare service delivery. In Brazil, treatment interruption is defined as a patient’s absence from a health unit for more than 30 consecutive days after the scheduled return date7.
In Brazil, anti-TB treatment is standardized, lasts six months, and is offered free of charge by the Unified Health System (SUS). In 2023, 15.3% of new laboratory-confirmed TB cases were closed as treatment interruption, more than double the 5.0% threshold set by the End TB Strategy. The highest percentages occurred in the Southeast (15.6%) and North (15.0%) regions, both above the national average (14.2%)5.
METHOD
Although there is a growing number of studies on TB incidence and its implications in certain Brazilian regions1-2,4,7, few national studies apply an ecological approach to examine associated factors. In this context, temporal and spatial studies are essential for identifying clusters with high numbers of treatment interruption cases and understanding the associated socioeconomic factors, thereby providing support for guiding intervention strategies in the most affected territories. Accordingly, this study aimed to analyze the spatial and temporal patterns and factors associated with TB treatment interruption in Brazil from 2010 to 2020.
This is an ecological study covering the municipalities of Brazil. The country comprises 5,570 municipalities, 27 federative units, and five macro-regions (Northeast, North, Central-West, Southeast, and South)8
The study population included all TB treatment interruption cases reported in Brazil from 2010 to 2020 in each municipality. The series was interrupted at 2020 because the research was initiated in 2022 and, during data collection, it was observed that 2021 had a lower number of notifications, possibly related to incomplete consolidation of notifications in the Notifiable Diseases Information System (SINAN) for the full year.
The inclusion criteria were: the case must have been reported during the 2010-2020 period and entered into the system during the analyzed period, according to the municipality of residence, with the closure status variable showing the abandonment category. The population at risk used in the denominator was that which was undergoing TB treatment at the time of data collection. Cases with a closure status of death were excluded, as were the following entry types: relapse, re-entry after treatment interruption, and transfer.
Secondary data from SINAN for TB were used, compiled from the Department of Health Informatics (DATASUS) website. Cases were stratified by sex (male; female), age (0-19 years; 20-39 years; 40-59 years; ≥ 60), education (in years of completed schooling: none; 1-4; 5-8; 9-12; 12 or more), race/skin color (White; Yellow; Mixed-race or Black; Indigenous), notification region (Southeast; Northeast; South; North; Central-West), entry type (new case), disease form (pulmonary; extrapulmonary; pulmonary + extrapulmonary), HIV and AIDS testing (yes; no), diabetes (yes; no), alcoholism (yes; no), and mental illness (yes; no).
Sociodemographic variables of a categorical nature were described using absolute and relative frequencies. Subsequently, for simple temporal analysis, the proportion of cases year by year of TB treatment interruption was calculated for Brazil and its five regions, according to the formula below:
For the temporal analysis, the Joinpoint Regression Program software version 4.6.0.0 was used, which tested whether one or more inflection points should be added to the linear model using Monte Carlo permutation. The same software was used to calculate the Annual Percentage Change (APC) and the Average Annual Percentage Change (AAPC), considering a 95% confidence interval (95% CI).
The APC is a statistical measure used to evaluate the temporal trend of a rate over several years. It shows, on average, how much that rate increases or decreases per year, in percentage terms. While the APC shows the annual variation within a specific segment of the time series, the AAPC summarizes the entire period as a single value through a weighted average, even when trend changes have occurred over the years.
The model was adjusted, considering zero (one segment) to two inflection points (three segments), evaluating whether multiple segments better describe the trend than a single line. In all models, first-order autocorrelation (AR = 1) of errors was assumed, as health data exhibit temporal dependence.
Negative APC and AAPC values indicate a decreasing trend, while positive values indicate an increasing trend. When there is no statistical significance (p > .05), the trend is stationary. Each inflection point added to the model indicates a change in the linear trend9.
The year of occurrence of TB treatment interruption cases was defined as the independent variable, and the proportion of loss to follow-up among cases was defined as the dependent variable, calculated by the software and standardized through logarithmization.
For the spatial analysis, the mean standardized rate of anti-TB treatment interruption was calculated for each Brazilian municipality. Standardization adjusts for demographic differences, allowing more precise comparisons10. To this end, the numerator consisted of the number of new TB cases classified as dropout divided by the number of years studied (11 years), divided by the population in the central year of the time series (2015), and multiplied by 100. Based on this calculation, the dependent variable was expressed as a percentage (%), since the values were calculated per 100 inhabitants.
It should be noted that the class intervals for the Standardized Mean Rate map were defined manually, based on the distribution of observed values and visual clarity criteria, to facilitate interpretation of spatial patterns. Special emphasis was placed on the first legend category, which identifies municipalities that did not report TB treatment interruption and therefore have a case proportion equal to zero.
To identify spatial clusters, a spatial neighborhood matrix was first constructed. The rook contiguity criterion was adopted, assigning a value of 1 to municipalities that share borders and 0 to those without shared borders. Only shared borders between adjacent polygons were considered.
The Global and Local Moran Indices and the Getis-Ord Gi* technique were then applied. After confirming global spatial autocorrelation, the Local Moran Index (LISA) was used to identify clusters and quantify spatial association in each Brazilian municipality. Results were presented in two maps: the first graphically shows similarity among neighbors in four patterns, High/High and Low/Low (positive association, neighbors with similar values) and High/Low and Low/High (negative association, neighbors with different values)11.
The Getis-Ord Gi* technique creates z-scores that allow clusters to be identified. High z-score values indicate areas with high case proportions clustered among similar areas (hot spots); while low z-score values indicate areas with low case proportions surrounded by similar areas (cold spots)12.
It should be noted that, for this study, the option was made not to apply rate smoothing through global or local empirical Bayesian methods, in order to preserve the variability observed in the original rates. Furthermore, the local spatial association tests (LISA and Getis-Ord Gi*) were not adjusted for multiple testing control.
Purely spatial scan statistics were also applied, with a scanning window covering 50% of the population at risk and circular clusters. The municipality was used as the minimum spatial unit in the scan analysis using SaTScan software, configured for the discrete Poisson model, which automatically adjusts the analysis for the resident population, assuming the expected number of cases to be proportional to the population of each unit. This adjustment aims to control for the influence of population variation across municipalities, preventing clusters from being identified solely due to larger population contingents. The scan statistic enabled the calculation of relative risk (RR), in which municipalities with values > 1 have a relative risk of interrupting anti-TB treatment higher than that of the country as a whole13.
To investigate the factors related to TB treatment interruption, the non-spatial regression model Ordinary Least Squares (OLS) was used. The indicators obtained from the Atlas of Human Development in Brazil were: illiteracy rate among individuals 18 years of age or older (T_ANALF18M), Gini Index (GINI), proportion (%) of extremely poor individuals (PIND), percentage (%) of the population living in households with density > 2 (T_DENS), Municipal Human Development Index (MHDI), per capita income (RDPC), and percentage (%) of the population living in households with a bathroom and piped water (T_BATHWAT). Data on Family Health Strategy Coverage (FHS_COVERAGE) and Retreatment Rate (RETREATMENT_RATE) were obtained from DATASUS. The Brazilian Deprivation Index (BDI) was obtained from the Center for Data and Knowledge Integration for Health (CIDACS), and the Social Vulnerability Index (SVI) was obtained from the website of the Institute for Applied Economic Research (IPEA)
In the OLS model, explanatory variables were selected by backward selection, and multicollinearity was assessed using the Variance Inflation Factor (VIF). Variables that remained in the final model with p < .05 were included in the global geographic models (Spatial Lag and Spatial Error). Regression assumptions were verified, and the Moran test of residuals showed no spatial autocorrelation, confirming the adequacy of the OLS model.
Spatial Lag assigns spatial autocorrelation to the dependent variable, while Spatial Error assumes spatial dependence due to variables not included in the model14. The OLS, Spatial Lag, and Spatial Error models apply to the entire analyzed region (Brazil)15. Model comparison was based on the highest adjusted R2 and lowest Akaike Information Criterion (AIC).
It should be noted that, for sociodemographic analyses, records whose variables of interest were classified as “unknown” or “not reported” on notification forms were excluded, and complete case analysis was performed without value imputation. For spatial and temporal analyses, records without information on the municipality of residence were excluded, as this variable is essential for geocoding and constructing the spatiotemporal units of analysis.
Spatial autocorrelation testing was performed using TerraView 4.2.2® software. The Getis-Ord Gi* technique and the Spatial Lag and Spatial Error regressions were conducted in GeoDa 1.14®. OLS regression was performed using Stata v.13® software. All maps were produced using the QGIS 3.16 software.
As this study used secondary public-domain data, submission to a Research Ethics Committee was not required, in accordance with Resolution 674/2022 of the National Health Council.
RESULTS
A total of 82.594 TB treatment interruption cases were recorded during the study period. The highest frequency occurred among men, 61.791 (74.8%), and in the 20-39 years age group, 47.527 (57.6%). More than half were Mixed-race or Black, 52.848 (69.8%), and had up to eight years of education, 23.528 (70.0%). The highest proportion of cases was concentrated in the South region of Brazil, 39.202 (47.5%) (Table 1).
Sociodemographic characterization of tuberculosis treatment interruption cases in Brazil, 2010-2020. Parnaíba, Piauí, Brazil, 2023
The pulmonary form accounted for 71,917 (87.1%) of cases. Approximately 11,157 (13.5%) individuals were living with HIV, of whom 10,128 (14.6%) met criteria compatible with AIDS. Approximately one in four individuals engaged in harmful alcohol use, 20,083 (28.2%), used illicit drugs, 14,566 (29.1%), and smoked tobacco, 14,746 (29.4%). Smaller proportions were observed among individuals with diabetes, 3,563 (4.8%), mental disorders, 1,993 (2.7%), persons deprived of liberty, 5,083 (9.9%), and homeless individuals, 4,018 (7.9%).
The mean treatment interruption rate, according to the formula described above, was 10.4%, with an increase from 10.3% in 2010 to 11.5% in 2020. The Southeast (10.8%) and South (10.6%) regions had the highest regional mean rates.
The Joinpoint analysis identified a stationary trend (AAPC: 0.7; 95% CI: -0.6 - 2.1; p < .1) in TB treatment interruption across the country. A marked increase in treatment interruption was also observed in the Central-West (AAPC: 3.9; 95% CI: 3.0 - 4.8; p < .001), followed by the North region (APC: 2.6; 95% CI: 1.6 - 3.8; p < .001) (Table 2).
Annual Percentage Change (APC) and Average Annual Percentage Change (AAPC) of tuberculosis treatment interruption in Brazil, 2010-2020. Parnaíba, Piauí, Brazil, 2023
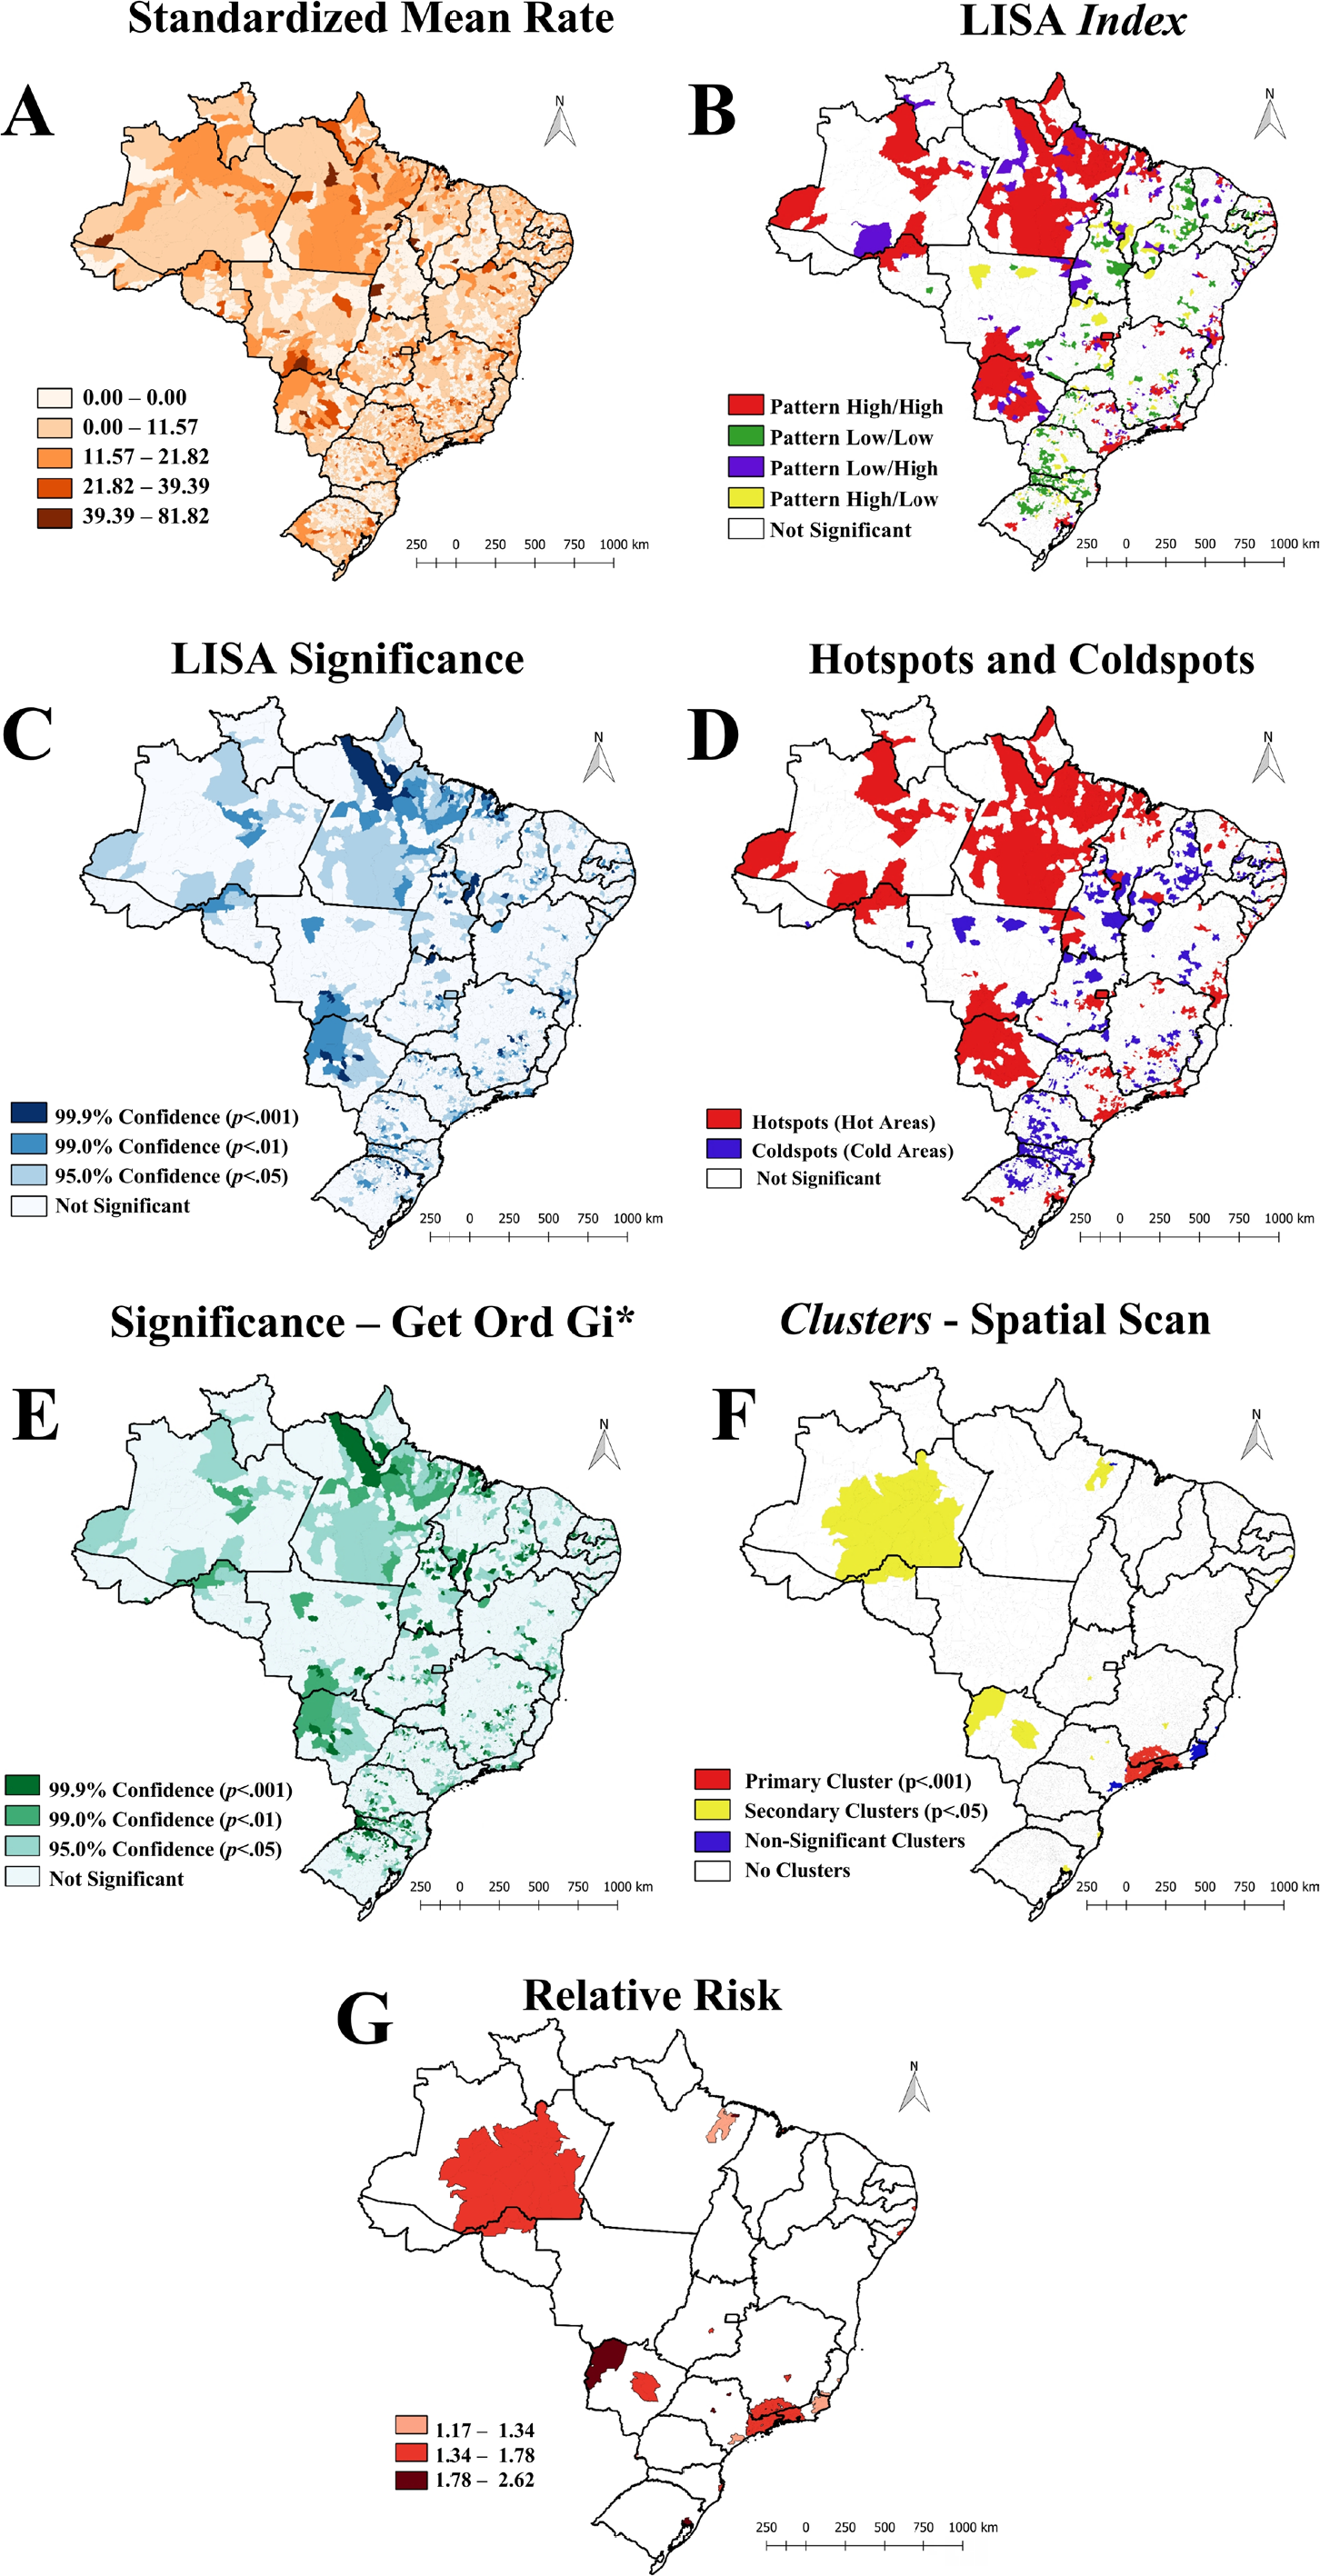
Figure 1 shows the results of the spatial cluster detection techniques. The standardized mean incidence rate map (Map A) shows irregular dispersion, forming a mosaic-like pattern, with most municipalities presenting rates ranging from 0.0% to 11.1% (Map A).
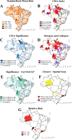
Distribution of the standardized mean incidence rate (A), Local Moran Index - LISA Index (B), LISA Significance (C), Hot spots and cold spots (D), Significance - Getis-Ord Gi* (E), Scan clusters (F), Relative Risk (G), 2010-2020. Parnaíba, Piauí, Brazil, 2023
After confirming significant global spatial autocorrelation (I = 0.1; p = .001), the Local Moran Index was calculated. Cluster analysis of treatment interruption identified a High/High distribution pattern in municipalities located primarily in the North region, the state of Mato Grosso do Sul (Central-West), and the coastline of the Southeast region (Map B). Map C shows the statistical significance of municipalities that exhibited some spatial pattern.
Using the Getis-Ord Gi* technique (Map D), hotspots were confirmed in the territories with a High/High pattern identified in Map B, as well as their statistical significance (Map E). Maps F and G show the spatial clusters and relative risk (RR) of treatment interruption in Brazil, calculated using purely spatial scan statistics. A total of 26 clusters were identified, 20 of which were statistically significant (p < .05). The primary cluster, with the lowest probability of occurring by chance, included 201 municipalities, mainly in the Southeast Region, encompassing Minas Gerais, the coastal areas of Rio de Janeiro, and São Paulo. The significant secondary clusters were located in Amazonas, Mato Grosso do Sul, and Pará (Map F). In Map G, some municipalities in Mato Grosso do Sul (wine-colored) presented the highest RR in Brazil for interruption of anti-TB treatment (RR = 1.7-2.6)
Table 3 presents detailed information on the 26 TB treatment interruption clusters in Brazil, of which 20 were statistically significant and six were not, as determined by purely spatial scan statistics. The primary cluster has a radius of 199.3 km and the municipalities comprising it have, on average, 1.5 times the risk of TB treatment interruption compared to other Brazilian municipalities.
Spatial clusters of tuberculosis treatment interruption cases, defined by purely spatial scan statistics in Brazil, 2010-2020. Parnaíba, Piauí, Brazil, 2023
To test the influence of socioeconomic indicators on anti-TB treatment interruption, the results of the OLS (R2 = 0.062; AIC = 38,397.72), Spatial Lag (R2 = 0.069; AIC = 38,408.80), and Spatial Error (R2 = 0.068; AIC = 38,414.4) regression models were compared. The OLS and Spatial Lag models showed better fit, with OLS presenting the lowest AIC and Spatial Lag the highest R2.
Table 4 shows the independent variables that presented a positive correlation with the outcome variable in the OLS model: Gini Index (GINI) (β = 4.1; p = .042), population living in households with density >2 (β = 0.1; p < .001), Retreatment Rate (RETREATMENT_RATE) (β = 0.0; p = .001), and Social Vulnerability Index (SVI) (β = 11.2; p = .001). Therefore, as the indicator increases, cases of treatment interruption increase proportionally. In contrast, the indicators Illiteracy Rate among Individuals 18 Years of Age or Older (T_ANALF18M) (β = -0.1; p < .001), Percentage of Extremely Poor Individuals (PIND) (β = -0.1; p < .001), and Family Health Strategy Coverage (FHS_COVERAGE) (β = -1.3; p = .002) presented a negative correlation with the outcome. Therefore, as the indicator increases, cases of treatment interruption decrease.
OLS, Spatial Lag, and Spatial Error regression models of indicators associated with tuberculosis treatment interruption, Brazil, 2010-2020. Parnaíba, Piauí, Brazil, 2023
DISCUSSION
This study found, through temporal analysis, a stationary trend in the proportion of TB treatment interruption cases in Brazil over the analyzed period. Concurrently, spatial analyses identified clusters with high proportions of interruption cases concentrated mainly in the North region, the coastline of the Southeast region, and the state of Mato Grosso do Sul, located in the Central-West region.
Based on the regression models, a positive correlation was observed between treatment interruption and the socioeconomic indicators: Gini index, proportion of the population residing in dwellings with density exceeding two occupants per bedroom, retreatment rate, and SVI. These findings indicate that as such conditions intensify, the outcome increases proportionally.
Joinpoint analysis identified a stationary trend in the proportion of anti-TB treatment interruption cases nationwide; however, the North and Central-West regions showed an increasing trend. A Brazilian study indicates that the North region has the second lowest mean human development index (0.701) and the lowest primary health care (PHC) coverage, estimated at 59.5%. These conditions contribute to delayed diagnosis, hinder the identification and follow-up of contacts, and compromise treatment adherence, favoring the maintenance of the disease transmission chain16.
Understanding the identified clusters requires analyzing the structural and historical determinants that shape conditions of social vulnerability and unequal access to health services. The North region presents TB treatment interruption rates persistently above the threshold recommended by the National Tuberculosis Control Program, which targets cure in at least 85% of cases and proper treatment in 100%, revealing weaknesses in continuity of care and longitudinal patient follow-up17. This scenario is compounded by geographic barriers, extensive distances, and limitations of PHC in the region, which compromise the effective implementation of Directly Observed Treatment (DOT)18.
In the Southeast and South regions, despite greater economic concentration, urban inequalities and sociospatial segregation persist, contributing to higher TB incidence and an elevated risk of treatment interruption. These findings reinforce that regional development does not necessarily translate into health equity13,19. A national analysis covering the period from 2012 to 2018 showed that the Southeast (10.78%), South (10.70%), and North (10.35%) regions had the highest mean treatment interruption rates in the country20.
This situation is related to the living conditions of the population and the spatial organization of cities, particularly in the Southeast and South regions, which concentrate both wealth production and social inequality. These contexts increase exposure to vulnerabilities, contributing to higher disease incidence and, consequently, greater risk of TB treatment interruption1,2,19. Such evidence reinforces that overcoming therapeutic discontinuity requires intersectoral policies capable of simultaneously addressing structural inequalities and recent demographic pressures.
In the Central-West region, the persistence of high interruption rates can be explained by structural vulnerabilities related to income inequality, racial segregation, precarious housing, and territorial heterogeneity. Studies indicate that municipalities with greater racial and income segregation present worse treatment outcomes, including treatment interruption, regardless of local mean income16,19.
In the state of Mato Grosso do Sul, the high TB rate among people experiencing homelessness reflects barriers to accessing health services and weaknesses in public policy coverage20. Furthermore, more populous areas face greater service demand and higher risk of therapeutic discontinuity, while smaller municipalities tend to maintain greater proximity between services and communities, favoring adherence. These factors help explain the formation of the identified clusters and reinforce the need for integrated intersectoral policies21.
The illiteracy rate among individuals aged 18 years or older and the percentage of individuals in extreme poverty showed a negative association with the outcome, a seemingly paradoxical result given the literature, which identifies higher education as a protective factor against treatment interruption, since low levels of schooling compromise understanding of therapeutic guidelines2,7,13.
This inverse association may be related to underreporting and incomplete completion of closure forms, particularly in contexts of greater social vulnerability. In such settings, individuals who interrupt treatment tend to have incomplete records in SINAN, which may underestimate both the magnitude of the outcome and the impact of social benefits and programmatic actions22.
Another relevant aspect is that municipalities with poorer educational and economic indicators are frequently prioritized by public policies and TB control programs, receiving greater support through DOT and closer monitoring by primary care teams12,22. The negative association observed may therefore reflect the effect of targeted interventions, rather than lesser individual vulnerability.
The literature indicates that TB has deep roots in poverty, facilitating its transmission, delayed diagnosis, and treatment interruption1,2,23-24. Although the results may appear paradoxical, they are articulated with the spatial organization of cities, as areas that concentrate wealth and social inequality show greater exposure to vulnerabilities, increasing both incidence and the risk of interruption, as observed in the South (22.94%) and Southeast (19.61%) regions23.
A study conducted in Peru identified factors associated with TB treatment interruption across different dimensions of the patient’s life, including distance to the health unit, absence of perceived clinical improvement, lack of knowledge about the disease, and insufficient family or social support. In addition, factors related to health services were identified, such as inadequate interpersonal relationships with healthcare providers, long waiting times, and insufficient explanations about treatment25.
Family Health Strategy (FHS) coverage was found to contribute to the reduction of TB treatment interruption. A Brazilian study identifies PHC as an essential marker of access to services, especially considering that a large share of the population depends exclusively on this level of care. In the North region, low PHC coverage and a shortage of healthcare providers delay diagnosis and treatment initiation, favoring therapeutic interruption16.
The expansion of PHC, particularly through the FHS, constitutes a fundamental protective factor in TB control within universal public health systems. Evidence indicates that territories with greater coverage present lower incidence and mortality rates, along with higher treatment adherence and lower interruption rates26. These results reflect the reach of services and the longitudinal bond established between teams and communities.
In this context, nursing plays a central role in care coordination and case surveillance, acting in early identification, clinical management, therapeutic supervision, and psychosocial support26. Literature reviews highlight that the active involvement of nurses in FHS teams promotes continuity of care, effectiveness of control actions, and follow-up of vulnerable groups24,27. Expanding PHC coverage and strengthening the leading role of nursing are therefore essential strategies for an integrated, equitable, and sustainable response to TB.
Although widely recommended, DOT presents variable effectiveness, dependent on service organization and community engagement. Community-based DOT models demonstrate better outcomes compared to those conducted exclusively at health units, as they strengthen territorial bonds and reduce access barriers26.
Digital technologies, such as video directly observed therapy, also show promise. Clinical trials indicate efficacy non-inferior to in-person DOT, with greater acceptability, flexibility, and less embarrassment for patients27-28. The integration of community and digital strategies with PHC represents a relevant advance in overcoming the historical challenges of DOT, particularly among vulnerable populations.
The Gini index showed a positive correlation with anti-TB treatment interruption. A study conducted in Peru demonstrated that low-income individuals face greater barriers to accessing health services, including loss of work days and transportation costs, making treatment adherence more difficult25. Social inequality is also associated with high population density and intense migratory flows, phenomena that contribute to crime, slum growth, poverty, and unemployment, worsening living conditions29.
In this study, housing conditions emerged as a risk factor for TB treatment interruption. These findings corroborate investigations that point to higher disease incidence in overcrowded housing, a scenario consistent with the infectious, airborne transmission nature of TB29.
The retreatment rate showed a positive correlation with therapeutic interruption. National studies indicate that the type of system entry is associated with increased abandonment, particularly among previously cured individuals or those re-entering after interruption, who present a higher risk of new episodes and treatment discontinuity6,22,24. These situations favor transmission and the emergence of resistant strains, complicating clinical management30.
A positive correlation was also identified between the SVI and treatment interruption. This index encompasses dimensions related to human capital, income, urban infrastructure, and employment, and the absence or insufficiency of these conditions indicates a low standard of living and difficulty accessing social rights29-30. National studies reinforce that socioeconomic factors affect the quality of health services, resulting in delayed diagnosis, increased risk of treatment interruption, and TB-related deaths, constituting an important barrier to disease control1-2,7,21.
This study has limitations due to its use of aggregate data, which makes it difficult to draw individual-level inferences from the results. It should be noted that data from after 2020 could not be included in the analyses. During the data collection phase (conducted in 2022), it was observed that 2021 had a lower-than-expected volume of notifications, possibly because the system did not yet have complete records for that period. This lag could have compromised the consistency of results, which is why this interval was excluded.
Furthermore, the use of secondary data may be subject to inconsistencies due to underreporting and inadequate form completion. Since this study relies on the completion of notification forms, some clinical variables that would have been relevant to the analysis are either absent from the form or are not properly filled in, limiting the results.
In addition, the results of the multivariate analysis should be interpreted with caution due to the proportional nature of the dependent variable. For this reason, there are theoretical restrictions on its use in linear models, as the outcome is bounded between 0 and 100, which may affect residual normality and homoscedasticity. However, the observed percentages varied within an intermediate range, without extreme values, which reduces the risk of distortions associated with the bounded nature of the variable, and residual analysis did not indicate serious violations of normality or homoscedasticity.
The choice of linear regression (OLS) was essentially exploratory in purpose, aimed at identifying global and local spatial associations and patterns, not at estimating precise marginal effects or making predictive inferences. Accordingly, the coefficients should be interpreted primarily in terms of the direction and significance of associations, rather than as exact measures of effect magnitude. Future studies could employ models more appropriate for proportional outcomes, such as binomial or beta GLM, to deepen and refine the estimates observed in this study. Finally, although the retreatment rate showed significance in the OLS model, its near-zero coefficients indicate a small effect on the outcome.
Finally, caution should be exercised when interpreting the results, since the use of aggregated data may lead to inferences that do not necessarily represent valid relationships at the individual level.
CONCLUSION
The proportion of TB treatment interruption cases remained stationary over the analyzed years, except in the Central-West and North regions, which showed an increasing trend. Spatial analyses identified case clusters in the North region, Mato Grosso do Sul, and the Southeast coastline. Spatial regression showed that socioeconomic vulnerability indicators influence the outcome, positively or negatively, depending on the territory.
Considering this, practical interventions targeting the socioeconomic factors that affect health are recommended, particularly for the most affected populations, in order to prevent TB spread and treatment interruption. It is essential that healthcare providers understand the territorial influences and identify vulnerabilities in the health-disease process, so that actions become more effective. Investment in educational initiatives at the primary care level regarding the importance of treatment and the risks of interruption is also essential for increasing cure rates.
Future research using different methodological approaches, such as binomial or beta GLM models, is also recommended to deepen the understanding of the factors that influence TB treatment interruption. It should also be emphasized that this methodological limitation must be explicitly acknowledged in the present discussion to guide subsequent investigations and contribute to improving disease surveillance, prevention, and control strategies.
-
HOW TO REFERENCE THIS ARTICLE:
Rocha MIF, Maranhão TA, da Frota MMC, Albuquerque JN, Figueira JNR, de Abreu AM, et al. Geospatial mapping, trends, and factors associated with tuberculosis treatment interruption: an ecological study. Cogitare Enferm [Internet]. 2026 [cited “insert year, month and day”];31:e100798en. Available from: https://doi.org/10.1590/ce.v31i0.100798en
Data availability:
The authors declare that all data are fully available within the article.
References
-
1 Sousa GJB, Maranhão TA, Leitão TMJS, de Souza JT, Moreira TMM, Pereira MLD. Prevalence and associated factors of tuberculosis treatment abandonment. Rev Esc Enferm USP [Internet]. 2021 [cited 2024 Mar 20];55:e03767. Available from: https://doi.org/10.1590/S1980-220X2020039203767
» https://doi.org/10.1590/S1980-220X2020039203767 -
2 Santos DAS, Marques ALA, Goulart LS, Mattos M, de Olinda RA. Factors associated with abandonment of pulmonary tuberculosis treatment. Cogitare Enferm [Internet]. 2021 [cited 2024 Mar 20];26:e72794. Available from: https://doi.org/10.5380/ce.v26i0.72794
» https://doi.org/10.5380/ce.v26i0.72794 -
3 World Health Organization (WHO). Global Tuberculosis Report 2024 [Internet]. Geneva: WHO; 2024 [cited 2025 Jan 30]. Available from: https://www.who.int/teams/global-tuberculosis-programme/tb-reports/global-tuberculosis-report-2024
» https://www.who.int/teams/global-tuberculosis-programme/tb-reports/global-tuberculosis-report-2024 -
4 Organização Pan-Americana da Saúde (OPAS). Organização Mundial da Saúde (OMS). Dia Mundial da Tuberculose 2025 [Internet]. Washington, DC: OPAS; 2025 [cited 2025 Nov 2]. Available from: https://www.paho.org/pt/campanhas/dia-mundial-da-tuberculose-2025#mensajes
» https://www.paho.org/pt/campanhas/dia-mundial-da-tuberculose-2025#mensajes -
5 Brasil. Ministério da Saúde. Secretaria de Vigilância em Saúde e Ambiente. Departamento de HIV, Aids, Tuberculose, Hepatites Virais e Infecções Sexualmente Transmissíveis. Boletim epidemiológico: tuberculose 2025 [Internet]. Brasília: Ministério da Saúde (BR); 2025 [cited 2025 Nov 2]. Available from: https://www.gov.br/aids/pt-br/central-de-conteudo/boletins-epidemiologicos/2025/boletim-epidemiologico-tuberculose-2025/view
» https://www.gov.br/aids/pt-br/central-de-conteudo/boletins-epidemiologicos/2025/boletim-epidemiologico-tuberculose-2025/view -
6 Brasil. Ministério da Saúde. Secretaria de Vigilância em Saúde e Ambiente. Departamento de HIV, Aids, Tuberculose, Hepatites Virais e Infecções Sexualmente Transmissíveis. Boletim epidemiológico: tuberculose 2024 [Internet]. Brasília: Ministério da Saúde (BR); 2024 [cited 2024 Jun 28]. 72 p. Available from: https://www.gov.br/aids/pt-br/central-de-conteudo/boletins-epidemiologicos/2024/boletim-epidemiologico-tuberculose-2024/view
» https://www.gov.br/aids/pt-br/central-de-conteudo/boletins-epidemiologicos/2024/boletim-epidemiologico-tuberculose-2024/view -
7 Poersch K, Costa JSD. Fatores associados ao abandono do tratamento da tuberculose: estudo de casos e controles. Cad Saúde Colet [Internet]. 2022 [cited 2024 Mar 28];29(4):485-95. Available from: https://doi.org/10.1590/1414-462X202129040
» https://doi.org/10.1590/1414-462X202129040 -
8 Instituto Brasileiro de Geografia e Estatística (IBGE). Conheça o Brasil - território [Internet]. Rio de Janeiro: IBGE; 2022 [cited 2022 Mar 25]. Available from: https://educa.ibge.gov.br/jovens/conheca-o-brasil/territorio/20644-clima.html
» https://educa.ibge.gov.br/jovens/conheca-o-brasil/territorio/20644-clima.html -
9 Division of Cancer Control & Population Sciences. Joinpoint Trend Analysis Software [Internet]. Bethesda (MD): National Cancer Institute; 2022 [cited 2024 Jun 28]. Available from: https://surveillance.cancer.gov/joinpoint/
» https://surveillance.cancer.gov/joinpoint/ -
10 Sousa GJB, Garces TS, Pereira MLD, Moreira TMM, da Silveira GM. Temporal pattern of tuberculosis cure, mortality, and treatment abandonment in Brazilian capitals. Rev Latino-Am Enfermagem [Internet]. 2019 [cited 2024 Apr 5];27:e3218. Available from: https://doi.org/10.1590/1518-8345.3019.3218
» https://doi.org/10.1590/1518-8345.3019.3218 -
11 Vach W, Wehberg S, Luta G. Do common risk adjustment methods do their job well if center effects are correlated with the center-specific mean values of patient characteristics? Med Care [Internet]. 2024 [cited 2024 Apr 6];62(11):773-81. Available from: https://doi.org/10.1097/mlr.0000000000002008
» https://doi.org/10.1097/mlr.0000000000002008 -
12 Arcêncio RA, Berra TZ, Terena NFM, Rocha MP, Alecrim TFA, Kihara FMS, et al. Spatial clustering and temporal trend analysis of international migrants diagnosed with tuberculosis in Brazil. PLoS One [Internet]. 2021 [cited 2024 Apr 10];16(6):e0252712. Available from: https://doi.org/10.1371/journal.pone.0252712
» https://doi.org/10.1371/journal.pone.0252712 -
13 Silva TL, Maranhão TA, Sousa GJB, da Silva IG, Lira Neto JCG, Araujo GAS. Spatial analysis of suicide in Northeastern Brazil and associated social factors. Texto Contexto Enferm. [Internet]. 2022 [cited 2024 Apr 12];31:e20210096. Available from: https://doi.org/10.1590/1980-265X-TCE-2021-0096
» https://doi.org/10.1590/1980-265X-TCE-2021-0096 - 14 Anselin L. An Introduction to Spatial Data Science with GeoDa. Volume 1: exploring spatial data. New York: Chapman and Hall/CRC; 2024. 416 p.
-
15 Charlton M, Fotheringham S, Brunsdon C, Jacobs D. Geographically Weighted Regression [Internet]. 2006 [cited 2024 Apr 10];48(1). Available from: https://www.researchgate.net/publication/228709187_Geographically_weighted_regression
» https://www.researchgate.net/publication/228709187_Geographically_weighted_regression -
16 Cortez AO, de Melo AC, Neves LO, Resende KA, Camargos P. Tuberculosis in Brazil: one country, multiple realities. J Bras Pneumol. [Internet]. 2021 [cited 2024 Apr 12];47(2):e20200119. Available from: https://www.scielo.br/j/jbpneu/a/DsDmc6KJFtcCxG8tfkBcGLz/?lang=en
» https://www.scielo.br/j/jbpneu/a/DsDmc6KJFtcCxG8tfkBcGLz/?lang=en -
17 Brasil. Ministério da Saúde. Secretaria de Vigilância em Saúde. Departamento de Vigilância Epidemiológica. Coordenação Geral de Doenças Endêmicas. Programa Nacional de Controle da Tuberculose. Plano Estratégico para o Controle da Tuberculose, Brasil 2007-2015. Brasília: MS; 2006. Available from: https://bvsms.saude.gov.br/bvs/publicacoes/ProgramaTB.pdf
» https://bvsms.saude.gov.br/bvs/publicacoes/ProgramaTB.pdf -
18 Garrido MS, Penna ML, Perez-Porcuna TM, de Souza AB, Marreiro LS, Albuquerque BC et al. Factors associated with tuberculosis treatment default in an endemic area of the Brazilian Amazon: a case-control study. [Internet]. PLoS One. 2012 [cited 2024 Apr 29];7(6):e39134. Available from: https://doi.org/10.1371/journal.pone.0039134
» https://doi.org/10.1371/journal.pone.0039134 -
19 Hall Q, de Sousa Filho JF, Guimarães JMN, Malta DC, Romero-Sandoval NC, Hargreaves S, et al. Associations of municipality-level income and racial segregation with individual-level tuberculosis treatment outcomes in Brazil: a nationwide cohort study (2010-2019). J Epidemiol Community Health [Internet]. 2025 [cited 2025 May 4];79(10):779-786. Available from: https://doi.org/10.1136/jech-2024-223465
» https://doi.org/10.1136/jech-2024-223465 -
20 Prado PAM, Pequito DCT, Pando SC, Oda JMM. Perfil socioepidemiológico de tuberculose em Mato Grosso do Sul (2018-2023). J Health NPEPS [Internet]. 2025 [cited 2025 May 4];10(1). Available from: https://doi.org/10.30681/2526101013554
» https://doi.org/10.30681/2526101013554 -
21 Soeiro VMS, Caldas AJM, Ferreira TF. Abandono do tratamento da tuberculose no Brasil, 2012-2018: tendência e distribuição espaço-temporal. Ciênc Saúde Colet [Internet]. 2022 [cited 2024 May 4];27(3):825-36. Available from: https://doi.org/10.1590/1413-81232022273.45132020
» https://doi.org/10.1590/1413-81232022273.45132020 -
22 Pavinati G, de Lima LV, Ferreira MRL, Zanatta STP, Magnabosco GT. Trends and clusters of tuberculosis treatment interruption among people experiencing homelessness in Brazil: influence of individual, social and programmatic factors. Rev Bras Epidemiol [Internet]. 2025 [cited 2025 May 4];28:e250041. Available from: https://doi.org/10.1590/1980-549720250041
» https://doi.org/10.1590/1980-549720250041 -
23 de Lima LV, Pavinati G, Palmieri IGS, Vieira JP, Blasque JC, Higarashi IH, et al. Factors associated with loss to follow-up in tuberculosis treatment in Brazil: a retrospective cohort study. Rev Gaúcha Enferm [Internet]. 2023 [cited 2024 Apr 29];44:e20230077. Available from: https://doi.org/10.1590/1983-1447.2023.20230077.en
» https://doi.org/10.1590/1983-1447.2023.20230077.en -
24 de Lucena LA, Dantas GBS, Carneiro TV, Lacerda HG. Factors associated with the abandonment of tuberculosis treatment in Brazil: a systematic review. Rev Soc Bras Med Trop [Internet]. 2023 [cited 2024 Apr 29];56:e0155-2022. Available from: https://doi.org/10.1590/0037-8682-0155-2022
» https://doi.org/10.1590/0037-8682-0155-2022 -
25 Rivera O, Benites S, Mendigure J, Bonilla CA. Abandono del tratamiento en tuberculosis multirresistente: factores asociados en una región con alta carga de la enfermedad en Perú. Biomédica [Internet]. 2019 [cited 2024 Apr 29];39(Suppl 2):44-57. Available from: https://doi.org/10.7705/biomedica.v39i3.4564
» https://doi.org/10.7705/biomedica.v39i3.4564 -
26 Jesus GS, Pescarini JM, Silva AF, Torrens A, Carvalho WM, Junior EPP, et al. The effect of primary health care on tuberculosis in a nationwide cohort of 7·3 million Brazilian people: a quasi-experimental study. Lancet Glob Health [Internet]. 2022 [cited 2024 Apr 30];10(3):e390-e397. Available from: https://doi.org/10.1016/S2214-109X(21)00550-7
» https://doi.org/10.1016/S2214-109X(21)00550-7 -
27 Makabayi-Mugabe R, Musaazi J, Zawedde-Muyanja S, Kizito E, Fatta K, Namwanje-Kaweesi H, et al. Community-based directly observed therapy is effective and results in better treatment outcomes for patients with multi-drug resistant tuberculosis in Uganda. BMC Health Serv Res [Internet]. 2023 [cited 2024 May 2];23:1248. Available from: https://doi.org/10.1186/s12913-023-10120-7
» https://doi.org/10.1186/s12913-023-10120-7 -
28 Chen EC, Owaisi R, Goldschmidt L, Maimets IK, Daftary A. Patient perceptions of video directly observed therapy for tuberculosis: a systematic review. J Clin Tuberc Other Mycobact Dis [Internet]. 2023 [cited 2024 May 2];35:100406. Available from: https://doi.org/10.1016/j.jctube.2023.100406
» https://doi.org/10.1016/j.jctube.2023.100406 -
29 Mendonça SA, Franco SC, Vieira CV, Do Prado RL. Análise espacial da tuberculose em Santa Catarina correlacionando com determinantes sociais e de saúde. Rev Bras Geog Fís [Internet]. 2020 [cited 2024 May 5];13(7):3159-76. Available from: https://doi.org/10.26848/rbgf.v13.07.p3159-3176
» https://doi.org/10.26848/rbgf.v13.07.p3159-3176 -
30 de Almeida FA, Gonçalves MJF. Factors associated with unsuccessful tuberculosis treatment in Manaus, Amazonas, from 2011 to 2021. Rev Esc Enferm USP [Internet]. 2024 [cited 2026 Apr 7];58:e20240431. Available from: https://doi.org/10.1590/1980-220X-REEUSP-2023-0431en
» https://doi.org/10.1590/1980-220X-REEUSP-2023-0431en
-
Associate editor:
Cremilde Aparecida Trindade Radovanovic

 Source: The authors (2023).