
 Aging and accessibility: stratified analysis of the census in Rio Grande do Sul
Abstract
In addition to discussing mobility and accessibility in large urban centers, which are central challenges today, it is essential to consider recent demographic changes that impose new barriers to mobility and access to urban spaces. This article analyzes the Urban Planning Survey of Household Surroundings, conducted as part of the 2010 and 2022 Population Censuses, in the most aged state in Brazil: Rio Grande do Sul. The survey evaluates sidewalks, ramps, bus stops, and obstacles on the streets in two strata of the state’s municipalities – the ten most populous and the ten with the highest proportions of older adults. The results show advancements in infrastructure but also highlight inequalities that require integrated public policies to place aging at the center of urban planning.
Keywords:
aging; accessibility; population census; public policies
Resumo
Além das discussões sobre mobilidade e acessibilidade nos grandes centros urbanos, que são desafios centrais da atualidade, é fundamental considerar as mudanças demográficas recentes, que impõem novas barreiras ao deslocamento e ao acesso aos espaços urbanos. Este artigo analisa a Pesquisa Urbanística do Entorno dos Domicílios, realizada no âmbito dos censos demográficos de 2010 e 2022, no estado mais envelhecido do Brasil, o Rio Grande do Sul. A pesquisa avalia calçadas, rampas, pontos de ônibus e obstáculos nas vias em dois estratos de municípios – os dez mais populosos e os dez mais envelhecidos – do estado. Os resultados apontam avanços em infraestrutura, mas evidenciam desigualdades que exigem políticas públicas integradas que coloquem o envelhecimento no centro do planejamento urbano.
Palavras-chave:
envelhecimento; acessibilidade; censo demográfico; políticas públicas
Introduction
In recent years, research on urban mobility has gained momentum, with an increase in academic output and a diversification of approaches, whose analyses incorporate urban, environmental, and social dimensions, reflecting the complexity of the subject. Urban mobility, more than just physical movement, is understood as a strategic asset, linking flows of people, goods, and information and playing a structuring role in the organization and functioning of contemporary cities.
From this perspective, research addressing urban mobility through the lenses of justice and equity stands out (Silva, Pinto, & Bertollini, 2019; Straatemeier & Bertollini, 2020), in which accessibility is conceived as a central principle. Understood as the number of opportunities that can be accessed within certain time limits or travel costs, accessibility has established itself as a key element for understanding and formulating policies focused on urban mobility.
Beyond the debate on forms of mobility and spatial accessibility for the population in major urban centers – one of the main contemporary challenges – it is also necessary to reflect on the transformations in current demographic patterns, which impose additional obstacles to access and movement within the space. The aging of Brazil’s population is part of a broader process of demographic transition, characterized by a progressive decline in fertility and mortality rates, resulting in significant changes in the population’s age structure (Matos et al., 2024). This phenomenon, which reflects global trends (UN Desa, 2022), is unfolding at a particularly rapid pace in Brazil. According to the Brazilian Institute of Geography and Statistics (IBGE, 2023a), from 2000 to 2023, the proportion of older adults (aged 60 or older) in the Brazilian population nearly doubled, rising from 8.7% to 15.6%. Furthermore, according to projections, by 2070, approximately 37.8% of the country’s inhabitants will be elderly (IBGE, 2018).
Aging is often associated with increased vulnerability to conditions that partially or completely compromise the functional autonomy, physical and emotional vitality, and social integration of the elderly population. This scenario poses additional challenges for public policies, especially in the areas of urban mobility, infrastructure, health, and social security, requiring the restructuring of support systems and the formulation of inclusive strategies aimed at ensuring accessibility and quality of life for the elderly population. In this context, understanding the territorial and social impacts of aging becomes essential for urban and regional planning (Castiglioni, 2006; Mendes and Valsecchi, 2007).
The Demographic Census conducted by the IBGE in 2022 provided an updated portrait of the Brazilian population. The data were released by the Institute starting in 2023 and revealed a new reality for Brazilian municipalities: an increasingly long-lived and aging population. The state of Rio Grande do Sul (RS) has the oldest population in Brazil, with an aging index of 80.4 – meaning more than 80 older adults for every 100 children or youth aged 0 to 14. Of the 20 Brazilian municipalities with the highest proportional percentage of older adults in the population, 19 are located in RS. Also according to the results of the 2022 Census, the age group of the population aged 65 and older accounts for 14.1% of the population of Rio Grande do Sul, while for Brazil the percentage is 10.9% (IBGE, 2023a).
The aging of the population in Rio Grande do Sul can be explained by factors such as the decline in women’s fertility rates and the increase in migration of young people to other regions, while the rise in life expectancy is the result of efforts and improvements in various areas, such as public health, urban infrastructure, and basic sanitation. On the other hand, with an increasingly long-lived and aging population, there is a call for the urgent formulation of new public policies specifically targeting the elderly, aimed at improving their quality of life and ensuring the elderly population’s right to the city (Camarano, 2002).
The quality of life for older adults is directly related to the environment in which they live and the way they get around (Prado and Lich, 2004). In this context, urban mobility plays an essential role, as it requires infrastructure suited to their needs, ensuring their access to the goods and services offered by the city. Older adults need environments that support the functional and social changes resulting from aging. Since this is a continuous process throughout life, a city that promotes the inclusion of older adults becomes, in fact, a city for all ages, as it accommodates individuals with different levels of functional ability – and not just older adults.
The mobility of the older population is influenced by a multitude of factors, so that simply providing free public transportation is not enough to encourage their movement in urban spaces. It is essential that cities adapt to the process of population aging, which involves interventions in urban infrastructure, architectural adaptations, improvements in transportation systems, and actions aimed at raising awareness and educating society (Marè, Sobrinho, and Malatesta, 2024). Durand and Zijlstra (2023) report that the mere existence of public transportation or sustainable mobility options does not guarantee that older adults will use them.
It is important to highlight that the Demographic Census conducted by the IBGE constitutes the primary source of information on the Brazilian population, covering fundamental data such as age, sex, color or race, educational attainment, among other socioeconomic and demographic aspects. In addition to characterizing individuals, the Census also plays an essential role in analyzing the urban environment through the Urban Survey of the Household Surroundings. This survey provides a detailed assessment of the urban infrastructure conditions immediately surrounding the residence, recording information on sidewalks, pavement, accessibility ramps, street lighting, tree coverage, the presence of storm drains, public facilities, and other elements that shape daily life in cities.
By gathering data on topics such as accessibility, circulation, the environment, and infrastructure, the Surroundings Survey allows for the creation of a comprehensive urban portrait of the streets, avenues, alleys, and lanes that make up the Brazilian urban fabric, highlighting territorial inequalities and structural deficiencies. This data is particularly relevant in a context of intense demographic changes, marked by the accelerated aging of the population.
The state of Rio Grande do Sul stands out in this process. According to the most recent data from the 2022 Census (IBGE, 2023b), Rio Grande do Sul has the highest aging index in the country, with a value of 115. This means that, for the first time, there are more people aged 60 or older than children and adolescents up to 14 years old in the state. This age reversal underscores the urgency of public policies aimed at adapting urban spaces to the needs of the elderly population.
In this context, this study analyzes data from the Urban Survey of the Household Surroundings, specifically in the state of Rio Grande do Sul, with the aim of identifying trends, patterns, and gaps in urban infrastructure that impact the lives of older adults. The research seeks to reveal how the city has been structured (or has failed to structure itself) to guarantee the right to mobility, accessibility, and safe presence of the elderly population in public spaces.
By integrating demographic data and urban indicators, this study aims to inform the formulation of public policies that incorporate population aging as a strategic axis in urban and regional planning. Such proposals must be aligned with the National Policy on Older Adults, Law n. 8,842/1994 (Brazil, 1994), the Statute of Older Adults, Law n. 10,741/2003 (Brazil, 2003), and the Sustainable Development Goals (SDGs), particularly SDG 11, which aims to make cities and human settlements inclusive, safe, resilient, and sustainable.
A portrait of an aging population
The IBGE conducts population censuses every ten years. Due to the Covid-19 pandemic, the census was not conducted in 2020 and was postponed by two years. The Population Census is the primary source of information on the living conditions of the population in all municipalities across the country, as well as in their internal territorial subdivisions.
One of the main findings of the 2022 Demographic Census was the aging trend of the Brazilian population. In Brazil, the Statute of the Elderly defines an elderly person as someone aged 60 or older. For demographic analyses, however, the IBGE uses a cutoff of 65 years of age or older to maintain international comparability and consistency with other studies that use the same age group.
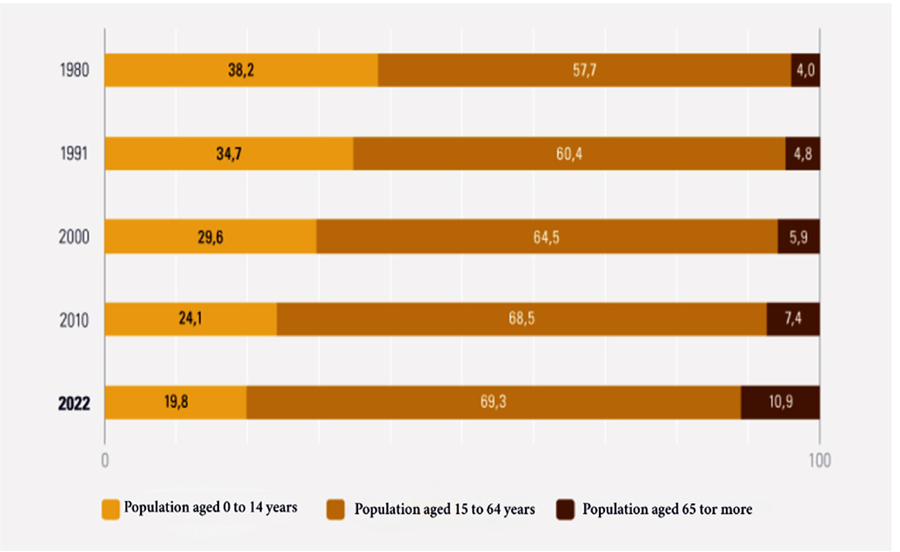
The results of the Brazilian population broken down by age and sex from the Demographic Census show that, in 2022, the total number of people aged 65 or older in Brazil reached 10.9% of the population (22,169,101 inhabitants), representing a 57.4% increase compared to 2010, when there were 14,081,477 inhabitants in this age group, equivalent to 7.4% of the population (IBGE, 2023b).
The aging of the Brazilian population becomes even more evident when the time frame of the analysis is expanded. Figure 1 illustrates the proportion of the resident population in Brazil by specific age groups between 1980 and 2022. In 1980, only 4.0% of the Brazilian population was 65 years of age or older. At the other end of the age pyramid, the percentage of children up to 14 years of age fell from 38.2% in 1980 to 19.8% in 2022.
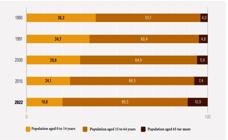
– Percentage of the resident population in Brazil, by specific age groups, from 1980 to 2022
An analysis of the proportions of specific age groups across Brazil’s major regions reveals that the North is the youngest region in the country, with 25.2% of its population aged 14 or younger, followed by the Northeast, with 21.1%. On the other hand, the South and Southeast regions have the most aged populations, with 18.2% and 18.0% of young people aged 0 to 14, as well as the highest proportions of people aged 65 or older (12.1% and 12.2%, respectively). The Central-West region, however, has an intermediate age structure, with a distribution close to the national average.
These data show that the aging of the Brazilian population initially occurred in the South and Southeast regions, driven by the decline in fertility rates. Although the North and Northeast regions have also experienced a decline in fertility over the past few years, they remain proportionally younger regions (Faria and Spode, 2024).
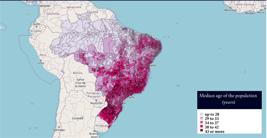
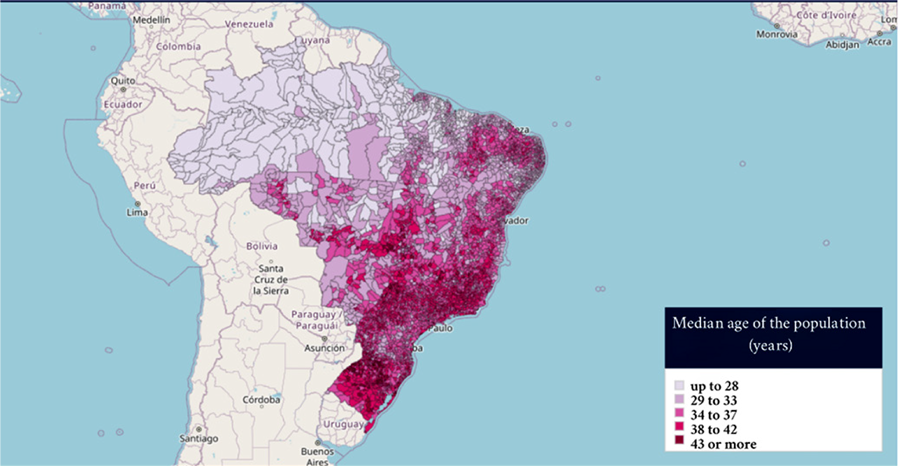
Another indicator used to assess the aging of a population is the median age, that is, the age that divides the population into the younger 50% and the older 50%. In Brazil, between 2010 and 2022, the median age rose from 29 to 35 years. Rio Grande do Sul was the state with the highest median age in 2022, at 38 years. Factors such as low fertility rates, coupled with increased life expectancy and the migration of young people to other states, are the main drivers of this trend.
The aging index is calculated as the ratio of the group of people aged 65 and older to the population of young people up to 14 years old. In other words, the higher this index, the older the population. In Brazil, the index rose from 30.7 in 2010 to 55.2 in 2022, indicating that there are at least 55 people aged 65 or older for every child aged 0 to 14.
In less populous municipalities, with up to 5,000 inhabitants, a higher average aging index was found, with a ratio of 76.2 people aged 65 or older for every 100 people aged 14 or younger. In contrast, the most populous municipalities, with over 500,000 inhabitants, have the second-highest aging index, with 63.9 people aged 65 or older for every 100 individuals aged 0 to 14.
Based on the picture revealed by the 2022 Census, a trend of gradual reduction in the aging index was identified among municipalities with up to 5,000 inhabitants, extending to the range of 50,001 to 100,000 inhabitants. Above this threshold, the figures increase in line with population size. This trend can be explained by the migration of people of working age to larger cities in search of employment, education, and services. This migration is predominantly driven by people of reproductive age, resulting in fewer children and births in the smaller cities of origin.
Brazil's most aging state
The phenomenon of population aging in Brazil, clearly evidenced by the updated data from the 2022 Demographic Census, does not occur uniformly across the entire country. Certain states, such as Rio Grande do Sul, have experienced this process earlier, reflecting their own unique and historical demographic dynamics that precede the national average. Proportionally, Rio Grande do Sul is currently the state with the oldest population in the country, with 115 elderly people for every 100 children aged 0 to 14, a clear indication of structural change in the regional age pyramid.
This pattern of accelerated aging is not restricted to isolated areas within the state. On the contrary, it is widespread: of the 20 Brazilian municipalities with the highest percentages of elderly residents, 19 are located in Rio Grande do Sul. Furthermore, the state accounts for nine of the country’s ten highest aging indices, revealing that the high proportion of elderly residents is deeply rooted in most of its municipalities.
Complementary indicators reinforce this reality. The median age – which represents the point at which half the population is younger and the other half older – reached 38 years in Rio Grande do Sul, the highest among all states, surpassing even Rio de Janeiro, which ranks second at 37 years. At the municipal level, the state stands out once again: nine of the ten highest median ages in Brazil were recorded in municipalities in Rio Grande do Sul, highlighting an advanced and consolidated demographic transition. This trend can be seen in Figure 2.
Another notable figure is the aging index, calculated as the ratio of the population aged 65 and over to that aged 0 to 14. In 2022, Rio Grande do Sul had the highest value in the country, with an index of 80.4, meaning there are at least 80 older adults aged 65 and over for every 100 children and adolescents. This represents a significant increase compared to 2010, when that figure was 54.4, highlighting the rapid pace of demographic change.
The age group of 65 and older now accounts for 14.1% of the state’s total population – also the highest percentage in Brazil – up from 9.3% in 2010. This increase of nearly 5 percentage points in just a decade highlights not only the speed of aging in Rio Grande do Sul but also the urgency of rethinking public policies and urban structures, especially in the fields of health, mobility, housing, and safety, to adequately meet the demands of this expanding population segment.
Given this scenario, it is imperative that public officials, researchers, and regional planners consider aging as a structural variable in the formulation of urban and regional development strategies. The density and extent of aging in Rio Grande do Sul make it a prime testing ground for the development of innovative policies aimed at active, healthy, and dignified aging.
Urban survey of the surrounding areas of the municipalities
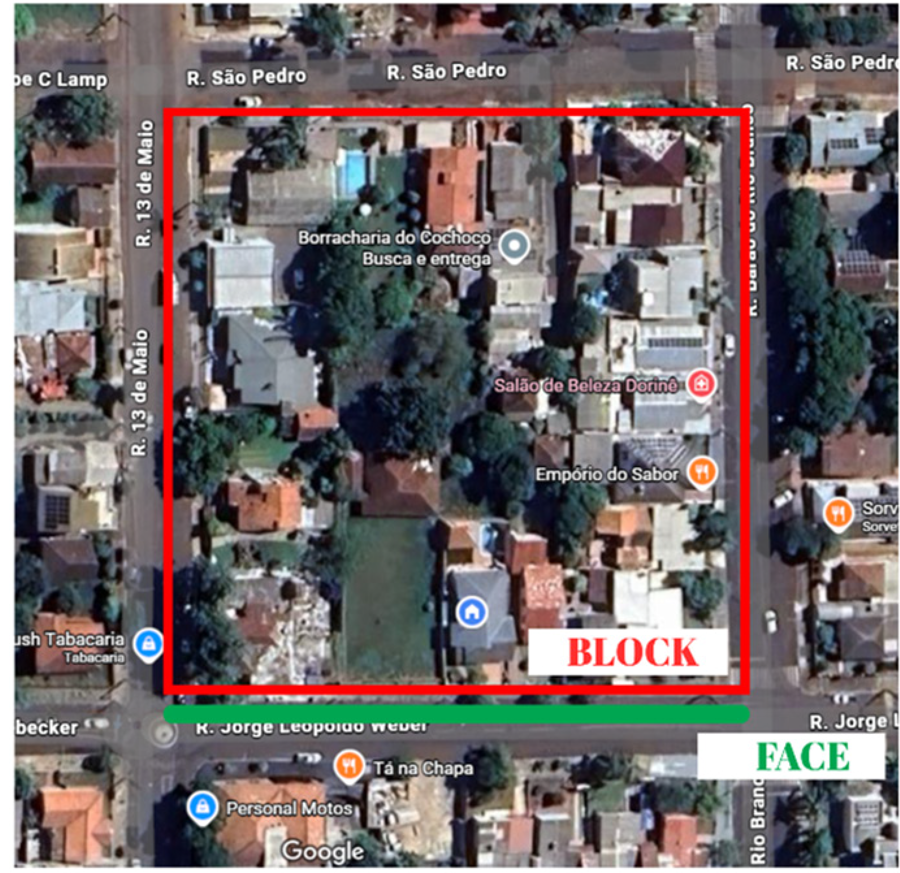
Prior to conducting the Census, the IBGE carries out the Urban Survey of the Household Surroundings, with the aim of providing an overview of the country’s urban infrastructure, assessing issues such as universal accessibility, vehicle traffic, public facilities, and the environment. To understand how the survey is conducted, it is necessary to understand two essential concepts: block and face (Figure 3).
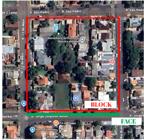
A block is a generally well-defined rectangular section of an urban area or rural settlement, bounded by streets and/or roads. However, a block may be irregular in shape and bounded by features such as railroads, waterways, or hillsides. In some places, a block is referred to as a “quarteirão.” A “face,” on the other hand, is each of the sides of the block, whether or not it contains buildings (IBGE, 2025d).
Unlike IBGE household surveys, such as the Demographic Census and the National Household Sample Survey (PNADc), in the Surroundings Survey there is no contact between the interviewer and residents. IBGE agents conduct a survey based on observations, on all sides of urban blocks across the country, of parameters related to road conditions, tree coverage, the presence of bike lanes, sidewalks, street lighting, drainage systems, and accessibility.
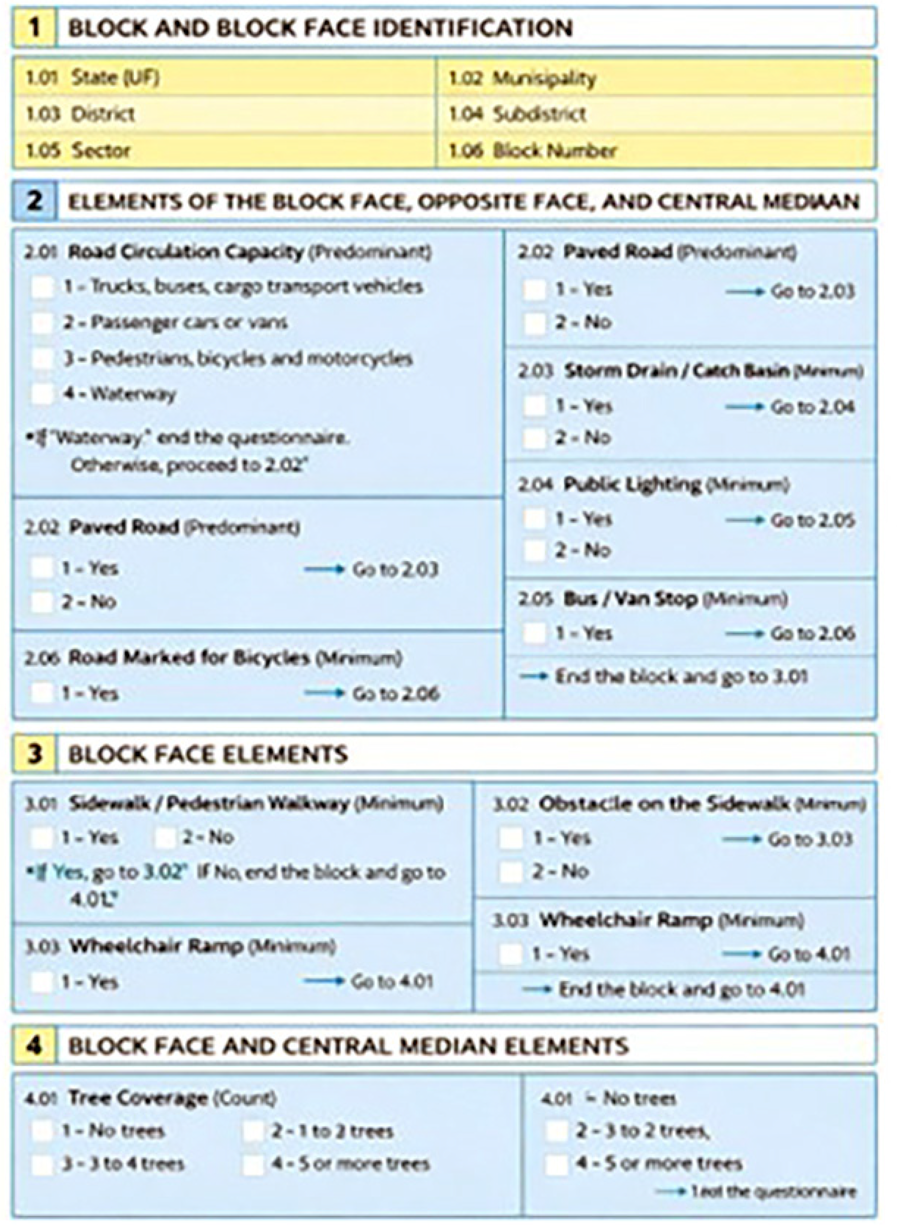
The survey was first conducted during the pre-collection phase of the 2010 Census, covering ten questions. In 2022, the IBGE administered it again as part of the Census, once more covering ten questions, four of which were comparable to those from 2010. Figure 4 presents the questionnaire used in the Urban Survey of the Household Surroundings in the 2022 Census.
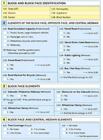
In this study, questions related to universal accessibility – such as the presence of bus stops, sidewalks, ramps for wheelchair users, and obstacles on sidewalks – are evaluated based on the results of the Urban Survey of the Household Surroundings.
Study methodology and procedures
Two distinct population strata are used as the study population. Stratum 1 comprises the ten municipalities with the highest percentage of elderly residents in Brazil, all located in the state of Rio Grande do Sul, and Stratum 2 comprises the ten most populous municipalities in the state – both listed in Tables 1 and 2. For these municipalities, the results of the 2010 and 2022 Urban Surveys of Municipal Surroundings were analyzed to assess, albeit indirectly, the evolution of public policy implementation in areas such as accessibility and urban mobility. It should be noted that the selection of strata is restrictive, which does not allow for generalizations regarding the state of Rio Grande do Sul as a whole.
In addition to the fact that the ten municipalities with the highest percentage of elderly population in Brazil are located in Rio Grande do Sul, it is also noteworthy that all of them are very sparsely populated municipalities, with fewer than 3,000 inhabitants. The municipality with the oldest population in Brazil is Coqueiro Baixo, located in the Serra Gaúcha region, where nearly one-third of the population is 65 years of age or older. It is also the municipality with the highest population aging index, at 277.14, and the highest median age, at 53.
Among the ten most populous municipalities in Rio Grande do Sul, the percentage of the elderly population is significantly lower. Even so, these figures are above the national average, which stands at 10.9%.
Results and discussion
An analysis of data from the Urban Survey of the Household Surroundings, conducted as part of the 2022 Demographic Census, points to significant improvements in urban accessibility in various locations across the country. The results indicate that, compared to previous surveys, there has been a gradual improvement in urban infrastructure focused on the surroundings of households, particularly regarding the presence of sidewalks, accessibility ramps, street lighting, and public urban facilities. These advances reflect local and national efforts to improve the urban environment, making it more inclusive and adapted to the diversity of the population – with a focus on older adults, people with disabilities, and other groups historically marginalized by mobility and urban planning policies.
On the other hand, while the analysis of the Neighborhood Survey confirms a positive trend toward more accessible cities, it also highlights the challenges that still exist in achieving universal access to safe, autonomous, and equitable urban mobility.
Existence of a sidewalk
The presence of sidewalks is crucial for ensuring the safety and comfort of pedestrians, making urban spaces more inclusive and universally accessible. Furthermore, it is essential for promoting the health and quality of life of the population, as well as enabling the development of more sustainable modes of transportation. When conditions for pedestrian mobility are adequately ensured, individuals tend to appropriate urban spaces, which contributes to the intensification of collective experience and the strengthening of social dynamics in the urbanized environment (Shimizu et al., 2022). In this context, sidewalks must perform functions that transcend the mere provision of space for circulation, also serving as interfaces that promote citizens’ interaction with the social conditions and the urban environment around them (Gehl, 2014).
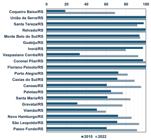
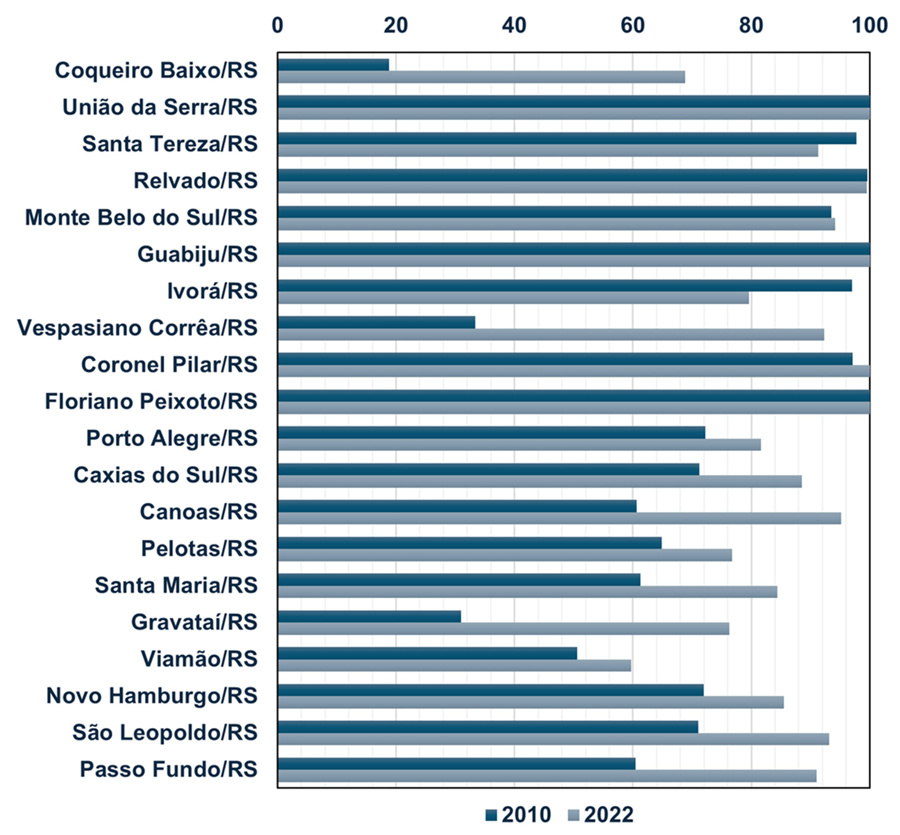
Table 3 presents the percentage of the resident population according to the sidewalk criterion in Stratum 1.
When assessing the presence of sidewalks for Stratum 1, it was found that most municipalities have a high percentage of the population living on streets with sidewalks. Notable among these are the municipalities of União da Serra, Guabiju, and Floriano Peixoto, which maintained 100% sidewalk coverage. Also worthy of note are the municipalities of Coqueiro Baixo and Vespasiano Corrêa, which showed significant progress in the presence of sidewalks. Relvado, Monte Belo do Sul, and Coronel Pilar maintained stability at high levels. Finally, Santa Tereza and Ivorá showed considerable declines in the indicators, which may indicate infrastructure degradation or urban expansion not accompanied by sidewalk construction.
The presence of well-constructed and maintained sidewalks is essential for the safe and independent mobility of the elderly population. Municipalities that have significantly expanded their urban sidewalk infrastructure – such as Coqueiro Baixo and Vespasiano Corrêa – have taken an important step toward accessibility, which can promote active aging and reduce social isolation. The decline in the indicator in municipalities such as Ivorá and Santa Tereza warrants attention, as it may indicate unplanned urban growth or neglect of existing infrastructure, negatively impacting quality of life.
Table 4 presents the percentages of the resident population with access to sidewalks or public walkways in Stratum 2, comparing data from 2010 and 2022. The analysis shows a general positive trend, with significant improvements in urban infrastructure in these areas, although territorial inequalities and major accessibility challenges persist.
All municipalities showed an improvement in the percentage of the population with access to sidewalks, which highlights efforts to expand urban infrastructure. Gravataí stands out as the municipality that has made the most progress in percentage terms, rising from just 31% of the population covered to over 76%. Canoas, São Leopoldo, and Passo Fundo recorded increases of over 30%, indicating effective public policies on urbanization and accessibility. Viamão continues to have the lowest percentage of sidewalk coverage in 2022 (59.75%), being the only municipality in the sample not to exceed the 60% mark. This reveals deficient urban infrastructure, directly impacting the population’s quality of life.
Figure 5 shows the percentage of the resident population by sidewalk availability for both strata.
Wheelchair ramp
Ramps for wheelchair users are essential for urban accessibility. The Accessibility Act, Law n. 10,098/2000, provides in Article 3 that:
[...] the planning and development of public roads, parks, and other public spaces must be designed and implemented in such a way as to make them accessible to everyone, including people with disabilities or limited mobility. (Brazil, 2000)
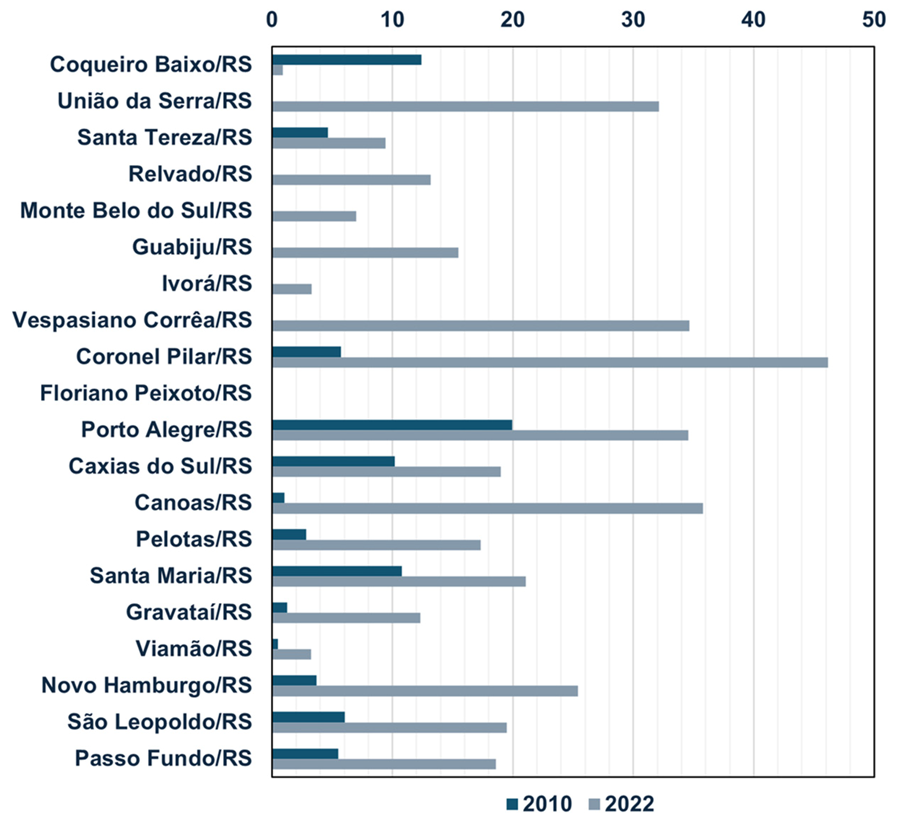
Table 5 shows the percentage of the resident population in Stratum 1 with access to wheelchair ramps, comparing data from the 2010 and 2022 censuses. Ramps are a key indicator of universal accessibility and reflect municipalities’ commitment to inclusive mobility, especially for people with disabilities and older adults with limited mobility.
Coronel Pilar saw the greatest improvement: from 5.75% (2010) to 46.19% (2022). Although it has not yet reached the point where half of the urban population has access to ramps, this growth represents a clear investment in accessibility. Vespasiano Corrêa (34.67%) and União da Serra (32.11%) also have rates above 30%, indicating some degree of urban planning focused on inclusion. Relvado and Guabiju are in the 13% to 15% range, a modest result, but above the average for municipalities in Stratum 1.
Coqueiro Baixo shows a decline, with the percentage falling from 12.41% to just 0.92%, while the “undeclared” percentage rose to 31.19%, which compromises the interpretation and may indicate weaknesses in data collection or a loss of infrastructure. Ivorá has the lowest rate of reported ramps (3.29%) and a very high “undeclared” percentage (84.38%), which prevents a reliable assessment and may conceal a situation of severe exclusion. Floriano Peixoto simply reports no ramps at all and has an 80.87% “undeclared” rate, suggesting a lack of effective data collection or minimal infrastructure.
Table 6 presents the percentage of the resident population in Stratum 2 (generally peripheral and less developed neighborhoods) of ten major municipalities in Rio Grande do Sul, regarding the existence of ramps for wheelchair users between 2010 and 2022, while Figure 6 illustrates the data for the two strata of the study.
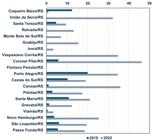
Canoas saw the biggest increase, rising from virtually no coverage (1.05%) to 35.78% of the population having access to ramps in 2022 – a remarkable improvement over the past decade. Porto Alegre, the state capital, leads in absolute terms (34.58%) and shows consistent progress. Novo Hamburgo, Passo Fundo, São Leopoldo, and Pelotas also saw significant growth, reflecting investments in urban infrastructure focused on inclusion.
Viamão continues to have the lowest ramp coverage in Stratum 2 (3.24%), despite showing slight growth. This represents a serious accessibility deficit in the municipality’s most vulnerable areas. Gravataí and Pelotas, despite their progress, still have very low rates, which compromises the mobility of people with disabilities and the elderly in outlying areas. The percentage of “undeclared” cases increased significantly in some municipalities, such as Pelotas, Viamão, and Gravataí, which may indicate weaknesses in data collection or urban areas that have not been fully mapped.
Bus/van stop
Limited access to bus stops directly compromises the urban mobility of the elderly population, restricting their ability to travel to health care facilities, community centers, and public spaces. Thus, poor public transportation coverage in these areas can exacerbate socio-spatial inequalities and undermine the functional autonomy of older adults, in addition to increasing their dependence on family or institutional care.
Table 7 presents the percentage of the resident population with access to bus stops or vans in Stratum 1.
The analysis reveals a severe lack of basic public transportation infrastructure. União da Serra stands out negatively, with 100% of the population lacking access to bus or van stops – the worst-case scenario. Ivorá and Santa Tereza also have minimal coverage (less than 1.1%), suggesting a virtually nonexistent transportation infrastructure. Vespasiano Corrêa, although it has the best index in the group, still reports that more than 80% of the population lives without access to bus or van stops. None of the municipalities reaches even 20% coverage, reflecting a critical and widespread lack of formal public transportation.
Table 8 presents the percentage of the resident population with access to bus or van stops in Stratum 2.
Presence of obstacles on sidewalks
People with limited mobility – including pregnant women, nursing mothers, individuals carrying small children, older adults, people with disabilities, and those who are obese – tend to limit their movement outside the home due to the mobility challenges they face. In this context, Twardzik et al. (2021) highlight that the social participation of these groups can be further compromised by inadequate conditions of public sidewalks, which represent physical and symbolic barriers to urban inclusion.
Furthermore, the quality of the urban environment, as well as walkability conditions to public transportation stops and for daily walking trips, directly impact the physical and mental health of individuals and communities. These factors are fundamental to promoting and sustaining active and healthy aging (Bonatto and Alves, 2022).
Countries such as the United Kingdom and the Netherlands adopt methodologies that go beyond assessing the physical presence of sidewalks, incorporating an analysis of functional quality and suitability for the profiles of users who use them. In the United Kingdom, the Department for Transport has established accessibility standards with an explicit focus on older adults with reduced mobility or physical disabilities. Additionally, the British audit system analyzes various types of pedestrian environments (sidewalks, crossings, public transit waiting areas, among others), evaluating, from a quantitative standpoint, their physical conformance to national standards and, from a qualitative standpoint, through the evaluator’s perspective, personal safety and the quality of the environment, providing a broader understanding of local conditions (Department for Transport, 2021; Transport for London, 2020).
The Netherlands has also made progress toward this more comprehensive perspective on accessibility, moving beyond an infrastructure-centered approach to an assessment that considers all modes of transport and the diverse needs of users. The country seeks to integrate accessibility indicators in a multimodal manner in order to understand the level of accessibility desirable for different users of the system and to create an integrated national policy. To this end, the Dutch government analyzes which objectives and indicators are most appropriate for defining a minimum standard of accessibility for essential social and economic services (OECD, 2024).
The presence of obstacles on sidewalks represents a direct physical barrier to independent mobility, especially for older adults, who make up a growing portion of the population in the major urban centers of Rio Grande do Sul. Risks of falls, fractures, and social isolation increase significantly in areas with uneven, narrow, or obstructed sidewalks. In municipalities such as Passo Fundo, Canoas, and Santa Maria, where population aging is also significant, this situation compromises not only quality of life but also access to basic services such as healthcare, recreation, and social assistance.
Table 9 presents the percentage of the resident population in Stratum 1 according to the presence of obstacles on sidewalks – a fundamental element for urban mobility, especially for the elderly and people with disabilities. The data reveal serious deficiencies in accessibility and circulation in these areas.
Coronel Pilar presents the worst scenario: 96.45% of the population lives in areas where there are obstacles on the sidewalks, with only 2% reporting no obstacles. This indicates virtually no adequate conditions for basic urban mobility. Monte Belo do Sul, Santa Tereza, Coqueiro Baixo, and Vespasiano Corrêa also face an extremely high incidence of physical barriers, with over 60% of the urban population affected. Relvado is one of the few municipalities where a majority of the urban population reports no obstacles (52.51%), making it a positive standout. Floriano Peixoto and Ivorá show very low percentages of obstacles (18.45% and 4.66%, respectively), but have extremely high non-response rates (over 80%). This compromises the reliability of the analysis in these cases and may indicate gaps in data collection or difficulties in accessing information in the field.
Obstacles on sidewalks, such as potholes, steps, poorly positioned poles, uneven surfaces, and the lack of tactile paving, are severe barriers to the mobility of the elderly population. In municipalities with high aging rates, these obstacles pose risks of falls, social isolation, and difficulty accessing essential services, such as healthcare and social assistance. Thus, active and autonomous mobility, crucial for healthy aging, is seriously compromised in these locations.
Table 10 presents the percentages of the resident population in Stratum 2 regarding the presence of obstacles on sidewalks, based on data from the 2022 Census.
Passo Fundo/RS leads, with 64.35% of the population living in areas with sidewalk obstacles in Stratum 2, indicating a serious structural deficiency in pedestrian pathways in outlying regions. Canoas, Santa Maria, Caxias do Sul, São Leopoldo, and Gravataí also have more than half of their populations in critical situations, with obstacles that hinder daily mobility. Viamão stands out for another reason: although 49.53% of its population reports obstacles, it has an extremely high “undeclared” rate (40.25%), which may indicate gaps in data collection or in areas with limited access. Porto Alegre is the only municipality on the list with less than 40% of the population affected by sidewalk obstacles, in addition to having the highest percentage of obstacle-free sidewalks (46.56%) – which suggests more established urban policies, though still insufficient.
Final remarks
Aging is often associated with increased vulnerability to conditions that partially or completely compromise the functional autonomy, physical and emotional vitality, and social integration of the elderly population. This situation tends to be accompanied by a rise in demand for essential public services, particularly those related to health care, social assistance, and urban mobility. Given this situation, it is essential to restructure and/or adapt transportation systems to ensure the right to the city, as established by the Statute of the Elderly (Law No. 10,741/2003) and the National Urban Mobility Policy (Law No. 12,587/2012), which recognize transportation as a social right and a central element of civic inclusion (Brazil, 2003; Brazil, 2012).
In this regard, the importance and urgency of interdisciplinary studies that contribute to the planning and implementation of public policies aimed at promoting quality of life in old age are highlighted, incorporating principles of universal accessibility, safe and equitable mobility, and inclusive urban design. These guidelines are also consistent with the commitments made by Brazil under the UN 2030 Agenda, especially regarding the SDGs, particularly SDG 3 (Good Health and Well-being) and SDG 11 (Sustainable Cities and Communities).
The elderly population tends to rely more on public transportation to access health, leisure, and social assistance services. The lack of public transportation infrastructure can increase the risk of social isolation, loss of autonomy, and inequality in access to basic rights. In this context, Singapore has adopted an integrated policy for the elderly population. Since 2014, through the country’s transport authority, “silver zones” have been designated in neighborhoods with a high proportion of elderly residents and a history of pedestrian accidents, resulting in an approximately 80% reduction in the number of accidents involving the elderly in these areas. In these zones, various measures are implemented based on risk criteria and proximity to essential services, with specific regulations regarding enforcement and penalties. Some features provided for the most vulnerable population include: reduced speed limits, traffic calming devices (S-shaped streets, lane narrowing, central rest islands, and raised crosswalks), and greater assistance at crossings with prominent signage and longer signal phases (LTA, 2022).
Regarding sidewalks, it is essential to continuously monitor the quality of sidewalks, in addition to their physical existence, using criteria of accessibility, safety, and maintenance. Furthermore, it is necessary to investigate the reasons for the reduction in coverage in municipalities such as Ivorá/RS and Santa Tereza/RS, based on local assessments and georeferencing. Furthermore, sidewalks should be included as a priority in master plans and urban mobility plans, with special attention to areas with a higher proportion of older adults.
The presence of obstacles on sidewalks, such as potholes, steps, poorly positioned poles, uneven surfaces, and the lack of tactile paving, are severe barriers to the mobility of older adults. In municipalities with high aging rates – as is the case with several of the municipalities evaluated – these obstacles pose risks of falls, social isolation, and difficulty accessing essential services, such as healthcare and social assistance. Thus, active and autonomous mobility, which is crucial for healthy aging, is seriously compromised in these locations.
In addition, ramps are essential infrastructure for ensuring access to sidewalks, public buildings, commercial areas, and service areas, especially for older adults with reduced mobility, people in wheelchairs, and walker users. The absence or scarcity of these structures limits autonomy, increases the risk of accidents, and excludes citizens from the full use of public spaces. Municipalities with rates below 10% fall far short of minimum accessibility standards, and this constitutes a violation of the Brazilian Law on the Inclusion of Persons with Disabilities – Law n. 13,146/2015 (Brazil, 2015).
Given this scenario, the study reinforces the urgent need to formulate and implement intersectoral public policies that incorporate the issue of population aging as a structural component of urban and regional planning. Such policies must be guided by the principles of territorial equity, universal accessibility, and the right to the city, in order to ensure inclusive, resilient, and socially sustainable urban environments.
References
-
BRASIL (1994). Lei n. 8.842, de 4 de janeiro. Dispõe sobre a Política Nacional do Idoso, cria o Conselho Nacional do Idoso e dá outras providências. Diário Oficial da União, Brasília, DF, 5 jan. Disponível em: https://www.planalto.gov.br/ccivil_03/leis/l8842.htm Acesso em: 17 jun 2025.
» https://www.planalto.gov.br/ccivil_03/leis/l8842.htm -
BRASIL (1994) (2003). Lei n. 10.741, de 1º de outubro. Dispõe sobre o Estatuto do Idoso e dá outras providências. Diário Oficial da União, Brasília, DF, 3 out. Disponível em: https://www.planalto.gov.br/ccivil_03/leis/2003/l10.741.htm Acesso em: 20 jun 2025.
» https://www.planalto.gov.br/ccivil_03/leis/2003/l10.741.htm -
BRASIL (1994) (2012). Lei n. 12.587, de 3 de janeiro. Institui as diretrizes da Política Nacional de Mobilidade Urbana. Diário Oficial da União, Brasília, DF, 4 jan. Disponível em: https://www.planalto.gov.br/ccivil_03/_ato2011-2014/2012/lei/l12587.htm Acesso em: jun 2025.
» https://www.planalto.gov.br/ccivil_03/_ato2011-2014/2012/lei/l12587.htm -
BRASIL (1994) (2015). Lei n. 13.146, de 6 de julho. Institui a Lei Brasileira de Inclusão da Pessoa com Deficiência (Estatuto da Pessoa com Deficiência). Diário Oficial da União, Brasília, DF, 7 jul. Disponível em: https://www.planalto.gov.br/ccivil_03/_ato2015-2018/2015/lei/l13146.htm Acesso em: 26 jun 2025.
» https://www.planalto.gov.br/ccivil_03/_ato2015-2018/2015/lei/l13146.htm - BONATTO, D. A. M.; ALVES, F. B. (2022). Application of walkability index for older adults' health in the brazilian context: the case of Vitória-ES, Brazil. International Journal of Environmental Research and Public Health, v. 19, n. 3, pp. 1-25.
-
CAMARANO, A. A. (2002). Envelhecimento da população brasileira: uma contribuição demográfica Rio de Janeiro, Ipea. (Texto para Discussão n. 858). Disponível em: https://portalantigo.ipea.gov.br/agencia/images/stories/PDFs/TDs/td_0858.pdf Acesso em: 20 maio 2025.
» https://portalantigo.ipea.gov.br/agencia/images/stories/PDFs/TDs/td_0858.pdf - CASTIGLIONI, A .H. (2006). A revolução grisalha. Revista Fluminense de Geografia, v. 2, n. 4.
-
DEPARTMENT FOR TRANSPORT (UK) (2021). I nclusive mobility: a guide to best practice on access to pedestrian and transport infrastructure. London, Department for Transport. Disponível em: https://www.gov.uk/government/publications/inclusive-mobility Acesso em: 13 nov 2025.
» https://www.gov.uk/government/publications/inclusive-mobility -
DURAND, A.; ZIJLSTRA, T. (2023), Public transport as travel alternative for users of Special Transport Services in the Netherlands. Journal of Transport & Health, v. 29, 101568, DOI: 10.1016/j.jth.2023.101568. Disponível em: https://www.sciencedirect.com/science/article/pii/S221414052300004X?via%3Dihub Acesso em: 13 nov 2025.
» https://doi.org/10.1016/j.jth.2023.101568» https://www.sciencedirect.com/science/article/pii/S221414052300004X?via%3Dihub - FARIA, R; SPODE, P. (2024). O envelhecimento populacional brasileiro sob uma perspectiva regional e urbana. Geousp, v. 28, n. 3, e221106.
- GEHL, J. (2014). La humanización del espacio urbano: la vida social entre los edificios Barcelona, Reverté.
-
IBGE - Instituto Brasileiro de Geografia e Estatística (2018). Projeções da população. Disponível em: https://sidra.ibge.gov.br/pesquisa/projecao-da-populacao/tabelas Acesso em: 26 jun 2025.
» https://sidra.ibge.gov.br/pesquisa/projecao-da-populacao/tabelas -
IBGE - Instituto Brasileiro de Geografia e Estatística (2022). Questionários. Disponível em: https://anda.ibge.gov.br/sobre/questionarios.html Acesso em: 14 jun 2025.
» https://anda.ibge.gov.br/sobre/questionarios.html -
IBGE - Instituto Brasileiro de Geografia e Estatística (2023a). Censo Demográfico 2022. Disponível em: https://sidra.ibge.gov.br/pesquisa/censo-demografico/demografico-2022/inicial Acesso em: 10 jun 2025.
» https://sidra.ibge.gov.br/pesquisa/censo-demografico/demografico-2022/inicial -
IBGE - Instituto Brasileiro de Geografia e Estatística (2023b) Censo Demográfico: população por idade e sexo - resultados do universo. Disponível em: https://sidra.ibge.gov.br/pesquisa/censo-demografico/demografico-2022/universo-populacao-por-idade-e-sexo Acesso em: 10 jun 2025.
» https://sidra.ibge.gov.br/pesquisa/censo-demografico/demografico-2022/universo-populacao-por-idade-e-sexo -
IBGE - Instituto Brasileiro de Geografia e Estatística (2025a) Censo Demográfico: Tabela 4709 - População residente, variação absoluta de população residente e taxa de crescimento geométrico. Disponível em: https://sidra.ibge.gov.br/tabela/4709 Acesso em: jun 2025.
» https://sidra.ibge.gov.br/tabela/4709 -
IBGE - Instituto Brasileiro de Geografia e Estatística (2025b). Censo Demográfico 2022: Tabela 6591 - Moradores em domicílios particulares permanentes ocupados, em setores censitários selecionados para a Pesquisa Urbanística do Entorno dos Domicílios, por sexo, grupos de idade e existência e características do entorno. Disponível em: https://sidra.ibge.gov.br/tabela/6591 Acesso em: jun 2025.
» https://sidra.ibge.gov.br/tabela/6591 -
IBGE - Instituto Brasileiro de Geografia e Estatística (2025c). Censo Demográfico 2022: panorama. Disponível em: https://censo2022.ibge.gov.br/panorama/index.html Acesso em: 23 jun 2025.
» https://censo2022.ibge.gov.br/panorama/index.html -
IBGE - Instituto Brasileiro de Geografia e Estatística (2025d). Censo Demográfico 2022: características urbanísticas do entorno dos domicílios / IBGE. Disponível em: https://biblioteca.ibge.gov.br/index.php/biblioteca-catalogo?view=detalhes&id=2102168 Acesso em: 10 nov 2025.
» https://biblioteca.ibge.gov.br/index.php/biblioteca-catalogo?view=detalhes&id=2102168 -
LTA - Land Transport Authority (2022). Seniors First: 7 things that make Silver Zones road safety havens. Singapore, Land Transport Authority. Disponível em: https://www.lta.gov.sg/content/ltagov/en/who_we_are/statistics_and_publications/Connect/silverzones.html Acesso em: nov 2025.
» https://www.lta.gov.sg/content/ltagov/en/who_we_are/statistics_and_publications/Connect/silverzones.html - MARÈ, R.; SOBRINHO, O. G.; MALATESTA, M. E. B. (2024). Efetividade do transporte público gratuito para inclusão de pessoas idosas (São Paulo). Cadernos Metrópole. São Paulo, v. 26, n. 60, pp. 707-726.
- MATOS, B. A.; LOBO, C.; RIBEIRO, A. H. N.; MONTERO, C. A.; GUEDES, J. V. P. (2024). Fluxos e padrões de deslocamento de idosos no sistema de transporte coletivo da Região Metropolitana de Belo Horizonte (MG). Oculum Ensaios. Campinas, v. 21, e2411531.
- MENDES, T. A. B.; VALSECCHI, V. L. A. (2007). Armadilhas do espaço urbano. Revista Einstein, v. 5, n. 2, pp. 99-104.
-
OECD - Organisation for Economic Co-operation and Development (2024). Sustainable accessibility for all Paris, OECD. Disponível em: https://www.oecd.org/content/dam/oecd/en/publications/reports/2024/06/sustainable-accessibility-for-all_508c25df/5c91857c-en.pdf Acesso em: 13 nov 2025.
» https://www.oecd.org/content/dam/oecd/en/publications/reports/2024/06/sustainable-accessibility-for-all_508c25df/5c91857c-en.pdf - PRADO, A. R. A.; LICHT, F. B. (2004). Idosos, cidade e moradia: acolhimento ou confinamento? A Terceira Idade. São Paulo, v. 15, n. 29, pp. 80-91.
- SHIMIZU, Y.; OSAKI, S.; HASHIMOTO, T.; KARASAWA, K. (2022). Social acceptance of smart city projects: focus on the sidewalk Toronto case. Frontiers in Environmental Science. Lausanne, v. 10, n. 898922, pp. 1-4.
- SILVA, C.; PINTO, N.; BERTOLLINI, L. (2019). Designing accessibility instruments Londres, Routledge.
- STRAATEMEIER, T.; BERTOLINI, L. (2020). How can planning for accessibility lead to more integrated transport and land-use strategies? Two examples from the Netherlands. European Planning Studies. Abingdon, v. 28, n. 9, pp. 1713-1734.
-
TRANSPORT FOR LONDON (2020). Pedestrian Environment Review System (PERS): factsheet. London, Transport for London. Disponível em: https://content.tfl.gov.uk/pedestrian-environment-review-system-factsheet.pdf Acesso em: 13 nov 2025.
» https://content.tfl.gov.uk/pedestrian-environment-review-system-factsheet.pdf - TWARDZIK, E.; CLARKE, P.; JUDD, S.; COLABIANCHI, N. (2021). Neighborhood participation is less likely among older adults with sidewalk problems. Journal of Aging and Health. Thousand Oaks, v. 33, n. 1-2, pp. 101-113.
-
UN DESA (2022). World Population Prospects 2022, United Nations Department of Economic and Social Affairs, Population Division, Nova York. Disponível em: https://population.un.org/wpp/Publications Acesso em: 13 nov 2025.
» https://population.un.org/wpp/Publications
-
Data availability statement:
The entire dataset supporting the results of this study has been published within the article itself.
Edited by
-
Editors:
Lucia Bógus andLuiz César de Queiroz Ribeiro
-
Organizers of this issue:
Ana Marcela Ardila PintoCarlos Fernando Ferreira LoboNatália Villamizar Duarte
The entire dataset supporting the results of this study has been published within the article itself.

 Source: IBGE (2023b).
 Source: IBGE (2025c).
 Source: compiled by the authors, based on an image from Google Maps, in 2025.
 Source:
  Source: own elaboration based on data from IBGE (Sidra).
 Source: own elaboration based on data from IBGE (Sidra).