
 GeoVacina Rio Monitor: epidemiological intelligence to restore vaccination coverage in the city of Rio de Janeiro, Brazil
Abstract
Vaccination coverage has declined in the municipality of Rio de Janeiro (MRJ) since 2019. To address this issue, within the expansion of the Family Health Strategy (FHS) and epidemiological intelligence, the GeoVacina Rio Monitor was created. Its aim is to recover vaccination for children with delayed doses and monitor pentavalent vaccine indicators in the population registered under the FHS in MRJ from January 2023 to January 2024. Data were extracted from the Electronic Health Record and summarized by FHS team, public health unit (PHU), and planning area (PA). An interactive map enables the viewing of children’s information and vaccination status at the team’s centroid. Additional features include vaccination coverage monitoring and downloading lists of children to be vaccinated across 237 PHUs. During the evaluated period, the proportion of fully vaccinated children increased from 76.1% (May 2023) to 90.8% (January 2024), a rise of 14.7 percentage points, with a 49.5 p.p. reduction in units with coverage below 80%. The GeoVacina Rio Monitor enhances data quality and restores vaccination coverage, aligning epidemiological intelligence with regional immunization strategies, with the potential for implementation in other municipalities.
Key words:
Primary Health Care; Vaccination Coverage; Public Health Surveillance; Vaccination; Geographic Mapping
Resumo
As coberturas vacinais entraram em queda no município do Rio de Janeiro (MRJ) a partir de 2019. Para reverter esta situação, no contexto da expansão da estratégia de saúde da família (ESF) e da inteligência epidemiológica, criou-se o Monitor GeoVacina Rio, com o objetivo de resgatar a vacinação de crianças com doses atrasadas e monitorar indicadores da vacina pentavalente na população cadastrada pela ESF no MRJ, de janeiro/23 a janeiro/24. Os dados são extraídos do Prontuário Eletrônico e sumarizados por equipe, unidade e área de planejamento. Um mapa interativo permite a visualizar informações da criança e status vacinal no centróide da equipe. Outras funcionalidades são o monitoramento da cobertura vacinal e download de listas das crianças a vacinar nas 237 unidades básicas de saúde. No período avaliado, a proporção de crianças com vacinação completa subiu de 76,1% (maio/23) para 90,8% (jan/24), aumento de 14,7 pontos percentuais (p.p.), e uma redução de 49,5 p.p. as unidades com menos de 80% de cobertura. O Monitor GeoVacina Rio permite a qualificação dos dados registrados e o resgate das coberturas vacinais, alinhando a inteligência epidemiológica à territorialidade das ações de imunização, podendo ser aplicada em outros municípios.
Palavras-chave:
Atenção Primária à Saúde; Cobertura Vacinal; Vigilância em Saúde Pública; Imunização; Mapeamento Geográfico
Resumen
Las coberturas de vacunación cayeron en el municipio de Río de Janeiro (MRJ) desde 2019. Para revertir esta situación, en el contexto de la expansión de la estrategia de salud familiar (ESF) y la inteligencia epidemiológica, se creó el Monitor GeoVacina Rio. Su objetivo es recuperar la vacunación de niños con dosis atrasadas y monitorear indicadores de la vacuna pentavalente en la población registrada por la ESF en el MRJ, de enero/23 a enero/24. Los datos se extraen del Historial Clínico Electrónico y se resumen por equipo, unidad y área de planificación (AP). Un mapa interactivo muestra datos sobre los niños y su estado vacunal en el centróide del equipo. También incluye monitoreo de la cobertura vacunal y descarga de listas de niños por vacunar en 237 unidades básicas. Durante el período evaluado, la proporción de niños con vacunación completa subió del 76,1% (mayo/23) al 90,8% (enero/24), un aumento de 14,7 puntos porcentuales (p.p.), y se redujo en 49,5 p.p. el número de unidades con menos del 80% de cobertura. El Monitor GeoVacina Rio permite calificar datos registrados y recuperar coberturas vacunales, alineando la inteligencia epidemiológica y la territorialidad de las acciones de inmunización, con potencial de uso en otros municipios.
Palabras clave:
Atención Primaria de Salud; Cobertura de Vacunación; Vigilancia de la Salud Pública; Vacunación; Mapeo Geográfico
Introduction
Low vaccination coverage increases vulnerability to a reintroduction of preventable diseases, and expanding access to immunobiological agents is one of the goals in the 2030 Agenda1. In Brazil, as in other countries, there has been a reduction in the coverage of different vaccines in recent years, a scenario that has become decisive for the intensification of global efforts aimed at recovering these indicators2,3.
Multiple barriers contribute to this decline, and, according to the WHO EURO Vaccine Communications Working Group, issues related to trust in the efficacy and safety of immunobiologicals; convenience, which concerns the availability of vaccination services; and complacency, a concept that relates to poor collective understanding of the risks of vaccine-preventable diseases are essential questions for the discussion of vaccine hesitancy and decline in coverage4,5.
An analysis of strategies focused on a reduction in vaccine hesitancy identified sets of initiatives with the greatest impact, such as those aimed at the non-vaccinated population or with incomplete vaccination schedules; methodologies aimed at increasing knowledge and awareness about vaccines; and expanding convenience and access to vaccination6. Lines of action aimed at improving coverage surveillance and incorporating artificial intelligence strategies have been encouraged as well7.
Data related to vaccination coverage in the Municipality of Rio de Janeiro (MRJ) indicate that the decline of these indicators occurred primarily from 2019 onward. In 2023, only the BCG vaccine reached the population coverage target, with all of the other immunizers remaining below the established values8. In the city, resuming the expansion of Primary Health Care (PHC) and enabling this recovery, in a manner integrated with health surveillance actions, in the context of emerging and reemerging grievances, is a challenge.
By understanding longitudinality and the coordination of care as key elements of PHC9 and by setting the priority of establishing the recovery of the city’s vaccination coverage, it is clear that these attributes favor the development of health surveillance actions, such as the active search for children with late vaccination schedules. These actions should be integrated into the workflow of the family health strategy (FHS) in Brazil10.
As part of an expanded strategy aimed at recovering vaccination coverage among children in the MRJ, a digital tool was developed at the Epidemiological Intelligence Center (EIC) to support the active search for children in MRJ who are behind in vaccinations. The pentavalent vaccine was chosen for the initial project, since it plays a crucial role in protecting against five serious diseases: diphtheria, tetanus, whooping cough, hepatitis b, and infection by Haemophilus influenzae type B. Moreover, it also serves as a temporal marker for other vaccination schemes that happen concomitantly, such as the polio vaccine, or prior to the pentavalent vaccine, such as vaccines against meningococcal disease C, rotavirus, and 10-valent pneumococcal.
Therefore, the present study sought to describe the structure of the Geovacina RioMonitor and the evolution of the operational indicators related to the pentavalent vaccine in the population registered by the FHS in MRJ from January 2023 to January 2024.
General aspects of the GeoVacina Rio Monitor
Context of implementation and data source
The GeoVacina Rio Monitor was implemented in May 2023, focused on supporting the active search for children with missing doses of the pentavalent vaccine in MRJ, configuring delays in and incomplete vaccination. Since 2012, the National Immunization Program (NIP) has offered this immunobiological agent as part of the routine of the vaccination calendar for children, and that routine scheme consists of three doses of the immunobiological agent (at two, four, and six months of age)11.
Personal information (name, date of birth, mother’s name, and record number), data related to vaccination (immunobiologicals, doses, dates of vaccination, and kind of record), and regarding the patient’s PHC reference unit (number of the unit (CNES), FHS team, and registration status) have been used to formulate the indicators of the GeoVacina Rio Monitor. Those records come from Electronic Patient Records (EPR) from the 237 PHC facilities in the 10 planning areas (PA) of MRJ, which, since 1993, is divided into these regions for the purpose of planning and organization of healthcare actions12.
Processing, epidemiological indicators, and spatial analysis of the records
Data extraction from the EPR is performed using an application programming interface (API) in Python language. The database used in this study consists of two tables: (1) user records and (2) vaccination records. Using a script in R language, data cleaning, aggregation and normalization are performed, as are the linkage process of user records and vaccination data. Information regarding administered or registered doses is linked to the patients that have an active record during the analyzed period. The information was grouped and summarized by different levels of information management (MRJ, PA, Primary Care Unit (PCU) and FHS team). In the second phase, the records passed through a categorization process according to the vaccination records in the EPR.
The proportion of vaccinated children was calculated by using, as the numerator, the total number of children with the third dose (D3) of the pentavalent vaccine, and as denominator, the target population, multiplying by 100 for each unit of analysis used (team, public health unit (PHU), PA, or MRJ). The target population is the total number of children registered in the FHS, in the age group of 6 months to 11 months and 29 days. It is a dynamic denominator, considering that each month, the number of children is updated (including those who complete 6 months of age, subtracting those that complete 1 year of age and inserting those who were registered). The dates of birth and the last date of the month defined the population cutoff in the specific age range. Temporary records of children who died were defined as exclusion criteria for the elaboration of vaccination proportions. We included verification and validation steps in order to minimize errors that affect the indicator’s numerator. The calculation of the indicator defines the number of children with D3 vaccine applied/registered as the numerator, while the denominator corresponds to the number of recorded children. Children that were not registered were not included.
The categorization based on vaccination proportion was established using the following cutoff points: above 95% (green), between 80% and 95% (yellow), and below 80% (red). This categorization was applied at the level of the PAs of MRJ, as well as for the units and FHS teams.
An interactive map of the PAs was made available13, with the following selection layers: PAs; polygons of areas of social vulnerability, defined as social territories - a program implemented in 2017 in MRJ in partnership with UN Habitat; territories of the PHC Units and FHS teams, and a layer that classifies the FHA teams according to the strata of the situation of vaccination proportions (indicated by colors). It is important to highlight that the children are geolocated at the geometric centroid of the polygons of the FHS teams to which their address registered in the EPR belong.
The proportion of vaccinated children was calculated based on EPR records extracted by January 1, 2024. The information was made available for the professionals of the Municipal Health Secretary, in html format, on the city’s internal platform (subpav.org), with access restricted by password. Monthly updates are widely made available for the professionals by means of the usual communication channels. The entire tool was programmed by using the R and QGIS statistics softwares14,15.
Structure and functionality of the GeoVacina Rio Monitor
The GeoVacina Rio Monitor was designed with six components: (i) Statistical summary; (ii) GeoVacina Rio map; (iii) EPR download; (iv) Evolution; (v) GeoSinasc Mapa; and (vi) GeoSinasc Download. This structure was proposed to facilitate access to epidemiological indicators and expand the capacity of management of information related to the proportion of vaccinated children, at the local level, as well as by PA managers and at the central level of health surveillance. The components, main objectives, function, and use levels of the tool are presented in Chart 1.
By consulting the Statistical Summary, indicators of the proportion of those vaccinated with the pentavalent vaccine were obtained, to monitor the percentage of children, aged 6 to 11 months, with D3, registered both in the municipality and according to PA, health unit, and FHS team, and according to the defined cutoff points. Moreover, it is possible to evaluate the proportion of health units and FHS teams in each of the scores of these indicators, by PA and by MRJ.
The GeoVacina Rio Map provides users with an interactive way to identify children registered in the FHS according to the vaccination profile for the pentavalent vaccine. Each point represents a child, georeferenced in the centroid of the team polygon with an offset to avoid overlapping. The colors of the points signal the following specificities: in blue, children that have the final dose, which completes the basic scheme - D3 (blue); in red, children without complete vaccination, without the D3 (red); and in yellow, children without the D3, but in the age group between 6 months and 6 months and 29 days of age (yellow), and are therefore within the window of opportunity to take this dose. By clicking on a point, the child’s medical record number, situation of the record, health unit, and FHS team are displayed (Figure 1). This functionality favors the active search of a child within the territory. The team polygons are colored according to the proportions of vaccination coverage.
Interactive GeoVacina Rio map with location points according to vaccination status. MRJ, July/2024.
In EPR Download, it is possible to download lists containing information about children with incomplete vaccination records found in their files. This list contains the name of the health unit, the FHS team, the number of the files, the child’s name and date of birth, as well as the status of the registration of the vaccine record. The list can be broken down by health unit, favoring the management of priority situations for the follow-up of vaccination status in the region. In the “Evolution” component, the monthly series of the proportion of children vaccinated with the third dose of the pentavalent vaccine can be generated.
To locate children born in the region, the GeoSinasc and SINASC Download components are made available. Live births that are not registered in the PHU files are identified through linkage, so that areas can be viewed in the map, and lists by areas can be generated so as to enable the active search for the inclusion of new records in the files and, consequently, update the vaccination records.
Indicators related to pentavalent vaccine coverage, by the GeoVacina Rio Monitor
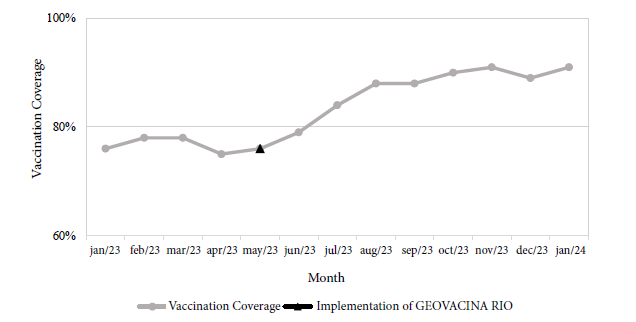
As shown in Figure 2, since the implementation of the GeoVacina Rio Monitor in May 2023, there has been an increase in the proportion of children vaccinated with the third dose, thus showing a complete vaccination scheme. The values calculated at the time of the implementation (May/2023) and at the end of the period (January/2024), were respectively, 76.1% and 90.8%, indicating a 14.7% increase.

Evolution of the proportion of children registered with the third dose of the pentavalent vaccine (D3) at the FHS, MRJ, January/2023 to January/2024.
From January to May 2023, before the implementation of the GeoVacina Rio, no improvement was observed in the municipality indicator, with some areas showing worse coverage. When evaluating the entire period, eight months after the tool’s implementation, an increase was found in the proportion of children with the third dose of the pentavalent vaccine, in every PA (Table 1). In this analysis, PA 3.1 (Penha/Ramos/Ilha) stands out, with an increase of 40.38% in the period studied.
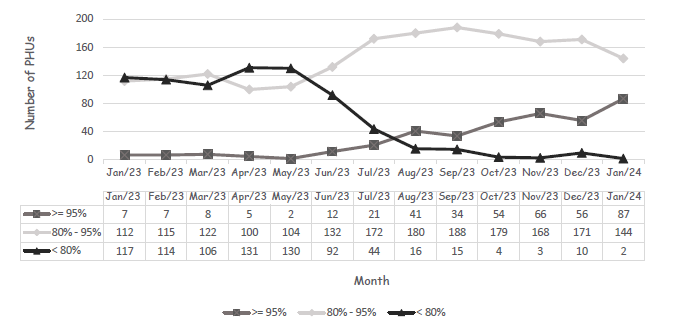
In January 2023, of the 236 PHUs, 17 (49.5%) showed indicators below 80%, 112 (47.5%) had indicators between 80% and 95%, and only 7 (2.9%) presented indicators above 95%. In January 2024, of the 237 units (a new unit was created in the network), 2 (0.8%) had indicators below 80%, 144 (60.8%) between 80% and 95%, and 87 (36.7%) with indicators above 95%. (Figure 3).
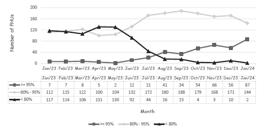
Distribution of the PHUs according to indicators of vaccination proportion, MRJ, January/2023 to January/2024.
The monthly publication of updated information by the GeoVacina Rio Monitor also resulted in the formalization of a communication channel to address possible doubts that health professionals may have regarding the tool. In this channel, routinely monitored by a technician from the Epidemiological Intelligence Center (EIC), doubts related to the indicators generated by the tool can be clarified, which also allowed for feedback, thus improving the system.
Discussion
The use of digital technologies to strengthen immunization programs was reiterated through recently established directives by the World Health Organization (WHO)7. In this sense, the GeoVacina Rio Monitor fulfills the role of supporting the management of information related to the pentavalent vaccine opportunity, in different geographic levels (municipality, PAs, assigned areas) and led to the integration of health surveillance and PHC practices in the regions, as provided for in the National Health Surveillance Policy10.
The implementation of the tool was not an isolated intervention, but rather it was aligned with an expanded plan for recovering vaccination coverage in MRJ, a current priority in the political agenda, and which includes strategies aimed at reducing access barriers; expanding extramural vaccination; establishing partnerships with the education sector; and providing training on immunization, scientific dissemination, and improvement of communication strategies regarding immunobiologicals2. The surveillance provides disaggregated information at an individual level and favors the monthly follow-up of the target population as regards the pentavalent vaccine. For health surveillance, such vaccination surveillance during the appropriate age is essential to identify opportunities for vaccination16.
An active search for children that have not been vaccinated or that have missing doses, reduces individual and collective vulnerability to vaccine-preventable diseases. In this sense, the GeoVacina Rio Monitor facilitated the identification of children with delays in vaccination, either by showing this information on the map or by generating nominal lists of children so that the professionals of the PHUs could conduct an active search, thereby guiding an activity which is widely encouraged by the NIP17, including the surveillance of indicators considered in the PHC qualification programs and health surveillance programs18,19. Furthermore, the management of user lists and person-to-person linkage is described as an activity that relates to the coordination of care in primary care20.
The tool enabled the identification of heterogeneities in the proportion of vaccinated children in different areas of the city, by the GeoVacina Rio Map component, indicating regions with low indexes and the assessment of the risk of disease occurrence in these areas. It also supports the planning of strategies via Health Surveillance. Initiatives that relied on the use of geographic information systems for the microplanning of vaccination strategies were linked to the increase of vaccination coverage and the implementation of information, highlighting the value of spatially detailed data21,22.
In MRJ, the EIC has invested in technologies and new means of acquisition and management, as well as new methods of data analysis, in a combination that involves the work of data scientists, epidemiologists with expertise in Geographic Information systems (GIS) and public health officers. The GeoVacina Rio Monitor is a product that supports the use of geographic intelligence to direct health actions, and encourages the study of spatial differences as determinants of territorial inequalities in the proportion of vaccinations, which need to be investigated and dealt with, especially when the problem is related to access to specific services23,24. Spatial inequalities in the vaccination of children were recently studied by Boing et al.24, highlighting regional disparity and worse vaccination coverage for COVID-19 in towns with a lower Human Development Index (HDI).
In Brazil, vaccination coverage (VC) surveillance has been conducted, historically, through the administrative method, which considers the doses of vaccines administered (numerator) and the population estimates (denominator)25. In addition to this strategy, national coverage surveys have also been used, which are important instruments to obtain more precise estimates of children’s VC, and provide information concerning access to services and socioeconomic profiles of the vaccinated individuals, given that such information is not available in the official systems26.
In 2020, the year that the last survey was conducted, it was found that 30.0% of the doses recorded in the vaccination booklet were not registered in the National Immunization Program Information System (NIP-IS)26. Considering the need to obtain truthful and opportune information for VC surveillance in MRJ, the data used to formulate the GeoVacina Rio Monitor indicators is obtained directly from the electronic files in use by PHC. This option benefits the development of disaggregated operational indicators and expands the possibility of analyses related to the proportion of individuals vaccinated with the pentavalent vaccine in MRJ. Moreover, it encourages the recovery of information to update the NIP-IS, thus reducing sub-registry.
Gains related to the structuring of surveillance systems aimed at detecting vaccination opportunities have been previously presented in Brazil16. The GeoVacina Rio Monitor additionally indicates children with late vaccination, as well as those who are in the recommended age group for the third dose of the pentavalent vaccine, with improvements in terms of communicating information to the health professionals. Therefore, in addition to being a tool for vaccination recovery, it also shows potential for preventing vaccination delays, since it advises of the opportunity of vaccination before the delays actually occur.
Initially, the pentavalent vaccine was prioritized for use in the tool, as was historically included in national monitoring programs, whereas currently, pentavalent coverage is informed to the Health Surveillance Actions Qualification Program19. Considering this immunobiological agent, from January 2023 to January 2024, better results were observed in the D3 proportion, including a decrease in the number of PCUs with the worst scenario (proportion of vaccinated individuals below 80.0%). This result, however, cannot be attributed exclusively to the tool, since its introduction was part of an expanded strategy for the recovery of VC throughout the city. It is, however, evident that the change in the scenario was more noticeable from May 2023 onward, when the tool was made available for the entire network.
It appears that offering a support channel has favored engagement and dissemination of the tool among health professionals. In meetings of the municipality’s network of health surveillance, the GeoVacina Rio Monitor has been mentioned when the issue of VC is discussed, as it allows each area to have direct active search strategies in its region. The dissemination of the results of an analysis of health status retrofeeds the indicator development process and reinforces the connection between the objectives of the health organizations and those of medical professionals27.
Limitations of the tool are related to a greater appropriation of the tool by professionals, availability and availability of the FHS records and data quality. The initial limitation regarding the use of the tool stemmed from the learning curve of professionals, which was addressed by support and training. Understanding the analysis’ methodology, together with the indicators displayed, was essential in the process of the appropriation of the tool in its many uses, but there is a clear need for continuous training. Another limitation is availability and opportune regularity of the EPR records, considering the large volume and the fragmentation of the data. It is crucial that the data obtained be reliable in order to achieve greater precision in the final analysis. The integration of the tool with the EPR posed considerable challenges, hence the need for constant updating of the Evaluation of Immunization Programs.
Conclusion
In the context of digital changes in public health, the GeoVacina Rio Monitor can be seen as a major ally for the recovery of VC and for improvements in the quality of recorded data. The monitor indicates regions and children at higher risks and enables the proper guidance of actions based on epidemiological intelligence, favoring access to vaccines, by home vaccination via the FHS, by extramural vaccination points, or at PHUs, after communication with the responsible parties. The analysis described above was restricted to one single immunizer and one limited age group. However, the tool has been adjusted in order to include other vaccines. When considering larger volumes of records and processing, more complex algorithms are being developed by the EIC. This is a key procedure for the identification of vulnerable groups and for the follow-up on VC trends for different immunobiological agents, in turn providing a broader view, with greater quality, on the vaccination status of the population. In addition to vaccination, it also can be seen as an invaluable tool in the coordination of infant health care.
This kind of strategy, which aligns epidemiological intelligence with territoriality of immunization actions, can be applied in other towns, even those with limited technological resources. It is the role of each PA to know their children and to organize itself in such a way that teams can search for those on their lists, resulting in expanded VC. A model such as the GeoVacina Rio Monitor, with a geographically based app, will require more resources, which are often available in the Health Secretaries; however, not everyone in the administration knows about those resources or that they can be acquired and used by personnel trained for the development of the tool.
Acknowledgments
To Dr. Daniel Ricardo Soranz, Municipal Secretary of Health of the city of Rio de Janeiro and Nadyra Moraes Irineu, Health Surveillance Analyst at the Center for Epidemiological Intelligence.
References
- 1 United Nations. Seventieth United Nations General Assembly, A/RES/70/1. New York: United Nations; 2015.
- 2 Homma A, Maia MLS, Azevedo ICA, Figueiredo IL, Gomes LB, Pereira CVC, Paulo EF, Cardoso DB. Pela reconquista das altas coberturas vacinais. Cad Saude Publica 2023; 39(3):e00240022.
- 3 GBD 2020, Release 1, Vaccine Coverage Collaborators. Measuring routine childhood vaccination coverage in 204 countries and territories, 1980-2019: a systematic analysis for the Global Burden of Disease Study 2020, Release 1. Lancet 2021; 398(10299):503-521.
- 4 MacDonald NE. SAGE Working Group on Vaccine Hesitancy. Vaccine hesitancy: definition, scope and determinants. Vaccine 2015; 33:4161-4164.
- 5 Souza FO, Werneck GL, Pinho PS, Teixeira JRB, Lua I, Araújo TM. Hesitação vacinal para influenza entre trabalhadores(as) da saúde, Bahia, Brasil. Cad Saude Publica 2022; 38(1):e00098521.
- 6 Jarrett C, Wilson R, O'Leary M, Eckersberger E, Larson HJ; SAGE Working Group on Vaccine Hesitancy. Strategies for addressing vaccine hesitancy - A systematic review. Vaccine 2015; 33(34):4180-4190.
-
7 Organização Panamericana de Saúde (OPAS). Revigoramento da Imunização como um bem público para a saúde universal [Internet]. [acessado 2024 nov 20]. Disponível em: https://www.paho.org/pt/documentos/cd5910-revigoramento-da-imunizacao-como-um-bem-publico-para-saude-universal
» https://www.paho.org/pt/documentos/cd5910-revigoramento-da-imunizacao-como-um-bem-publico-para-saude-universal -
8 Rio de Janeiro. Prefeitura da Cidade do Rio de Janeiro. Secretaria Municipal de Saúde. Observatório Epidemiológico da Cidade do Rio de Janeiro [Internet]. 2024 [acessado 2024 nov 20]. Disponível em: https://epirio.svs.rio.br/paineis/coberturas-vacinais/.
» https://epirio.svs.rio.br/paineis/coberturas-vacinais - 9 Pinto LF, Giovanella L. Do Programa à Estratégia Saúde da Família: expansão do acesso e redução das internações por condições sensíveis à atenção básica (ICSAB). Cien Saude Colet 2018; 23(6):1903-1914.
- 10 Brasil. Conselho Nacional de Saúde (CNS). Resolução nº 588, de 12 de julho de 2018. Institui a Política Nacional de Vigilância em Saúde. Publicada no DOU nº 155, seção 1, 13/08/2018, páginas 87 a 90. Diário Oficial da União; 2018.
- 11 Brasil. Ministério da Saúde (MS). Secretaria de Vigilância em Saúde. Departamento de Vigilância das Doenças Transmissíveis. Manual de Normas e Procedimentos para Vacinação. Brasília: MS; 2014.
-
12 Rio de Janeiro. Prefeitura da Cidade do Rio de Janeiro. Secretaria Municipal de Saúde. Observatório Epidemiológico da Cidade do Rio de Janeiro. Guia de atribuições e competências da rede municipal de vigilância em saúde [Internet]. [acessado 2024 nov 20]. Disponível em: https://epirio.svs.rio.br/wp-content/uploads/2023/01/Guia_AtribuicoesSVS-1.pdf
» https://epirio.svs.rio.br/wp-content/uploads/2023/01/Guia_AtribuicoesSVS-1.pdf -
13 Rio de Janeiro. Prefeitura da Cidade do Rio de Janeiro. Data Rio [Internet]. [acessado em 2024 set 13]. Disponível em: https://www.data.rio/documents/fa85ddc76a524380ad7fc60e3006ee97/about
» https://www.data.rio/documents/fa85ddc76a524380ad7fc60e3006ee97/about - 14 QGIS DEVELOPMENT TEAM. QGIS Geographic Information System. [s.l.] Open-Source Geospatial Foundation Project; 2020.
- 15 R Core Team. R: A Language and Environment for Statistical Computing [Internet]. Vienna: R Foundation for Statistical Computing; 2023 [acessado 2024 nov 20]. Disponível em: https://www.R-project.org/.
- 16 Tauil MC, Sato APS, Costa ÂA, Inenami M, Ferreira VLR, Waldman EA. Coberturas vacinais por doses recebidas e oportunas com base em um registro informatizado de imunização, Araraquara-SP, Brasil, 2012-2014. Epidemiol Serv Saude 2017; 26(4):835-846.
-
17 Brasil. Ministério da Saúde (MS). Dez passos para ampliação das coberturas vacinais na Atenção Primária à Saúde [Internet]. [acessado 2021 jan 23]. Disponível em: http://189.28.128.100/dab/docs/portaldab/documentos/folder10pontos.pdf
» http://189.28.128.100/dab/docs/portaldab/documentos/folder10pontos.pdf - 18 Holanda WTG, Oliveira SB, Sanchez MN. Aspectos diferenciais do acesso e qualidade da atenção primária à saúde no alcance da cobertura vacinal de influenza. Cien Saude Colet 2022; 27(4):1679-1694.
- 19 Brasil. Ministério da Saúde (MS). Portaria GM/MS nº 233, de 9 de março de 2023. Estabelece as metas e os indicadores do Programa de Qualificação das Ações de Vigilância em Saúde - PQA-VS para a avaliação do ano de 2023. Diário Oficial da União; 2023.
- 20 Soranz D, Pinto LF, Penna GO. Eixos e a Reforma dos Cuidados em Atenção Primária em Saúde (RCAPS) na cidade do Rio de Janeiro, Brasil. Cien Saude Colet 2016; 21(5):1327-1338.
- 21 Ali D, Levin A, Abdulkarim M, Tijjani U, Ahmed B, Namalam F, Oyewole F, Dougherty L. A cost-effectiveness analysis of traditional and geographic information system-supported microplanning approaches for routine immunization program management in northern Nigeria. Vaccine 2020; 38(6):1408-1415.
- 22 Utazi CE, Thorley J, Alegana VA, Ferrari MJ, Takahashi S, Metcalf CJE, Lessler J, Cutts FT, Tatem AJ. Mapping vaccination coverage to explore the effects of delivery mechanisms and inform vaccination strategies. Nat Commun 2019; 10(1):1633.
- 23 Cruz DMO, Ferreira CD, Carvalho LF, Saraceni V, Durovni B, Cruz OG, Garcia MHO, Aguillar GMO. Inteligência epidemiológica, investimento em tecnologias da informação e as novas perspectivas para o uso de dados na vigilância em saúde. Cad Saude Publica 2024; 40(8):e00160523.
- 24 Boing AC, Boing AF, Borges ME, Rodrigues DO, Barberia L, Subramanian S. Spatial clusters and social inequities in COVID-19 vaccine coverage among children in Brazil. Cien Saude Colet 2024; 29(8):e03952023.
-
25 Brasil. Ministério da Saúde (MS). Nota informativa [Internet]. [acessado 2024 nov 20]. Disponível em: https://infoms.saude.gov.br/content/Default/NOTA_INFORMATIVA_SOBRE_POPULA%C3%87%C3%83O.pdf
» https://infoms.saude.gov.br/content/Default/NOTA_INFORMATIVA_SOBRE_POPULA%C3%87%C3%83O.pdf - 26 Tauil MC, Macedo LR, Maranhão AGK. National Vaccination Coverage Survey and its importance amid the challenges. Epidemiol Serv Saude 2024; 33(n. esp. 2):e2024418.
- 27 Bahia LO. O. Guia referencial para construção e análise de indicadores [Internet]. Brasília: Enap; 2021 [acessado 2024 nov 20]. Disponível em: https://repositorio.enap.gov.br/bitstream/1/6154/1/GR%20Construindo%20e%20Analisando%20Indicadores%20-%20Final.pdf.

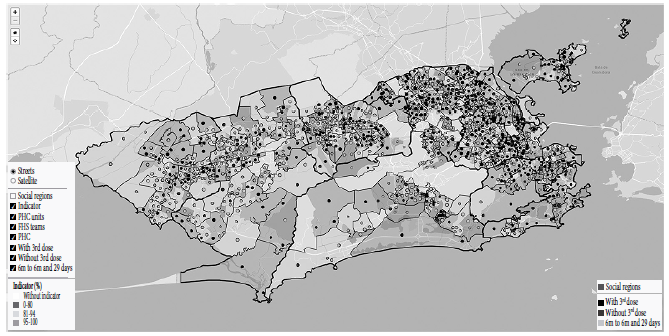 Source: GeoVacina Monitor Rio, July/2024, SMS-Rio.
 Source: GeoVacina Rio Monitor, July/2024, SMS-Rio.
 Note: It was not possible to perform the calculation for four units in January/2024. Source: GeoVacina Rio Monitor , July/2024, SMS-Rio.