
 Carbon Liabilities Are Priced: Carbon-Adjusted Debt Predicts Underperformance
ABSTRACT
Objective: this study investigates whether corporate carbon emissions behave as a financial liability that affects firms’ cost of capital and equity performance in Brazil.
Theoretical approach: we propose a market-consistent metric that transforms reported greenhouse-gas emissions into a carbon-adjusted cost of debt (∆y) within a Merton-style structural credit model. This framework bridges sustainability accounting with asset pricing by treating emissions as an explicit, priced liability.
Methods: using data from 58 firms in B3’s ICO2 index and daily observations from 2021 to 2025, we estimate ∆y for each company and run pooled regressions of BRL stock returns on global carbon-allowance ETF returns. We control for market returns, energy prices, and exchange-rate (FX) movements to capture the BRL-denominated impact of USD-priced carbon shocks.
Results: the carbon-adjusted yield is close to zero for most firms but exhibits a heavy left tail, revealing a subset with material carbon-implied financing costs. Cross-sectionally, higher ∆y firms earn significantly lower daily stock returns. Moreover, the triple interaction carbon ETF × ∆y × FX is large and negative, indicating that BRL-denominated increases in carbon prices lead to stronger underperformance of high-∆y firms.
Conclusions: markets partially internalize carbon obligations: higher carbon liabilities raise firms’ debt yields and reduce equity returns when global carbon prices rise in BRL terms. The carbon-adjusted yield offers a novel, yield-based indicator for investors, regulators, and policymakers to incorporate carbon risk into credit analysis, portfolio allocation, and corporate finance decisions.
Keywords:
carbon markets; Merton model; credit risk; ETFs; corporate finance
RESUMO
Objetivo: este estudo investiga se as emissões corporativas de carbono se comportam como um passivo financeiro, afetando o custo de capital e o desempenho acionário das empresas no Brasil.
Marco teórico: propomos uma métrica de mercado que transforma emissões de gases de efeito estufa reportadas em um custo da dívida ajustado ao carbono (Δy), dentro de um modelo estrutural de crédito do tipo Merton. O arcabouço aproxima contabilidade socioambiental e apreçamento de ativos ao tratar emissões como passivos explícitos e potencialmente precificados.
Métodos: utilizamos dados de 58 empresas do índice ICO2 da B3, com observações diárias entre 2021 e 2025. Estimamos Δy para cada companhia e rodamos regressões em painel dos retornos acionários em BRL sobre os retornos de um ETF global de créditos de carbono. Controlamos por mercado, preços de energia e câmbio, capturando o impacto, em reais, de choques globais de carbono precificados em dólares.
Resultados: o yield ajustado ao carbono é próximo de zero para a maioria das empresas, mas apresenta cauda pronunciada, revelando firmas com custos implícitos de carbono materialmente elevados. Transversalmente, empresas com maior Δy exibem retornos diários significativamente menores. A interação tripla ETF de carbono × Δy × FX é negativa e elevada, indicando que aumentos dos preços globais de carbono em reais penalizam mais intensamente empresas com maior exposição.
Conclusões: os mercados internalizam parcialmente obrigações de carbono. O Δy oferece um indicador baseado em crédito para incorporar risco de carbono em análise financeira, regulação, alocação de portfólio e finanças corporativas.
Palavras-chave:
mercados de carbono; modelo de Merton; risco de crédito; ETFs; finanças corporativas
INTRODUCTION
In financial markets, carbon exposure is moving rapidly from a footnote in sustainability reports to a priced component of corporate balance sheets. Governments now operate more than 75 carbon-pricing instruments worldwide, collecting hundreds of billions of dollars annually and covering roughly a quarter of global greenhouse-gas emissions (World Bank, 2024). For firms, these policies transform carbon emissions from an abstract externality into a tangible liability. Yet capital markets still grapple with how to quantify the cost of this liability and to what extent investors already incorporate it into valuations.
In this paper, we examine whether carbon emissions can be treated and priced as a corporate liability that affects both the cost of debt and equity market performance. Specifically, we address three research questions. First, can reported greenhouse-gas emissions be translated into a market-consistent incremental cost of debt using a structural credit model? Second, do Brazilian equity markets penalize firms with higher carbon-implied debt costs when global carbon prices rise? Third, does the local currency (BRL) modulate this transmission by amplifying or dampening the pass-through of USD-denominated carbon price shocks?
This topic matters to multiple audiences. Researchers in finance and accounting seek to understand how environmental risks are priced and how sustainability information feeds into asset pricing and corporate finance. Regulators and policymakers face growing pressure to ensure that markets internalize the costs of greenhouse-gas emissions and to design disclosure frameworks that make such pricing possible. Investors and credit analysts need tools to measure the financial impact of carbon exposure on funding costs and portfolio returns, particularly in emerging markets like Brazil, where policy, currency, and commodity dynamics intersect.
Using a Merton-style structural credit model, we embed firms’ reported carbon emissions into their balance sheets as an additional, interest-bearing liability. From this framework, we derive a carbon-adjusted cost of debt (∆y) that captures the incremental yield attributable to carbon exposure. Our sample comprises 58 companies listed in B3’s ICO2 index, with daily market and ETF data from October 2021 through July 2025. To test market transmission, we run pooled daily regressions of BRL stock returns on returns of USD-denominated carbon-allowance exchange-traded funds (ETFs), controlling for local and global equity market returns, energy prices, and the USD/BRL exchange rate. This design isolates whether BRL-denominated carbon price shocks differentially affect the equity performance of firms with higher ∆y.
We offer two main results. First, although the carbon-adjusted yield is near zero for most firms, its distribution is heavy-tailed: a non-trivial subset exhibits material carbon-implied financing costs. Second, ∆y loads negatively and significantly on stock returns, and the triple interaction carbon ETF × ∆y × FX is large and negative. This means that when BRL-denominated carbon prices rise, because of higher global carbon prices or BRL appreciation, firms with higher carbon-implied debt costs underperform more in the stock market. Together, these findings show that markets partially internalize carbon liabilities and that currency movements modulate the pass-through from global carbon prices to local equity valuations.
We make several contributions to the literature. First, we extend the sustainability accounting and asset-pricing literatures by developing a yield-based, market-consistent metric (∆y) that translates reported emissions into a priced liability using a structural credit model. Second, we contribute to the growing research on carbon pricing and financial markets by documenting that equity investors penalize firms with higher carbon-implied debt costs, particularly when currency dynamics intensify the local impact of global carbon shocks. Third, we provide investors, credit analysts, and regulators with a practical tool to integrate carbon risk into weighted average cost of capital (WACC) calculations, credit screening, and portfolio allocation decisions.
The remainder of this paper is organized as follows. First, we review the related literature on carbon pricing, structural credit models, and sustainability accounting. Second, we describe our data and empirical methodology. We then present the main results and robustness tests, followed by discussion and implications of our findings. Lastly, we conclude with contributions, limitations, and directions for future research.
LITERATURE REVIEW
A growing body of empirical research documents that carbon exposure affects firms’ cost of capital across multiple channels. In equity markets, Bolton and Kacperczyk (2021, 2023) provide systematic evidence that investors demand a carbon risk premium: firms with higher direct emissions earn higher stock returns, consistent with compensation for transition risk. Görgen et al. (2020) construct a carbon beta showing that brown firms underperform when climate concerns intensify. In the European Union context, Oestreich and Tsiakas (2015) find that firms receiving free emission allowances exhibit positive abnormal returns, while Koch and Bassen (2013) document negative valuation effects for carbon-intensive firms following the implementation of allowances.
The cost-of-debt channel has received increasing attention. Kleimeier and Viehs (2021) show that banks charge higher loan spreads to firms with greater carbon footprints, even after controlling for traditional credit risk factors. Delis et al. (2019) find that climate policy exposure raises syndicated loan costs, particularly for fossil fuel firms. In bond markets, Ehlers et al. (2022) document a modest ‘greenium’ for certified green bonds, while Seltzer et al. (2022) show that firms with higher emissions face wider credit spreads following the Paris Agreement.
Pricing carbon exposure as a liability is a pivotal research problem that involves scholars, practitioners, and regulators. According to the World Bank (https://carbonpricingdashboard.worldbank.org/what-carbon-pricing) a price on carbon helps shift the burden for the damage from greenhouse-gas (GHG) emissions back to those who are responsible for it. As governments and markets increasingly impose carbon pricing, taxes, and regulations, firms that fail to account for their GHG exposure risk substantial future costs (Fuss et al., 2021).
Shadow carbon pricing is a microeconomic concept that assigns a notional cost to a firm’s greenhouse-gas emissions to incorporate climate externalities into capital budgeting, performance evaluation, and risk management. Conceptually, the shadow price can be anchored to estimates of the social cost of carbon (SCC) from integrated assessment models, providing a theoretical proxy for marginal climate damages caused by releasing one additional ton of carbon dioxide (tCO2) into the atmosphere (Nordhaus, 2017; Pindyck, 2019). Empirically, adoption and the level of internal prices are systematically related to national climate policies and external carbon constraints, indicating that firms calibrate shadow prices in response to regulatory exposure and cost uncertainty (Aldy et al., 2021; Bento & Gianfrate, 2020; Trinks et al., 2022).
Bumpus and Liverman (2008) argue that internal carbon pricing represents a form of private environmental governance, where corporations create their own regulatory frameworks in the absence of comprehensive government carbon pricing. Aldy et al. (2021) analyze over 2,000 company disclosures to document that leading companies apply US$ 15-100/tCO₂e to investment screening. Their methodology classifies shadow pricing approaches into cost-based versus market-based systems, examining sectoral and regional variations through time-series analysis (2017-2020) and correlating pricing choices with policy environments. They identify four primary methodological approaches: internal fee systems, investment screening hurdle rates, risk assessment adjustments, and scenario planning with embedded carbon costs, though practices vary widely across sectors and jurisdictions.
Valuing carbon liabilities may also become an asset liability management (ALM) problem. Stranded assets are known as assets that lose economic value or become liabilities before reaching the end of their anticipated useful life due to changes such as policy shifts, technological advancements, market developments, or physical impacts from climate change (Caldecott et al., 2013; Caldecott et al., 2016). Carney (2015) expands the concept in the realm of climate finance by considering potential write-downs in carbon-intensive assets, such as fossil fuel reserves that may never be extracted or facilities that become obsolete (McGlade & Ekins, 2015), as economies transition to low-carbon energy sources. Such obsolescence and the underlying true cost of carbon are rarely fully captured by market valuations, which implies that untapped reserves might become trillion-dollar liabilities (Semieniuk et al., 2022) rather than assets if global carbon budgets are enforced.
Regarding disclosure frameworks, the GHG Protocol (Ranganathan et al., 2004; World Business Council for Sustainable Development [WBCSD] & World Resources Institute [WRI], 2011) is probably the most common benchmark for reporting (Reichelstein, 2024). It defines Scope 1-3 boundaries that translate emissions into potential obligations. Reporting often involves identifying carbon allowances as assets and recognizing liabilities for excess emissions, but standards for valuation are inconsistent (Bebbington & Larrinaga‐González, 2008). Yet financial statement recognition remains rough, with various alternative accounting treatments that hamper comparability (Tang & Demeritt, 2018).
Major jurisdictions already mandate Scope 1 (and often Scope 2) disclosures and run detailed measurement/verification for charges under carbon taxes and cap-and-trade systems (Downar et al., 2021). By contrast, Scope 3 reporting is uneven: most firms disclose Scopes 1-2, while only a minority provide partial Scope 3 disclosures and often understate them because estimates rely on secondary life-cycle averages rather than primary supplier data (Hale et al., 2021; Klaassen & Stoll, 2021).
To improve informativeness and incentives, Reichelstein (2024) proposes accrual carbon accounting that mirrors financial accounting: a carbon-emissions (CE) balance sheet (assets hold embodied emissions in PPE/WIP/finished goods; liabilities/equity record emissions transferred in, direct emissions, and direct removals) and a flow statement with carbon emissions in goods sold (CEGS), the carbon analogue of COGS. Financials are produced with cost-accounting-style allocations (e.g., activity-based carbon pools and drivers), subject to a balancing constraint that current direct and indirect emissions equal the emissions assigned to inventories.
Despite this progress in accounting practical fields, three gaps remain in the finance literature. First, existing studies treat carbon primarily as a risk factor rather than as an explicitly priced balance-sheet liability with market valuation. Second, evidence from emerging markets, where policy environments and capital structures differ from developed economies, remains scarce, particularly due to the inexistence or very early stages of compliance carbon markets in these jurisdictions. Third, given the nascent status of carbon markets in emerging economies, the connection between carbon-adjusted financial metrics and the transmission of global carbon price shocks through exchange rate channels has not been systematically examined. Our study addresses these gaps by developing a yield-based carbon liability metric within a structural credit framework, testing its pricing implications in Brazilian equities, and documenting the exchange-rate fluctuation pass-through of international (USD) carbon price movements to local currency (BRL) stock returns.
Utilizing the Merton model to price liabilities
The Merton (1974) model has served as a foundational framework for pricing corporate liabilities by treating equity as a call option on the firm’s assets and debt as a combination of risk-free bonds and short positions in put options. Numerous studies have utilized this model to capture a broader range of liability structures observed on balance sheets (Galai et al., 2011; Gu et al., 2019; Reneby, 1998; Zhou & Zhang, 2020).
Recent advancements have applied the Merton model to more complex financial liabilities and various regulatory environments. Jobst (2002) adapted it to collateralized loan obligations (CLOs), Fischer (2010) proposed a generalization that includes cross-ownership of liabilities and multiple seniority levels, Tilloca (2018) employed a risk-neutral, Merton-based approach to estimate the fair value of non-performing loans (NPLs), and Gray and Malone (2012)showcased the model’s adaptability to stochastic interest rates, recovery rates, and non-standard distress barriers.
Applied to the carbon market, the Merton model has been utilized by Reinders et al. (2023), Ge et al. (2024), and Löschenbrand et al. (2025) to calculate default probabilities of companies pursuing carbon targets, as well as measuring financial impacts derived from carbon shocks. The core idea is that higher carbon costs reduce profits and, ceteris paribus, raise default probability in a Merton structural model.
This paper’s methodology advances the literature by translating carbon exposure into a quantifiable, interest-bearing liability and pricing it via the Merton structural model, rather than treating climate risk as a stress-test scenario, as in the existing literature. This framework produces a market-consistent cost of carbon embedded directly in the firm’s debt yield, capturing the forward-looking probability of default driven by carbon obligations. By integrating observable carbon prices with firm-level asset dynamics, our approach links environmental liabilities to traditional credit pricing metrics, offering a novel bridge between sustainability accounting, structural credit risk, and corporate finance, enabling investors and regulators to quantify the financial impact of carbon policies in precise, yield-based terms.
This approach can be particularly valuable for financial innovators seeking to embed a firm’s carbon exposure directly into the yields of debt instruments, such as green bonds. Investors can thus differentiate firms not only by their nominal green credentials but also by the actual financial cost of their carbon footprint, enabling pricing, risk management, and portfolio allocation that align financial returns with climate impact.
DATA AND METHODOLOGY
We treat the carbon-related obligations of a firm, valued at prevailing market carbon prices, as an interest-bearing debt component, which is incorporated into the firm’s total liabilities. We then employ a Merton-type model to compute the market value of this carbon liability and derive the associated cost of debt.
To implement the carbon-adjusted Merton framework, we focus on the companies comprising the Índice Carbono Eficiente (ICO2) of B3, Brazil’s stock exchange. The ICO2 currently includes 58 companies that demonstrate superior carbon efficiency, measured as the ratio of GHG emissions to revenue relative to industry peers. The index provides a transparent and standardized measure of carbon performance, enabling a direct assessment of the financial impact of carbon liabilities on a representative sample of Brazilian publicly traded firms. For each company, we combine daily market data for equity prices, market capitalization, and volatility with publicly disclosed carbon emissions and financial statement information to calibrate the Merton model. Carbon liabilities are computed using reported emissions and market carbon prices, which are then incorporated into total firm liabilities for FY2024 to derive the carbon-adjusted debt yield.
The carbon emissions data for ICO2 companies are self-reported through standardized forms provided by B3, following the Greenhouse Gas Protocol. Firms report their direct emissions (Scope 1), indirect emissions from purchased energy (Scope 2), and optionally other indirect emissions (Scope 3), all converted into CO2e units to ensure comparability across sectors. B3 requires documentation and, in many cases, external verification to guarantee the reliability and consistency of the data. These emissions are then used to calculate carbon intensity metrics (emissions relative to revenue), which determine inclusion in the ICO2 index. For this study, we translate reported emissions into financial liabilities using market carbon prices, allowing the integration of environmental exposure into the Merton structural model framework.
Academic and practitioner literature highlights ICO2 as an innovative tool for investors seeking exposure to low-carbon companies in emerging markets, bridging corporate environmental responsibility and financial valuation (Lima et al, 2022; Silva et al., 2021). Its standardized methodology, mandatory reporting, and third-party verification of emissions data make it a credible and market-validated measure of corporate carbon performance, enabling research on carbon-adjusted financial metrics and risk pricing.
Let L denote the traditional liabilities of a firm and C the present value of its carbon emissions, calculated as C=E carbon*P carbon, where Ecarbon represents the firm’s total carbon emissions (in tons of CO2 equivalent, or tCO2e), and P carbon is a given market price of tCO2e, which we set at R$ 35/tCO2e for simplicity (https://www.msci.com/research-and-insights/blog-post/investor-grade-tools-to-aid-the-global-carbon-market). The carbon-adjusted liabilities are defined as L *=L+C.
Following Merton (1974), we modeled a firm’s equity as a call option on the firm’s assets with a strike price equal to total liabilities L or L *, when carbon is included. Let A0 be the current market value of firm assets, σA the asset volatility, r the risk-free rate (set at 15% p.a. for simplicity) (https://www.bcb.gov.br/controleinflacao/historicotaxasjuros), and T the debt maturity, set at one year. The value of risky debt D 0 is given by:
where Put(*) is the value of a European put option on the firm’s assets:
with
and N(*) denotes the cumulative distribution function of the standard normal distribution.
The yield to maturity y of the carbon-adjusted debt satisfies:
From this, we calculate the carbon-adjusted debt yield as:
Similarly, the yield on traditional liabilities (without carbon) is:
Then, the isolated yield cost of carbon can reasonably be defined as the difference ∆y=y *-y 0. This delta captures the incremental cost of carbon exposure, holding the firm’s asset dynamics fixed.
Because D 0 is a nonlinear function of assets, liabilities, and volatility, ∆y depends not only on the size of the carbon liability, but also on the pre-existing asset-to-debt ratio and asset volatility. Economically:
High leverage (L/A 0 ): small asset buffer relative to liabilities, so the put option value is higher, and the carbon-adjusted yield rises more sharply.
Low leverage (L/A 0 ): large asset buffer, so the carbon yield is smaller.
The economic intuition behind the carbon-adjusted yield is straightforward. In Merton’s (1974) framework, equity holders own a call option on firm assets: they receive the residual value if assets exceed liabilities at maturity, but can walk away if assets fall short. Debt holders, conversely, bear downside risk: they effectively sell a put option to equity holders. When we add carbon liabilities to the firm’s obligations, we raise the strike price of the equity call option. This has three interconnected effects: (1) the probability that assets fall below total obligations increases, raising default risk; (2) the value of the implicit put option embedded in risky debt rises, reducing the market value of debt; and (3) the yield required to compensate debt holders for this additional risk increases.
The carbon-adjusted yield Δy isolates the portion of this yield increase attributable specifically to carbon exposure. A firm with identical assets, volatility, and traditional leverage but zero carbon emissions would face yield y₀; the same firm with carbon liability C faces yield y*, and the difference Δy = y*- y₀ represents the financing cost of carbon. This cost is not linear in emissions: because the put option value is convex in leverage, carbon liabilities impose disproportionately higher yield penalties on firms that are already financially fragile. This interaction between carbon exposure and financial leverage is a key feature of our framework and distinguishes it from simple carbon intensity metrics.
The methodology does not just price carbon risk but also reveals interactions between capital structure and sustainability obligations. This allows investors and regulators to identify firms where carbon exposure materially affects the cost of capital, especially in highly leveraged sectors. Conceptually, it shows that sustainable finance and traditional corporate finance are intertwined, because the cost of carbon is amplified by financial fragility.
Empirical validation
As an additional empirical exercise, we explore the relationship between the stock returns of ICO2 constituents and market-based carbon price signals proxied by carbon-focused exchange-traded funds (ETFs). This approach allows us to examine whether the carbon intensity of each firm, and its associated carbon-adjusted debt yield, is reflected in equity market performance. Specifically, we regress daily or weekly returns of ICO2-listed companies on returns of ETFs tracking global carbon markets, controlling for market-wide factors. This framework enables the identification of potential financial transmission channels from carbon pricing to firm valuation, offering evidence on whether markets internalize carbon costs in a manner consistent with the Merton-based carbon liability framework.
We hypothesize an inverse relationship between firm carbon intensity (and carbon yield cost) and carbon ETF returns, implying that companies with higher carbon exposure experience relatively lower returns when carbon prices increase. This test serves as a market validation of the carbon-adjusted Merton model, connecting structural credit risk to observable market dynamics. Furthermore, it provides insights for investors on the pricing of carbon risk in equity portfolios, highlighting the potential for carbon-aware asset allocation strategies.
To explicitly connect to carbon intensity or the carbon-adjusted debt yield, we can extend the model as:
We estimate a pooled panel of daily BRL returns for ICO2 constituents with parsimonious controls and an FX-conditioned carbon channel. The controls absorb broad market and currency comovements: Ibovespa (R t IBOV ) proxies the local equity factor, S&P 500 (R t SP500 ) captures global risk, and USD/BRL (R t USDBRL ) nets out same-day exchange-rate moves that mechanically reprice USD-denominated assets and foreign revenues in BRL.
The firm-level ∆y i is the carbon-adjusted yield (time-invariant over our window) that summarizes each company’s carbon intensity/liability. Our triple interaction is the core test: because the carbon ETFs are USD-denominated, the BRL-relevant carbon shock is jointly determined by the ETF move and the FX move; the term (R t CARBON * ∆y i * R t USDBRL ) lets the carbon beta of a stock scale with both its carbon exposure and the FX state. Under our hypothesis, we expect θ < 0: when carbon prices rise in BRL terms, firms with higher ∆y i experience more negative equity returns, providing a market-based validation of the carbon-adjusted Merton framework.
All market data used in the regressions come from daily closes. ETF prices (carbon funds and controls) are pulled from EOD historical data (EODHD); FX is the USD/BRL spot rate obtained in R via quantmod. The carbon ETFs are futures-based allowance funds: KRBN.US (global basket dominated by EU ETS, plus North American programs), KCCA.US (California cap-and-trade, CCA futures), and KEUA.US (EU ETS, EUA futures). For broad equity controls, we use the ETFs SPY.US (S&P 500) and BOVA11.SA (Ibovespa). The sample spans 2021-10-01 to 2025-07-31, and all regressions are run at a daily frequency; returns are computed as log differences and aligned on common trading days. To capture energy-sector comovements, we form an equal-weight ‘energy factor’ from the USD-listed oil and gas ETFs available in the EODHD database (e.g., large, liquid U.S. energy broad and exploration/production funds1), using their daily returns; because these ETFs are USD-denominated, we include USD/BRL to account for FX when relating them to BRL stock returns.
A key limitation of this regression exercise stems from the nature of the ICO2 emissions data provided by B3. The exchange reports carbon emissions for index constituents as a single snapshot (of January 29, 2025), rather than as a time series. As a result, the carbon-adjusted debt yield for each firm remains static over the regression period, preventing the analysis from capturing pote ntial intra-year variations in emissions or dynamic adjustments to carbon risk. This limitation implies that the estimated sensitivity of stock returns to carbon ETF movements reflects cross-sectional differences in carbon exposure rather than temporal changes in firm-level carbon liabilities.
The direction of potential bias depends on emission trajectories. If firms have systematically reduced emissions since 2021, our snapshot-based Δy overstates their current carbon exposure during the early sample period, which would bias against finding significant effects. Conversely, if emissions have increased, we understate exposure. The snapshot also prevents us from testing whether markets respond to changes in carbon intensity over time, a dynamic that would provide stronger identification. Future research could address this limitation by incorporating annual or quarterly emissions data from Carbon Disclosure Project (CDP) (https://www.ibm.com/br-pt/think/topics/carbon-disclosure-project) disclosures or mandatory reporting frameworks, enabling panel estimation with time-varying Δy and event studies around emissions announcements.
Another related limitation concerns the ETF proxies for carbon price shocks. KRBN, KCCA, and KEUA track regulated allowance markets in the United States and Europe, which may imperfectly correspond to the carbon-related risks faced by Brazilian firms operating under distinct regulatory conditions. Brazil’s carbon market remains nascent and almost nonexistent, and firms’ exposure to international carbon prices operates primarily through trade competitiveness, supply chain requirements, and investor expectations rather than direct compliance obligations. This proxy mismatch may attenuate our estimates if Brazilian firms’ valuations respond more strongly to domestic policy signals than to international allowance prices.
To assess the robustness of our main findings, we conduct several econometric tests that examine the sensitivity of results to alternative modeling assumptions and sample characteristics. First, we compare our baseline firm-clustered standard errors with two-way clustering (firm and time) to address potential correlation in residuals across both dimensions. Second, we test the influence of outliers by applying 1%-99% winsorization to all return variables to determine whether results are driven by extreme market movements. Third, we examine temporal stability by estimating models over alternative sample periods, specifically a post-2022 subsample and a recent period covering 2023-2025, to assess whether the carbon-stock linkages have evolved over time.
RESULTS
Carbon-adjusted yields
The cross-sectional distribution of firms’ carbon-adjusted yields is tightly centered near zero but with a pronounced left tail, as represented in Table 1. Across 58 ICO2 constituents, the mean carbon yield is 3.87% p.a. with a standard deviation of 6.34%; the median is 0.96%, and the upper quartile is 0.14%. The worst spread reaches -32.20% p.a., producing strong negative skewness (-2.48) and leptokurtosis (excess kurtosis 6.97). In practical terms, most firms cluster around small carbon yields, but a non-trivial subset displays materially larger values that stretch the lower tail of the distribution.
These moments suggest carbon risk is not uniformly priced across the cross-section: many firms carry little carbon yield, while a few face substantial carbon-implied costs. This heavy-tailed pattern is consistent with heterogeneity in emissions intensity, abatement options, and sectoral exposure to carbon pricing.
Figure 1 suggests a positive cross-sectional association between firms’ baseline cost of debt (x-axis, Merton without carbon) and their carbon yield ∆y (y-axis): most observations with higher cost of debt (0.30-0.60) also show higher ∆y (0.02-0.20), while the bulk with lower cost of debt (0.12-0.20) cluster at small ∆y (0-0.02). Color shading indicates that more leveraged firms (yellow, higher liabilities/assets) tend to sit further to the right and higher up, consistent with leverage amplifying carbon-related costs in debt and equity channels. Bubble sizes (emissions/revenue) are often larger in the upper-right, hinting that more emission-intensive firms face both higher financing costs and larger carbon yields. A few points break the pattern (e.g., relatively high CoD but modest ∆y), underscoring heterogeneity by sector/firm, but the overall shape aligns with the hypothesis that carbon exposure and leverage are jointly associated with higher funding costs and carbon yield penalties.

Empirical results
For the regressions, across all specifications, the Ibovespa return loads at 0.99, indicating near one-for-one comovement with the local market, as expected. The USD/BRL return is negative and highly significant (-0.194 to -0.198, s.e.). Once we control for Ibovespa and FX, the S&P 500 coefficient is small and statistically indistinguishable from zero, suggesting little incremental explanatory power from U.S. market moves in this setup.
The coefficient on the carbon-adjusted yield (∆y) is significant at around -0.01, consistent with a cross-sectional return penalty for more carbon-exposed firms. Interpreting magnitudes: if ∆y is in decimal units, a firm with ∆y = 0.10 (10%) has, ceteris paribus, about a lower return per day (-11 to -12 bps). The carbon ETF × ∆y × USD/BRL term captures how a firm’s sensitivity to carbon-price shocks depends jointly on its carbon exposure and the same-day USD/BRL move. For KRBN and KCCA, the triple interaction is large, negative, and significant (-45.956 and -43.426, respectively). For KEUA, it is indistinguishable from zero.
The economic intuition favors our hypothesis: when the USD strengthens vs. BRL (positive USD/BRL return), high-∆y firms’ carbon beta declines; when the BRL appreciates, their carbon beta rises. The coefficients appear numerically large because they multiply two small daily quantities (FX return and ∆y). For example, with ∆y = 0.10 and a +0.5% FX move (0.005), KRBN’s triple term changes the carbon beta by about -5.956 × 0.10 × 0.005 = -0.023. If the carbon ETF itself rises 1% that day, this channel contributes roughly -2.3 bps to the stock return, which is economically modest but directionally meaningful. This pattern indicates that FX moves modulate the transmission of USD-denominated carbon price shocks into BRL equity returns, particularly for the global baskets (KRBN, KCCA). The absence of a KEUA (EU ETS) triple effect may reflect composition, coverage, or sample overlap differences.
The estimates line up with our hypothesis: firms with higher carbon-adjusted yields underperform when carbon prices rise in BRL terms. First, the cross-sectional penalty on carbon exposure is clear, so higher-∆y names earn lower average returns. Second, the FX-conditioned transmission of carbon shocks is exactly in the predicted direction: the carbon ETF × ∆y × USD/BRL term is large and negative for KRBN and KCCA, implying that when BRL-denominated carbon prices move up (i.e., the USD asset rises and/or the USD strengthens vs. BRL), high-∆y stocks load more adversely and their BRL returns fall. Together with expected signs on the controls (Ibovespa close to 1, USD/BRL negative), the results support the view that markets internalize carbon costs and that FX amplifies the pass-through of higher carbon prices into lower equity performance for more carbon-exposed firms.
To clarify the economic magnitude of the triple interaction, consider a concrete example. Take a firm at the 75th percentile of carbon exposure with Δy = 0.10 (a 10-percentage-point carbon-adjusted yield increment). Suppose that on a given trading day, the KRBN carbon ETF rises by 2% while the BRL appreciates by 1% against the USD. The triple interaction term contributes: −45.956 × 0.10 × 0.01 × 0.02 = −0.092%, or approximately −9 basis points to that day’s stock return. For comparison, a firm at the 25th percentile with Δy = 0.01 experiences only −0.9 basis points from the same shock.
Accumulated over time, these differentials become economically meaningful. This directional magnitude is comparable to documented ESG return differentials in developed markets (Bolton & Kacperczyk, 2021) and suggests that carbon exposure creates material performance dispersion within the Brazilian equity universe.
Robustness tests
The robustness tests (Table 3) confirm that the core finding is statistically stable but economically variable across specifications. The carbon ETF triple interaction term remains consistently negative and significant, ranging from -42.16 to -98.68, indicating that higher carbon-adjusted yields amplify the negative relationship between carbon ETF returns and Brazilian stock performance during periods of currency depreciation. However, the magnitude nearly doubles in the recent subsample (-98.68 vs. -44.36), suggesting strengthening market linkages. The control variables demonstrate expected behavior, with Ibovespa maintaining a near-unity beta and USD/BRL showing consistent negative exposure, while the energy interaction term exhibits sign switches across specifications. The dramatic improvement in explanatory power with winsorization (R² jumps from 9.5% to 25.3%) indicates that outliers substantially affect the relationship, even though this is robust.
DISCUSSION
Our evidence indicates that carbon exposure is priced in Brazilian equities in a manner consistent with a liability view of carbon. Cross-sectionally, the carbon-adjusted yield (∆y) exhibits a heavy left tail, implying that while most ICO2 firms face small carbon premia, a meaningful subset bears material carbon-implied financing costs. In pooled daily regressions, ∆y loads negatively and significantly on stock returns, and the FX-conditioned carbon channel, i.e., the triple interaction carbon ETF × ∆y × USD/BRL, is large, negative, and significant for KRBN and KCCA. These results suggest that when carbon prices rise in BRL terms, firms with higher carbon-adjusted debt costs underperform more. This is precisely the market-based mechanism our Merton translation predicts: higher carbon obligations enlarge the implicit put embedded in risky debt, raising the firm’s cost of debt and, ceteris paribus, lowering equity value (Merton, 1974; see also Galai et al., 2011; Gu et al., 2019; Reneby, 1998; Zhou & Zhang, 2020). The FX pass-through matters because the relevant shock for Brazilian investors is the BRL-denominated carbon move; the significant triple terms formalize that intuition.
These findings are aligned with the shadow carbon pricing literature, which views carbon exposure as a cost that should enter investment screening and hurdle rates (Aldy et al., 2021; Bento & Gianfrate, 2020; Nordhaus, 2017; Pindyck, 2019; Trinks et al., 2022). By converting emissions into a priced liability within a structural credit model, we move beyond scenario testing (Fuss et al., 2021) toward yield-based measurement that is directly comparable across firms and over time. The pattern that more leveraged firms cluster at higher ∆y and higher baseline debt costs resonates somehow with the stranded-assets channel (Caldecott et al., 2013; Carney, 2015; McGlade & Ekins, 2015): financial fragility amplifies the valuation impact of prospective carbon constraints, turning carbon-intensive assets into contingent liabilities (Semieniuk et al., 2022).
At the same time, several caveats temper interpretation. First, the carbon-adjusted yield is time-invariant in our window because ICO2 provides a point-in-time snapshot of emissions; thus, identification is primarily cross-sectional, not dynamic. Second, ETF-based carbon prices are proxies for firms’ regulatory exposure: KRBN’s global basket and KCCA’s California coverage may imperfectly map to Brazilian firms’ true policy set, which could explain the muted KEUA triple effect (coverage and trading-hours misalignment). Third, endogeneity, e.g., firms with deteriorating fundamentals both emitting more and earning lower returns, cannot be fully ruled out. Future work could bring panel variation in emissions, richer controls for sectoral policy exposure, and high-frequency tests around policy events to sharpen causality (Bumpus & Liverman, 2008; Downar et al., 2021). Despite these limitations, our results provide market-consistent evidence that carbon exposure behaves like a priced liability: it raises debt yields and is associated with lower equity performance when BRL-denominated carbon prices increase, thereby bridging structural credit risk, carbon accounting, and asset-pricing perspectives.
While our results are consistent with markets pricing carbon as a liability, we cannot fully rule out reverse causality or omitted variable bias. Firms with deteriorating fundamentals may simultaneously exhibit higher emissions and weaker stock performance, generating a spurious correlation between Δy and returns. Several features of our design mitigate but do not eliminate this concern. First, Δy is measured from a single snapshot and thus cannot be driven by contemporaneous return dynamics within our sample period. Second, the significant triple interaction (carbon ETF × Δy × FX) suggests that the relationship operates through a carbon-specific channel: if Δy merely proxied for general firm distress, we would not expect it to interact specifically with carbon price movements.
Nevertheless, sharper identification awaits future research. Instrumental variable approaches could exploit exogenous variation in carbon exposure, such as industry-level regulatory stringency or geographic proximity to pollution monitoring. Event-study designs around discrete policy shocks - such as the EU carbon border adjustment mechanism (CBAM) announcements, Brazil’s Law No. 15.042/2024 (Lei n. 15.042, 2024) establishing the regulated carbon market (SBCE), or inclusion in climate disclosure mandates - could isolate the causal effect of carbon-related news on differentially exposed firms. Panel data with time-varying emissions would enable difference-in-differences designs comparing firms that reduced emissions against those that did not.
Our analysis treats carbon exposure as a financial risk, but carbon pricing is fundamentally a policy instrument designed to transform production patterns rather than merely a market variable to be hedged. A firm that invests in abatement technologies, improves energy efficiency, or transitions to renewable inputs reduces its carbon liability C, which lowers L*, which decreases Δy, which reduces its cost of capital. This transmission mechanism from carbon policy to capital allocation (through yield spreads) is precisely the channel through which carbon pricing is intended to operate.
This perspective connects our findings to the broader literature on environmental policy and firm behavior. The Porter hypothesis (Porter & van der Linde, 1995) posits that well-designed environmental regulation can stimulate innovation and ultimately enhance competitiveness. In our framework, rising carbon prices increase Δy for emitters, raising their cost of capital and therefore reducing the net present value of carbon-intensive projects, while simultaneously improving the relative attractiveness of low-carbon investments. Firms that anticipate this dynamic may proactively reduce emissions to lower their cost of capital, a rational strategic response that our static model captures in cross-section but cannot track dynamically.
CONCLUSION
Our study reframes corporate carbon exposure as a priced liability by embedding it in a Merton-style structural model and reading the resulting carbon-adjusted yield (∆y) as an incremental cost of debt. Cross-sectionally, ∆y is tightly centered near zero but exhibits a heavy left tail, indicating that a subset of firms faces material carbon-implied financing costs. In pooled daily regressions for ICO2 constituents, ∆y is negatively associated with equity returns, and the FX-conditioned carbon channel (carbon ETF × ∆y × USD/BRL) is large and negative, implying that when BRL-denominated carbon prices rise, high-∆y firms underperform more. Together with the expected signs on market controls, these findings show that Brazilian equity markets partially internalize carbon obligations: carbon exposure raises debt costs and coincides with lower equity performance when carbon prices move against BRL investors.
Beyond risk measurement, our findings carry implications for climate policy and corporate strategy. The Δy metric quantifies the financial incentive that carbon pricing creates for emissions reduction: a firm that halves its carbon footprint would, ceteris paribus, substantially reduce its carbon-adjusted yield increment and lower its cost of capital accordingly. As emerging economies implement newly regulated carbon markets and strengthen climate disclosure requirements, policymakers can use Δy distributions to assess transition risk concentration across sectors and to calibrate carbon pricing mechanisms that generate reallocation incentives. For corporate managers, our research provides a concrete link between sustainability investments and capital costs, enabling financially grounded evaluation of abatement projects. For investors, the documented FX-conditioned carbon channel clarifies when global carbon price movements matter most for BRL-denominated portfolios, informing both risk management and alpha generation strategies in emerging market equities. While our analysis captures the pricing of carbon as a liability, the ultimate policy objective of economic decarbonization requires that this pricing signal translate into strategic firm responses.
REFERENCES
-
Aldy, J. E., Pizer, W. A., & Akimoto, K. (2021). Comparing emissions mitigation efforts across countries. Climate Policy, 17(4), 501-515. https://doi.org/10.1080/14693062.2015.1119098
» https://doi.org/10.1080/14693062.2015.1119098 -
Bebbington, J., & Larrinaga‐González, C. (2008). Carbon trading: Accounting and reporting issues. European Accounting Review, 17(4), 697-717. https://doi.org/10.1080/09638180802489162
» https://doi.org/10.1080/09638180802489162 -
Bento, N., & Gianfrate, G. (2020). Determinants of internal carbon pricing. Energy Policy, 143, 111499. https://doi.org/10.1016/j.enpol.2020.111499
» https://doi.org/10.1016/j.enpol.2020.111499 -
Bolton, P., & Kacperczyk, M. (2021). Do investors care about carbon risk? Journal of Financial Economics, 142(2), 517-549. https://doi.org/10.1016/j.jfineco.2021.05.008
» https://doi.org/10.1016/j.jfineco.2021.05.008 -
Bolton, P., & Kacperczyk, M. (2023). Global pricing of carbon-transition risk. Journal of Finance, 78(6), 3677-3754. https://doi.org/10.1111/jofi.13272
» https://doi.org/10.1111/jofi.13272 -
Bumpus, A. G., & Liverman, D. M. (2008). Accumulation by decarbonization and the governance of carbon offsets. Economic Geography, 84(2), 127-155. https://doi.org/10.1111/j.1944-8287.2008.tb00401.x
» https://doi.org/10.1111/j.1944-8287.2008.tb00401.x -
Caldecott, B., Howarth, N., & McSharry, P. (2013). Stranded assets in agriculture: Protecting value from environment-related risks Smith School of Enterprise and the Environment, University of Oxford. https://www.smithschool.ox.ac.uk/sites/default/files/2022-03/stranded-assets-agriculture-report-final.pdf
» https://www.smithschool.ox.ac.uk/sites/default/files/2022-03/stranded-assets-agriculture-report-final.pdf -
Caldecott, B., Harnett, E., Cojoianu, T., Kok, I., & Pfeiffer, A. (2016). Stranded assets: Environmental drivers, societal challenges, and supervisory responses. Financial Stability Review, Banque de France, 20, 153-160. https://doi.org/10.1146/annurev-environ-012220-101430
» https://doi.org/10.1146/annurev-environ-012220-101430 -
Carney, M. (2015, September 29). Breaking the tragedy of the horizon -- climate change and financial stability [Speech]. Bank of England. https://www.bankofengland.co.uk/speech/2015/breaking-the-tragedy-of-the-horizon-climate-change-and-financial-stability
» https://www.bankofengland.co.uk/speech/2015/breaking-the-tragedy-of-the-horizon-climate-change-and-financial-stability -
Delis, M. D., Greiff, K., & Ongena, S. (2019). Being stranded with fossil fuel reserves? Climate policy risk and the pricing of bank loans. EBRD Working Paper https://doi.org/10.1111/fmii.12189
» https://doi.org/10.1111/fmii.12189 -
Downar, B., Ernstberger, J., Reichelstein, S., Schwenen, S., & Zaklan, A. (2021). The impact of carbon disclosure mandates on emissions and financial operating performance. Review of Accounting Studies, 26(3), 1137-1175. https://doi.org/10.1007/s11142-021-09611-x
» https://doi.org/10.1007/s11142-021-09611-x - Ehlers, T., Mojon, B., & Packer, F. (2022). Green bonds and carbon emissions: Exploring the case for a rating system at the firm level. BIS Quarterly Review, September.
-
Fischer, T. (2010). No-arbitrage pricing under cross-ownership (arXiv preprint No. arXiv:1005.0768). https://www.bis.org/publ/qtrpdf/r_qt2009c.pdf
» https://www.bis.org/publ/qtrpdf/r_qt2009c.pdf - Fuss, S., Lambin, E., & Zeitz, C. (2021). Carbon might be your company’s biggest financial liability. Harvard Business Review
- Galai, D., Landskroner, Y., Raviv, A., & Wiener, Z. (2011). A balance sheet approach for sovereign debt. In I. Venezia & Z. Wiener (Eds.), Bridging the GAAP: Recent Advances in Finance and Accounting (pp. 123-138). World Scientific.
-
Ge, Z., Liu, Q., & Wei, Z. (2024). Assessment of bank risk exposure considering climate transition risks. Finance Research Letters, 67(Part A), 105903. https://doi.org/10.1016/j.frl.2024.105903
» https://doi.org/10.1016/j.frl.2024.105903 -
Görgen, M., Jacob, A., Nerlinger, M., Riordan, R., Rohleder, M., & Wilkens, M. (2020). Carbon risk. SSRN Working Paper https://dx.doi.org/10.2139/ssrn.2930897
» https://dx.doi.org/10.2139/ssrn.2930897 -
Gray, D. F., & Malone, S. M. (2012). Further extensions and applications of contingent claims analysis. In Macrofinancial Risk Analysis (pp. 73-89). Wiley. https://doi.org/10.1002/9781118467428.ch6
» https://doi.org/10.1002/9781118467428.ch6 -
Gu, M., Zhou, T., & Ying, Y. (2019). A price formula of deposit insurance based on Merton deposit insurance pricing model. DEStech Transactions on Environment, Energy and Earth Sciences https://doi.org/10.12783/dteees/icepe2019/28954
» https://doi.org/10.12783/dteees/icepe2019/28954 -
Hale, T., Smith, S. M., Black, R., Cullen, K., Fay, B., Lang, J., & Mahmood, S. (2021). Assessing the rapidly-emerging landscape of net zero targets. Climate Policy, 22(1), 18-29. https://doi.org/10.1080/14693062.2021.2013155
» https://doi.org/10.1080/14693062.2021.2013155 -
Jobst, A. A. (2002). The pricing puzzle: The default term structure of collateralised loan obligations (CFS Working Paper No. 2002/14). Center for Financial Studies. https://www.econstor.eu/bitstream/10419/25387/1/364402490.PDF
» https://www.econstor.eu/bitstream/10419/25387/1/364402490.PDF -
Klaassen, L., & Stoll, C. (2021). Harmonizing corporate carbon footprints. Nature Communications, 12, 1-13. https://doi.org/10.1038/s41467-021-26349-x
» https://doi.org/10.1038/s41467-021-26349-x -
Kleimeier, S., & Viehs, M. (2021). Carbon disclosure, emission levels, and the cost of debt. SSRN Working Paper https://dx.doi.org/10.2139/ssrn.2719665
» https://dx.doi.org/10.2139/ssrn.2719665 -
Koch, N., & Bassen, A. (2013). Valuing the carbon exposure of European utilities: The role of fuel mix, permit allocation and replacement investments. Energy Economics, 36, 431-443. https://doi.org/10.1016/j.eneco.2012.09.019
» https://doi.org/10.1016/j.eneco.2012.09.019 -
Lei no. 15.042 (2024). Lei no. 15.042 de 11 de dezembro de 2024. Institui o Sistema Brasileiro de Comércio de Emissões de Gases de Efeito Estufa (SBCE); e altera as Leis nºs 12.187, de 29 de dezembro de 2009, 12.651, de 25 de maio de 2012 (Código Florestal), 6.385, de 7 de dezembro de 1976 (Lei da Comissão de Valores Mobiliários), e 6.015, de 31 de dezembro de 1973 (Lei de Registros Públicos). https://www.planalto.gov.br/ccivil_03/_ato2023-2026/2024/lei/l15042.htm?
» https://www.planalto.gov.br/ccivil_03/_ato2023-2026/2024/lei/l15042.htm? -
Lima, C. R. M. de, Barbosa, S. B., Sobrosa, R. de C. Neto, Bazil, D. G., & Guerra, J. B. S. O. de A. (2022). Corporate financial performance: a study based on the Carbon Efficient Index (ICO2) of Brazil stock exchange. Environment, Development and Sustainability, 24(3), 4323-4354. https://doi.org/10.1007/s10668-021-01617-4
» https://doi.org/10.1007/s10668-021-01617-4 -
Löschenbrand, S., Maier, M., Millischer, L., & Resch, F. (2025). Credit risk where it’s due: Carbon pricing and firm defaults (IMF Staff Discussion Note No. WP/25/62). International Monetary Fund. https://doi.org/10.5089/9798229005777.001
» https://doi.org/10.5089/9798229005777.001 -
McGlade, C., & Ekins, P. (2015). The geographical distribution of fossil fuels unused when limiting global warming to 2°C. Nature, 517(7533), 187-190. https://doi.org/10.1038/nature14016
» https://doi.org/10.1038/nature14016 -
Merton, R. C. (1974). On the pricing of corporate debt: The risk structure of interest rates. Journal of Finance, 29(2), 449-470. https://doi.org/10.2307/2978814
» https://doi.org/10.2307/2978814 -
Nordhaus, W. D. (2017). Revisiting the social cost of carbon. Proceedings of the National Academy of Sciences, 114(7), 1518-1523. https://doi.org/10.1073/pnas.1609244114
» https://doi.org/10.1073/pnas.1609244114 -
Oestreich, A. M., & Tsiakas, I. (2015). Carbon emissions and stock returns: Evidence from the EU Emissions Trading Scheme. Journal of Banking & Finance, 58, 294-308. https://doi.org/10.1016/j.jbankfin.2015.05.005
» https://doi.org/10.1016/j.jbankfin.2015.05.005 -
Pindyck, R. S. (2019). The social cost of carbon revisited. Journal of Environmental Economics and Management, 94, 140-160. https://doi.org/10.1016/j.jeem.2019.02.003
» https://doi.org/10.1016/j.jeem.2019.02.003 -
Porter, M. E., & van der Linde, C. (1995). Toward a new conception of the environment-competitiveness relationship. Journal of Economic Perspectives, 9(4), 97-118. https://doi.org/10.1257/jep.9.4.97
» https://doi.org/10.1257/jep.9.4.97 -
Ranganathan, J., Corbier, L., Bhatia, P., Schmitz, S., Gage, P., & Oren, K. (2004). The greenhouse gas protocol: A corporate accounting and reporting standard World Resources Institute and World Business Council for Sustainable Development. https://ghgprotocol.org/sites/default/files/standards/ghg-protocol-revised.pdf
» https://ghgprotocol.org/sites/default/files/standards/ghg-protocol-revised.pdf -
Reichelstein, S. (2024). Corporate carbon accounting: Balance sheets and flow statements. Review of Accounting Studies, 29(3), 2125-2156. https://doi.org/10.1007/s11142-024-09830-y
» https://doi.org/10.1007/s11142-024-09830-y -
Reinders, H. J., Schoenmaker, D., & van Dijk, M. A. (2023). A finance approach to climate stress testing. Journal of International Money and Finance, 131, 102797. https://doi.org/10.1016/j.jimonfin.2022.102797
» https://doi.org/10.1016/j.jimonfin.2022.102797 - Reneby, J. (1998). Pricing corporate debt [Doctoral dissertation]. Stockholm School of Economics.
-
Seltzer, L. H., Starks, L., & Zhu, Q. (2022). Climate regulatory risk and corporate bonds. NBER Working Paper https://www.newyorkfed.org/medialibrary/media/research/staff_reports/sr1014.pdf
» https://www.newyorkfed.org/medialibrary/media/research/staff_reports/sr1014.pdf -
Semieniuk, G., Campiglio, E., Mercure, J.-F., Volz, U., & Edwards, N. R. (2022). Stranded fossil-fuel assets translate to major losses for investors in advanced economies. Nature Climate Change, 12(6), 532-538. https://doi.org/10.1038/s41558-022-01356-y
» https://doi.org/10.1038/s41558-022-01356-y -
Silva, R., Almeida, F., & Santos, P. (2021). Carbon efficiency and emerging market equity performance: Evidence from Brazilian listed companies. Sustainable Finance Review, 3(2), 45-61. https://doi.org/10.1016/j.jenvman.2025.124698
» https://doi.org/10.1016/j.jenvman.2025.124698 -
Tang, S., & Demeritt, D. (2018). Climate change and mandatory carbon reporting: Impacts on business process and performance. Business Strategy and the Environment, 27(4), 437-455. https://doi.org/10.1002/bse.1985
» https://doi.org/10.1002/bse.1985 -
Tilloca, D. (2018). A risk-neutral approach for the evaluation of NPLs. Advanced Risk & Portfolio Management Research Paper Series https://ssrn.com/abstract=2996565
» https://ssrn.com/abstract=2996565 -
Trinks, A., Mulder, M., & Scholtens, B. (2022). External carbon costs and internal carbon pricing. Renewable and Sustainable Energy Reviews, 168, 112780. https://doi.org/10.1016/j.rser.2022.112780
» https://doi.org/10.1016/j.rser.2022.112780 -
World Business Council for Sustainable Development, & World Resources Institute. (2011). Corporate value chain (Scope 3) accounting and reporting standard World Business Council for Sustainable Development, World Resources Institute. https://pdf.wri.org/ghgp_corporate_value_chain_scope_3_standard.pdf
» https://pdf.wri.org/ghgp_corporate_value_chain_scope_3_standard.pdf -
World Bank. (2024). State and trends of carbon pricing 2024 World Bank Group. https://openknowledge.worldbank.org/entities/publication/b0d66765-299c-4fb8-921f-61f6bb979087
» https://openknowledge.worldbank.org/entities/publication/b0d66765-299c-4fb8-921f-61f6bb979087 -
Zhou, Q., & Zhang, X. (2020). Pricing equity warrants in Merton jump-diffusion model with credit risk. Physica A: Statistical Mechanics and its Applications, 557, 124883. https://doi.org/10.1016/j.physa.2020.124883
» https://doi.org/10.1016/j.physa.2020.124883
-
Funding
The authors stated that there was no funding for the research in this article.
-
Plagiarism Check
RAC maintains the practice of submitting all documents approved for publication to the plagiarism check, using specific tools, e.g.: iThenticate.
-
Peer Review Method
This content was evaluated using the double-blind peer review process. The disclosure of the reviewers’ information on the first page, as well as the Peer Review Report, is made only after concluding the evaluation process, and with the voluntary consent of the respective reviewers and authors.
-
Data Availability
RAC encourages data sharing but, in compliance with ethical principles, it does not demand the disclosure of any means of identifying research subjects, preserving the privacy of research subjects. The practice of open data is to enable the reproducibility of results, and to ensure the unrestricted transparency of the results of the published research, without requiring the identity of research subjects.
-
Cite as:
Gil, T., & Mendes-da-Silva, W. (2026). Carbon liabilities are priced: Carbon-adjusted debt predicts underperformance. Revista de Administração Contemporânea, 30(3), e250354. https://doi.org/10.1590/1982-7849rac2026250354.en
-
JEL Code:
G12, G13, G32, Q54, Q58, M41
-
Peer Review Report:
The disclosure of the Peer Review Report was not authorized by its reviewers.
-
1
XLE.US - Energy Select Sector SPDR (U.S. large-cap energy)XOP.US - SPDR S&P Oil & Gas Exploration & ProductionVDE.US - Vanguard EnergyIYE.US - iShares U.S. EnergyFENY.US - Fidelity MSCI EnergyOIH.US - VanEck Oil Services (oilfield services)XES.US - SPDR S&P Oil & Gas Equipment & ServicesIEO.US - iShares U.S. Oil & Gas E&PIXC.US - iShares Global Energy (global exposure)CRAK.US - VanEck Oil Refiners
Edited by
-
Editor-in-chief:
Paula Chimenti (Universidade Federal do Rio de Janeiro, COPPEAD, Brazil) https://orcid.org/0000-0002-6492-4072
-
Associate Editor:
Cristiana Leal (Universidade do Minho, Portugal) https://orcid.org/0000-0003-3731-0240
RAC encourages data sharing but, in compliance with ethical principles, it does not demand the disclosure of any means of identifying research subjects, preserving the privacy of research subjects. The practice of open data is to enable the reproducibility of results, and to ensure the unrestricted transparency of the results of the published research, without requiring the identity of research subjects.

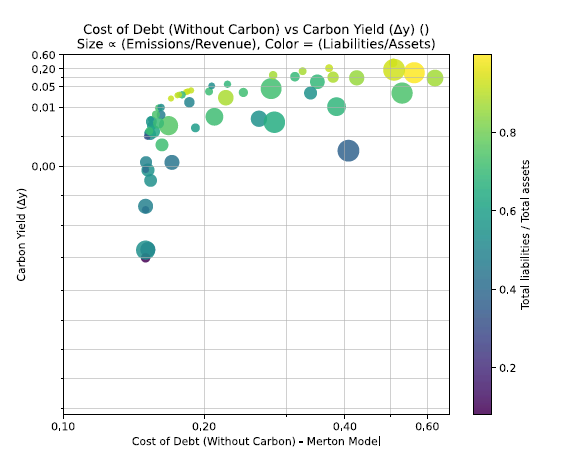 Source: Elaborated by the authors. Note. Scatter plot of firms’ baseline cost of debt (x-axis, Merton model without the carbon component, in decimals) against their carbon yield Δy (y-axis, carbon-adjusted increment from the Merton framework, in decimals). Each bubble’s size is proportional to emissions (tCO₂e)/revenues (BRL mn), and the color shows leverage (total liabilities/total assets). Cross-section includes ICO2 constituents with non-missing fields from the project’s compiled sheet (latest snapshot); axes are shown in levels (not log-transformed). Bubble areas are linearly rescaled for readability. Data: firm fundamentals and emissions from the ICO2 dataset; Merton-based measures are computed as described in the text.


