 The effect of organizational inertia on the adoption of big data analytics
Abstract
Purpose This research aims to examine the impact of organizational inertia (OI) on the adoption of big data analytics (BDA), considering OI as a second-order formative construct composed of insight inertia, action inertia and psychological inertia. The study also explores the moderating effect of department leader power on the relationship between OI and BDA adoption.
Design/methodology/approach The study uses a mixed-methods approach, combining quantitative partial least squares structural equation modelling (PLS-SEM) analysis with qualitative interviews, highlighting BDA’s greater susceptibility to internal inertial forces than other IT technologies, due to its emphasis on decision-making.
Findings Hypothesis testing using PLS-SEM demonstrates significant contributions from these OI dimensions and confirms a negative relationship between OI and BDA adoption, moderated positively by department leader power.
Social implications Overcoming OI constrains BDA adoption in Latin America. Strengthening data-driven capabilities improves service efficiency, innovation and competitiveness, which enhances employment quality and access to better services. These advances contribute to inclusive development and support SDG 9 and SDG 8.
Originality/value This study contributes to understanding and informing strategies to overcome organizational resistance, promote BDA adoption and advance digital transformation to improve productivity and societal outcomes in Latin America.
Big data analytics; BDA; Organizational inertia; IT adoption; Innovation
O efeito da inércia organizacional na adoção da analítica de big data
Objetivo Esta pesquisa tem como objetivo examinar o impacto da inércia organizacional (IO) na adoção de Big Data Analytics (BDA), considerando a IO como um construto formativo de segunda ordem composto por inércia cognitiva, inércia de ação e inércia psicológica. O estudo também explora o efeito moderador do poder do líder do departamento na relação entre a IO e a adoção de BDA.
Metodologia/abordagem O estudo emprega uma abordagem de métodos mistos, combinando a análise quantitativa do PLS-SEM com entrevistas qualitativas, destacando a suscetibilidade distinta da BDA às forças inerciais internas em comparação com outras tecnologias de TI devido à sua ênfase na tomada de decisões.
Resultados Os testes de hipóteses utilizando PLS-SEM demonstram contribuições significativas dessas dimensões e confirmam uma relação negativa entre a IO e a adoção da BDA, moderada positivamente pelo poder do líder departamental.
Implicações sociais Superar a inércia organizacional limita a adoção de Big Data Analytics (BDA) na América Latina. O fortalecimento das capacidades orientadas por dados melhora a eficiência dos serviços, a inovação e a competitividade, o que aprimora a qualidade do emprego e o acesso a melhores serviços. Esses avanços contribuem para o desenvolvimento inclusivo e apoiam os ODS 9 e 8.
Originalidade/valor Este estudo contribui para compreender e orientar estratégias para superar a resistência organizacional, promover a adoção de BDA e avançar na transformação digital para melhorar a produtividade e os resultados sociais na América Latina.
Analítica de big data; BDA; Inércia organizacional; Adoção de TI; Inovação
Introduction
Information is now a strategic resource that generates value in private and social spheres (UNCTAD, 2021). Adopting digital technologies is critical to narrowing productivity gaps between Latin American countries and developed nations by creating new sources of growth and quality jobs (Vilgis et al., 2023). Latin American countries continue to face structural challenges that hinder the adoption of data-intensive technologies, including big data analytics (BDA) (ECLAC, 2022).
Despite the importance of data use and BDA, the main obstacles to becoming a data-driven rather than a technological organization are human factors, such as people, culture, processes and organization (Davenport and Bean, 2023). Establishing a data-driven culture poses both an objective and a challenge, as data executives concentrate on initiatives to modify organizational behaviors and attitudes (Brown, 2023).
BDA differs from traditional IT technologies in that it operates as a service rather than an integrated operational process. Unlike enterprise resource planning systems that connect activities across departments and directly affect financial outcomes (Babu and Sastry, 2014), BDA enhances specific operations, such as customer identification and improved offerings (Hung et al., 2020), and fosters satisfaction and loyalty (Gopal et al., 2022). This service orientation engenders resistance to change because organizations perceive BDA as separate from core processes (Mikalef et al., 2021).
Research on resistance to BDA adoption primarily addresses individual-level factors, while studies at the organizational-level remain limited. For instance, Shahbaz et al. (2019) examine the gap between intention to use and actual BDA use, while Mikalef et al. (2021) explore inertial forces during BDA deployment. Recent studies have examined process-level drivers of BDA adoption success from a value-chain perspective, highlighting differences between internal and external value-chains (El-Haddadeh et al., 2025). Further research has underscored the need for data-driven dynamic capabilities in emerging markets to enable digital transformation through knowledge-sharing and integration mechanisms (Anning-Dorson et al., 2025). In addition, in BDA adoption, cultural factors influence the extent to which organizations resist or support digital transformation (Orero-Blat et al., 2025). Organizational inertia (OI) refers to resistance to environmental changes and comprises perceptual, action and psychological dimensions (Godkin and Allcorn, 2008). Much of the existing literature on BDA adoption and OI remains qualitative, limiting generalizability and cross-contextual insights. Prior literature seldom integrates these perspectives on BDA adoption with an organizational-level conceptualization of OI as a multi-dimensional construct, particularly in the Latin American context. Addressing this gap can provide strategies to overcome internal resistance and advance digital transformation.
The objective of this research is to examine the impact of OI on BDA adoption, treating OI as a second-order formative construct composed of perceptual, action and psychological dimensions. The study also explores the moderating role of department leader power on this relationship, contributing to a deeper understanding of organizational resistance to innovation.
This research contributes to the literature in several ways. First, it attempts to explain, from an organizational viewpoint, the low BDA adoption rates and associated difficulties, as BDA is different from other information technologies (ITs). Second, the use of OI based on evolutionary theory explains this resistance to adoption and expands the boundaries of this theory to the topic of advanced IT. Third, this research introduces a new model linking OI and BDA adoption, with the novel inclusion of the archetype of the department leader’s power as a moderator, expanding the literature on BDA, IT and fundamental organizational theories. Fourth, it validates the measurement model for OI, establishing its dimensions as a formative second-order construct.
Literature review
A literature review on BDA adoption (Aboelmaged and Mouakket, 2020) indicates that prior research on firm-level BDA adoption examines individual behaviors and perceptions while neglecting structural and strategic mechanisms. This focus reveals a gap in understanding organizational-level determinants and their integration within broader adoption frameworks. Prior research identifies organizational determinants such as organizational encouragement, expectations and size (Yu et al., 2022). Other studies report factors including knowledge use and sharing, collaboration, human capital, change management, managerial, infrastructure and data capabilities, networks, user-technology interactions and task and technology characteristics (Aboelmaged and Mouakket, 2020). Additional factors include tangible resources and workforce skills (Chen et al., 2024), top management support, organizational readiness and data-driven culture (Babalghaith and Aljarallah, 2024).
Relevant literature highlights the influence of OI on IT constructs. OI affects corporate digital entrepreneurship (Li et al., 2023), impacts service member creativity (Alkayid et al., 2022), shapes business model innovation and open innovation (Moradi et al., 2021), influences organizational agility and IT ambidexterity (Zhen et al., 2021) and determines business model innovation and organizational learning (Huang et al., 2020).
Some studies use OI as a moderator in relationships, including the dynamic capabilities of SMEs and organizational performance (Nedzinskas et al., 2013). Research identifies a relationship between behavioral intentions to use BDA and actual BDA use, highlighting the moderating role of resistance to change (Shahbaz et al., 2019), which can be considered a predecessor of psychological inertia. A qualitative study reports that certain inertia forces can impede the assimilation of BDA as dynamic capabilities emerge (Mikalef et al., 2021). Recent studies on BDA adoption examine value chain process-level drivers (El-Haddadeh et al., 2025), cultural influences on BDA capabilities (Orero-Blat et al., 2025), and dynamic capabilities in emerging markets (Anning-Dorson et al., 2025). These studies are presented in Table 1.
In sum, existing research has examined OI’s influence on IT constructs; however, it has not demonstrated its impact on BDA or the moderating effect of departmental leader power. This review underscores the originality of this study.
Theoretical framework and hypotheses
Traditionally, the concept of inertia appears in two distinct theoretical perspectives. The adaptationist view frames inertia as the capacity to adjust to significant environmental changes, where continuous transformation enhances long-term performance. Inertia functions as a prerequisite for change rather than a consequence (Nedzinskas et al., 2013). The ecological view emphasizes the temporality of change, stating that organizational survival depends on whether learning and adaptation progress faster than environmental shifts. This study applies the ecological perspective as the theoretical lens for conceptualizing OI.
Within this framework, organizations integrate environmental uncertainty into their capabilities, strategies and structures (Hannan and Freeman, 1984). Effective adaptation requires synchronizing learning and response with the pace of external changes. Strategic readiness depends on the organization’s ability to address uncertainty through the dimensions of OI, which shape direction and performance (Hedberg and Ericson, 1997).
Prior studies have used resource-based theory, dynamic capabilities theory and TAM-TTF to examine BDA adoption (El-Haddadeh et al., 2025; Anning-Dorson et al., 2025; Shahbaz et al., 2019). These conceptual frameworks do not examine mechanisms for addressing organizational resistance, which supports the analytical relevance of OI as a complementary lens. This study operationalizes OI through the three dimensions: perceptual, action and psychological (Godkin and Allcorn, 2008).
Dimensions of organizational inertia
Perceptual inertia.
Perceptual inertia arises when a discrepancy exists between critical environmental changes and the organization’s recognition of these changes (Godkin and Allcorn, 2008). It reflects a limited comprehension of shifts in the organizational environment. Management lacks an adequate interpretation of internal and external signals necessary to adapt behaviors in response to change (Hedberg and Ericson, 1997). Organization members demonstrate insufficient understanding of the nature and causes of environmental developments. This inertia constrains the organization’s learning processes (Huang et al., 2013).
Action inertia.
Action inertia arises after managerial awareness of environmental change, when the response is delayed, and outcomes remain misaligned with current conditions (Godkin and Allcorn, 2008). It follows environmental analysis and reflects ineffective implementation despite the recognized need (Hedberg and Ericson, 1997). Limited role learning contributes to this inertia; staff may receive training but fail to act on the knowledge acquired (Godkin and Allcorn, 2008). Audience learning occurs when individuals adjust their behavior based on knowledge but cannot influence others to do the same (Huang et al., 2013).
Psychological inertia.
Psychological inertia arises when the organization exhibits stress, anxiety and defensive attitudes that resist change, resulting in individual and group dysfunctions. A lack of psychological motivation reinforces a preference for the status quo, undermining organizational performance (Godkin and Allcorn, 2008).
OI is modelled as a second-order formative construct defined by three distinct dimensions: perceptual, action and psychological. Perceptual inertia captures gaps in recognizing environmental change; action inertia reflects delays in managerial response; psychological inertia denotes resistance to change linked to stress or defensiveness (Godkin and Allcorn, 2008). These IO dimensions are non-interchangeable and causally define OI. In the case of OI, the formative structure reflects the multidimensional and independent contributions of each component, in contrast to a reflective measurement structure where indicators result from the latent factor. This formative approach aligns with the theoretical complexity of OI and its role in organizational adaptation and performance.
Hypotheses
BDA adoption refers to the organizational process of integrating advanced data-driven technologies and practices to enhance decision-making, innovation and performance by leveraging data as a strategic resource (Aboelmaged and Mouakket, 2020; Yu et al., 2022; Grover et al., 2018). BDA adoption requires significant organizational change, integrating advanced data-driven technologies to enhance decision-making and performance (Aboelmaged and Mouakket, 2020). Organizational support, resource readiness and leadership commitment drive successful adoption (Yu et al., 2022; Babalghaith and Aljarallah, 2024). Resistance to change, resource constraints and cultural barriers often delay BDA implementation (Mikalef et al., 2021). Effective leadership and resource mobilization are critical for overcoming inertia during the adoption process (Grover et al., 2018).
Therefore, organizational members must understand what BDA is to adopt it. However, a global talent shortage has peaked, with 77% of companies reporting difficulties filling IT vacancies (ManpowerGroup, 2023). This talent shortage indicates a general lack of specialist knowledge, translating into a lack of awareness of the subject; previous research shows that the lack of skills of technical employees is a barrier to BDA adoption (Mikalef et al., 2021). Similarly, previous studies have shown that for companies to adopt BDA, they must be aware of the benefits it offers (Grover et al., 2018). In prior studies, the relative advantage of this technology has been identified as a precursor to BDA adoption (Aboelmaged and Mouakket, 2020). Without knowledge of these benefits, BDA adoption is not possible. Consequently, when management remains isolated due to a lack of awareness of environmental changes, it is in a state of perceptual inertia, a dimension of OI (Godkin and Allcorn, 2008), and it cannot adopt BDA. As a result, the following hypothesis is proposed:
H1.Perceptual inertia is a positive first-order dimension contributing to the second-order construct of OI in BDA adoption.
BDA adoption often encounters action inertia, characterized by slow responses from management after environmental analyses, leading to minimal change outcomes (Godkin and Allcorn, 2008). Top executives frequently exhibit low adoption rates of new technology systems (Youssef et al., 2022), while organizational factors such as attitudes toward technology can further delay adoption (Jahanmir and Cavadas, 2018). Senior management support (Lutfi et al., 2023), including resource allocation, plays a critical role in facilitating BDA adoption (Aboelmaged and Mouakket, 2020).
Empirical evidence highlights management as a key driver of BDA adoption (Babalghaith and Aljarallah, 2024). Consequently, delays in management action represent a form of action inertia, contributing to slower organizational responses to technological changes. Thus:
H2.Action inertia is a positive first-order dimension contributing to the second-order construct of OI in BDA adoption.
BDA adoption is influenced by psychological inertia, a component of OI, manifesting as stress, anxiety and defensiveness against change within organizations. These reactions lead to rigid commitments and dysfunctions that negatively impact firm performance (Godkin and Allcorn, 2008). While innovation is a critical strategy for profitable growth, psychological inertia diminishes creativity, a key driver of innovation (Li et al., 2007). In addition, OI obstructs innovation, as even highly innovative companies encounter internal resistance, making it challenging to adopt new business methods (Huang et al., 2013). Overcoming these barriers requires cultural transformation, strong leadership and the active involvement of senior management to initiate and sustain BDA adoption (Barlette and Baillette, 2022). Furthermore, change management often precedes BDA adoption (Aboelmaged and Mouakket, 2020).
Psychological inertia, as part of OI, hampers organizational creativity, cultural transformation and adaptation to innovations such as BDA. This dimension of OI directly affects the organization’s ability to adapt and innovate. Thus:
H3.Psychological inertia is a positive first-order dimension contributing to the second-order construct of OI in BDA adoption.
The dimensions of OI insight inertia, action inertia and psychological inertia, as theoretically proposed by Godkin and Allcorn (2008), are complementary and inherently suggest that BDA, like all innovations, should be subject to OI, delaying its implementation. OI, which involves technology that is not part of operational processes but aimed at improving decision-making, is somewhat intangible and can wait, giving preference to day-to-day operations. As a result, just as each dimension affects the adoption of BDA, these dimensions are part of a more holistic concept, namely OI. It is thus proposed that OI should influence the implementation of BDA, therefore:
H4.OI negatively influences BDA adoption.
The Archetype of the Department Leader’s Power refers to how a firm coordinates its departments by granting varying power levels to department heads. The firm selects an archetype that defines its approach to coordination and power distribution among its leaders (Siggelkow and Rivkin, 2005).
Thus, executives exert significant influence on innovation, particularly when decision-making power is centralized, as they shape organizational values and culture supporting innovation (Damanpour and Schneider, 2006). Executive power can either facilitate or hinder the adoption of innovations, including BDA, depending on the decisions and resource allocation. Managers often resist adopting new IT systems (Youssef et al., 2022). Organizational silos and fears of loss of control have also been identified as barriers to BDA adoption (Mikalef et al., 2021). Organizational support, encompassing technological and human resources, plays a critical role in adoption processes, with leadership resource allocation being pivotal (Yu et al., 2022). Top management support and organizational readiness significantly influence BDA adoption, with leadership’s control over resources affecting the process’s speed and success (Babalghaith and Aljarallah, 2024). Concentrated or misdirected management power may exacerbate OI and delay technological adoption.
According to OI (Hannan and Freeman, 1984), resource mobilization is essential for structural changes, including BDA adoption. When department leaders control human, financial and accounting resources, their inertial tendencies can delay resource mobilization, slowing BDA adoption. Authority forms may influence adoption speed and outcomes. Thus:
H5.The negative effect of OI on BDA adoption is moderated by the power of the department leader, where higher levels of departmental power intensify this negative effect
Methodology
This study adopts a mixed-method approach; the quantitative phase identifies statistical relationships, while the qualitative phase interprets these findings by exploring underlying organizational dynamics. This combination complements and strengthens the study’s explanatory power by integrating broad patterns with practitioner insights.
Sample and data collection
The quantitative study took place in Peru, using the database of the country’s most prominent business school as the source of informants. This database includes professionals with department head and management positions from the country’s leading companies. One thousand five hundred and three invitations were sent out to complete the survey online, with a response rate of 26.6%. Of these, 287 (19.1%) remained after a filter question confirmed that the professionals were involved in or could influence the adoption of emerging technologies. An a priori power analysis using G*Power for a multiple regression with four predictors, effect size f2=0.05, α = 0.05 and power = 0.95 indicated a minimum required sample size of 263 observations. The study sample of 287 responses exceeds this threshold.
The informants from the companies were screened with an initial question about their influence on the decision to adopt ITs; their mean age was 38.6 years, 59.2% were men, and they had an average of 6.0 years working in the company. The working positions distribution was 69.3% in IT, 21.3% in sales and marketing, 5.9% in operations, 5.2% in R&D, 4.5% in administration and 3.9% in finance. Their positions were department heads (49.1%), managers (42.5%) and independent professionals (8.4%). The represented firms have been operating for an average of 30.1 years, with an average of 287 employees, and represent a variety of sectors: 30.0% in IT and telecommunications, 25.1% in retail, 12.5% in manufacturing and logistics, 12.5% in construction and mining, 10.1% in finance, 3.5% in health, 3.1% in consulting and 3.1% in other services. To ensure nonresponse bias, the mean difference test between early and late responders (Armstrong and Overton, 1977) shows no significant differences in the number of employees (Diff. = 42, t = 0.838, p = 0.799), firm’s age (Diff. = 2.54, t = 0.191, p = 0.057), industrial sector composition (Manufacture-Diff. = 0.001, t = 0.02, p = 0.982), informant age (Diff. = 0.748, t = 0.851, p = 0.198) and gender (Diff. = 0.019, t = 0.334, p = 0.631).
Measures
The construct measurements were adapted from prior studies on OI dimensions (Godkin and Allcorn, 2008; Liao et al., 2008; Sull, 1999; Gal, 2006) and BDA adoption (Tu, 2018; Verma et al., 2018), using a 7-point Likert scale (see Appendix 1). OI was modelled as a Type II second-order construct, first-order reflective and second-order formative, consistent with its conceptual definition (Godkin and Allcorn, 2008). This formative specification reflects the assumption that OI is causally formed by distinct, non-interchangeable dimensions. The archetype of department leader power followed Siggelkow and Rivkin’s (2005) five organizational configurations, based on autonomy, pre-screening authority, agenda control and veto power, and was measured using a five-point semantic differential scale (see Appendix 1). All instruments underwent face validity assessment by two experts and were tested through a pilot study to refine wording, ensure clarity and relevance and evaluate initial construct reliability. The questionnaire was translated into Spanish using the back-translation method. Construct validity was assessed with the partial least squares structural equation modelling (PLS-SEM) algorithm in SmartPLS (Ringle et al., 2022). The moderation was tested using the product indicator approach, which is appropriate for scale-based moderators such as the archetype of department leader power.
Mitigating and assessing common method bias
Following the recommendations of Podsakoff et al. (2003), independent and dependent variables were separated, and marker variable items were inserted as task distractions to reduce mental associations. A pilot test with 34 participants, demographically similar to the final sample (mean age 31.7 years, 50% male, 4.6 years of tenure), ensured question clarity. Respondents were informed of anonymity and confidentiality to reduce sensitivity bias. Harman’s single-factor test showed that the largest variance explained by a single factor was 23.38%, below the 50% threshold. The highest variance inflation factor was 2.339, below the 3.3 threshold, indicating common method bias (Kock and Lynn, 2012). The marker variable technique was applied using a theoretically unrelated construct (Lindell and Whitney, 2001; Simmering et al., 2015). After re-estimating the model with the marker variable, no significant changes appeared in path estimates, confirming that common method bias was not a concern.
Results
Construct validity
First, the measurements were validated for composite reliability, with a minimum CR of 0.791, which surpasses the accepted threshold of 0.7 (Hair et al., 2017). Likewise, to assure convergence validity, the average variance extracted (AVE) values are between 0.521 and 0.752, which are over the desirable 0.5 (Hair et al., 2017).
To access discriminant validity, the cross-loading estimations (see Table 2) show that each loading item construct exceeds the loading on the other construct and surpasses the recommended 0.7 loading, or as Hair et al. (2017) suggest, loadings between 0.4 and 0.7 may be acceptable if they do not enhance CR and AVE values appreciably, as in this study.
Furthermore, discriminant validity is assured with the Fornell–Larcker criterion, where the square root of the AVE exceeds the correlation of each construct with any other construct. In the same way, the HTMT criteria show values from 0.024–0.684, which are below the 0.9 threshold (Hair et al., 2017) (see Table 3).
Hypotheses testing
To test the model, PLS-SEM and bootstrap path estimations (5,000 subsamples) were conducted using SmartPLS software version 4.1.0.0 (Ringle et al., 2022). Prior research recommends PLS-SEM for small samples and complex models that include moderators and second-order constructs (Hair et al., 2017).
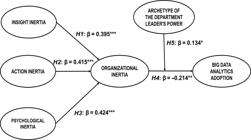
The model defines OI as a second-order formative construct consisting of insight, action and psychological inertia, based on Godkin and Allcorn (2008). Insight inertia significantly contributes (β = 0.3954, t = 22.85, p < 0.001), supporting Hypothesis H1. Action inertia also contributes significantly (β = 0.4150, t = 21.46, p < 0.001), supporting Hypothesis H2. Psychological inertia demonstrates the strongest effect (β = 0.4241, t = 23.64, p < 0.001), confirming Hypothesis H3 (see Table 3).
H4 posits that the OI second-order construct relates to adopting BDA. The estimated results reveal that the association between OI and BDA adoption is negative and significant (β = −0.2137, t = 2.99, p < 0.01), thereby supporting H4 (see Table 4). In addition, it was proposed that the department leader’s power positively moderates the relationship between OI and BDA adoption. This interaction was positive and significant (β = 0.1343, t = 2.13, p < 0.05), supporting H5 (see Table 4).
Figure 1 illustrates all the proposed model relationships with the standardized coefficients and significance, demonstrating that the conceptual model is fully supported.
Post-hoc interviews with it professionals
This study complements the quantitative results through semi-structured interviews with IT professionals, applying the Theories-in-Use approach to generate practitioner-informed insights that support theoretical hypotheses (Zeithaml et al., 2020). The interview guide includes open-ended questions aligned with the study constructs. Interviewers explain the objectives at the beginning and maintain neutrality throughout the sessions. The research team applied purposeful sampling to include professionals with diverse managerial experience. The sample consists of 12 IT professionals (83% male), with a mean age of 39.7 years, 17 years of professional experience and 13.7 years in IT roles. All participants work in global operations across the USA and Latin America (see Appendix 2. Participant characteristics). Each interview took place remotely and individually, with durations ranging from 15 to 40 min, during the third quarter of 2024. Thematic analysis guided the interpretation. Co-authors conducted independent coding of the transcripts and resolved discrepancies through structured comparison.
Insight inertia
Insight inertia in our model refers to the time lag between technological changes and management awareness. Managers often become aware of the need to implement new technologies like BDA after significant delays, sometimes only when external pressures or internal failures highlight the necessity for change:
LATAM region, they’re normally around 18 to 24 months behind the trends. RG.
It had been 10 years, right from the time they started. TW.
It has taken a long time to try to implement this new technology. JG.
Competitive pressures often drive awareness and BDA adoption. When organizations face competition or market changes, they are more likely to adopt new technologies to maintain their competitive edge:
Directors begin to find out about new technologies when they begin to feel competition in their business. LA.
The perception of an imminent threat enables managers to overcome sources of inertia. AR.
As argued in this study, there is a superficial understanding of BDA. Many managers are vaguely aware of BDA but lack a deep understanding of its concepts and practical applications:
They know that they seek BDA, but they don’t know what it is. JG.
Most of them have heard about it, but around half […] understand what BDA means. RG.
No, at this moment, no. They are in the basic phase. EC.
One explanation for the superficial understanding is that participants recognize that implementing BDA requires specific skills often lacking within organizations. This gap requires hiring new talent or training existing employees to develop the required expertise. It often requires creating specialized roles or departments focused on data analytics to bridge the skills gap:
It’s hard to implement because this kind of new technology needs new skills. JG.
There is no one with the necessary skills in this organization. JG.
Half of the cases, they hire someone specific to handle BDA tasks. JJ.
Although managers recognize the benefits of BDA, their superficial understanding creates a need to justify investing in it, which requires strong business cases. Without clear, demonstrable benefits, it is difficult for managers to make decisions about such investments:
To make significant investments […] you need a very strong business case. TW.
Until there’s some company that does a really good job […] there is no way to justify to your boss why you should spend so much money on it. TW.
Action inertia
The model proposes that action inertia refers to the speed with which management responds to BDA adoption. Many participants mentioned that BDA adoption is usually slow and bureaucratic, often requiring multiple levels of approval, and that day-to-day operations are a priority, which stifles innovation:
Five years later, you had to have six or seven levels of approval. TW.
It takes time, takes some time. It’s not quick. JJ.
But at this moment, the focus is on operation. EC.
Another characteristic of action inertia is the influence of the firm′s culture. Participants highlighted that long-standing hierarchical structures and traditional mindsets significantly impede the adoption of new technologies. Bureaucracy, compensation systems and a lack of willingness to invest create a substantial barrier to adopting BDA:
There is an old school culture […] this culture makes adoption hard. JC.
They said that they know all about BDA […] but don’t make any investment. EC.
There isn’t a consistent plan to invest in new technologies. JC.
Management leadership’s role can be a source of inertia; management with reactive leadership only responds to immediate needs or pressures, slowing the adoption process:
Any existing process is an impediment. FA.
Managers are normally very reluctant. So, it takes a lot of convincing. RG.
Normally managers are pushed for specific KPIs[…] they go for more direct solutions. RG.
On the contrary, proactive leadership can overcome inertia and accelerate BDA adoption. It involves a proactive stance, guiding and supporting BDA projects, ensuring alignment with company goals and fostering an environment conducive to innovation:
Our leadership has a big role in big data analytic projects. KJ.
Leaders themselves, they experiment. JJ.
Psychological inertia
The responses show a consensus that there is always a degree of psychological inertia when implementing any technology, indicating the presence of this form of OI. This is specifically because of a strong preference for existing tools and methods, leading to resistance to adopting new technologies. Participants are more comfortable with traditional tools and exhibit territorial behavior over their data:
I prefer my Excel; I prefer to do it myself. JG.
Everyone wants everyone else’s data. No one wants to share their own. TW.
They are very territorial about it […] try to justify the data rather than the performance. TW.
Individuals’ resistance to new technologies is due to the fear that they may expose inefficiencies or lead to job losses. Perceived threats to job security cause fear of transparency and accountability, making individuals reluctant to adopt BDA:
He was a little bit resistant to embracing it. TJ.
But that data isn’t exactly right. TW.
The Human Resources Department was a little bit stressed. TW.
Power of the department leader
The responses agreed that centralizing power at the CEO or top executive level is necessary to drive BDA adoption. This would ensure a unified vision, quicker implementation and consistent support across departments. This suggests the moderating effect of power centralization at the CEO′s level, reducing OI:
A centralized approach at the CEO level provides the authority and resources. LG.
Centralized power on the C level management will help to implement BDA more quickly. JG.
However, centralization can pose challenges because it can drive initial implementation. Still, it can also lead to resistance and inefficiency if lower management and departments are not adequately involved:
If top management is too high up in the hierarchy […] BDA becomes second. RG.
Centralization can fail to meet the expectations of different departments. LG.
Departmental leaders are also determinants of effective BDA adoption. Their influence on their teams and their understanding of technology can significantly impact the success of such projects:
Departmental leaders who are knowledgeable about technology can push. FA.
[…] because they are the closest to their teams. KJ.
I think that’s a lot of help in the team to accelerate, to implement. FA.
The power strategy of centralization or decentralization at the CEO level and department leaders may need to evolve over time. Initially, centralizing is needed to establish a strong foundation, followed by gradual decentralization to adapt to departmental requirements for adopting BDA, which is seen as effective:
Start with the centralized control to establish the project, then move toward decentralized management. RR.
As the staff matures and gains knowledge, the need for centralized power decreases. AR.
Validation of the overall model
Finally, the conceptual model was presented to the participants to gather their opinions. The responses indicate unanimous agreement with the conceptual model, and participants affirm the model’s validity, expressing their concurrence with its core principles and structure:
Well, I think it’s very, very good model. KJ.
I agree with this model. It makes perfect sense. RG.
OI is a significant theme, and recognizing inertia is crucial for the model and aligns with the hypotheses:
Those are the right categories of sorts of obstacles that I would see. TW.
I clearly see the inertia of action[…] and also the psychological inertia[…] MR.
Participants used their practical experiences to support their views on the model, and they provided examples to illustrate the model’s relevance and applicability in real-world scenarios:
I have an example from a previous company I worked with in the retail sector. JG.
I have an example […] we also implemented a big data project[…] EC.
To gain more insights, participants were asked, “Is there anything you would change and/or add?” Some suggested nothing else:
No, I guess it’s a pretty good model[…] KJ.
I don’t think I could add anything else. FA.
Other participants suggested additional factors that could lead to further studies, like variations in the firm structure, egos, managers’ experience in technology and interconnection between inertia dimensions that confirm the second-order dimension of OI proposed in the model:
Power is not the only influence […] but also experience in technology. EC.
The three are not independent, in my opinion. EC.
One interesting insight is that adoption is seen as an ongoing process rather than a one-time event; respondents recognize that even after initial adoption, organizations might revert to inertia and need to re-engage with the model to maintain progress:
Adoption will stagnate again, and it will return to inertia […] LG.
You have to go back to […] repeat it. MR.
In conclusion, this qualitative study provides valuable insights into the relevance of the model and its relationships, offering a meaningful explanation for BDA adoption in real-world practice. Finally, as recommended in qualitative research, this study ensured rigor through trustworthiness checks, including credibility, transferability, dependability and confirmability (Zeithaml et al., 2020). Credibility is established as participants consistently validate and accept the proposed model, confirming its accuracy in representing their experiences. Transferability is addressed by including a wide range of firms from different countries and contexts across 12 Latin American countries, the US, and other regions globally. Dependability is demonstrated through participants’ stories, which relate to current firm experiences and past experiences in other firms. Confirmability is addressed by including exact quotes from participants in the text and providing independent analysis by the co-authors.
Discussion
Theoretical implications
This study contributes to theory by introducing a validated model that links OI to BDA adoption. Unlike prior research focused on individual-level factors (Yu et al., 2022; Shahbaz et al., 2019), this research conceptualizes OI as a second-order formative construct comprising perceptual, action and psychological dimensions (Godkin and Allcorn, 2008). This multidimensional structure extends the inertia perspective by identifying internal barriers that delay strategic alignment with BDA capabilities (Mikalef et al., 2021; Grover et al., 2018).
Second, including departmental leadership power as a moderator clarifies how authority structures condition the relationship between inertia and innovation adoption. Higher departmental power intensifies the negative effect of OI on BDA adoption, aligning with leadership and organizational change frameworks (Siggelkow and Rivkin, 2005; Damanpour and Schneider, 2006; Alkayid et al., 2022).
Third, the analysis distinguishes BDA from traditional IT by emphasizing its role as a service-oriented technology that generates resistance when perceived as disconnected from core operations (Mikalef et al., 2021; Hung et al., 2020). Qualitative findings indicate that action inertia emerges from reactive management and performance-driven decision-making, reinforcing challenges that service-based technologies pose’ to organizational routines and structures (Gopal et al., 2022; Brown, 2023; Davenport and Bean, 2023).
Managerial implications
This research identifies the practical implications of its findings. To overcome OI, it is necessary to mitigate each of its dimensions. To address perceptual inertia, the study proposes training for executives and other staff to understand the benefits and applications of BDA. Similarly, action inertia manifests as delays in decision-making. Therefore, companies should incorporate BDA implementation into their strategic planning.
Furthermore, psychological inertia is evident, particularly associated with fears of sharing information that could be judged based on performance and the change of processes. The research suggests that managers should be transparent about the effects of not sharing information, as opposed to acknowledging that this information may differ from the past, without fear of reprisals. In this context, the department leader’s power is crucial to overcoming OI, making their cooperation essential. Hence, from the moment of their hiring, leaders should possess flexibility to adapt to changes, as well as IT experience and knowledge.
Social implications
This study has a societal impact by addressing organizational barriers to digital transformation in Latin America, where productivity gaps and inefficient services persist due to low technological adoption. It identifies OI as a barrier to BDA adoption and offers strategies to overcome internal resistance in firms. Societies that build data-driven capabilities improve decision-making, efficiency and innovation. Enhancing organizational efficiency and productivity strengthens competitiveness and raises the overall quality of life.
Improved BDA adoption in Latin American firms supports Sustainable Development Goal (SDG) 9 by strengthening innovation and infrastructure in under-digitized sectors. It also advances SDG 8 by encouraging data-driven practices that enhance competitiveness and job quality.
Limitations and further research
This research has no significant limitations, and the results are consistent. First, participants in the qualitative study highlighted other factors, such as IT experience and the department leader’s knowledge, that can influence overcoming OI and should be further studied.
Second, the focus of this study on the organizational level as the unit of analysis, along with its specific theoretical framework, limits the exploration of leader attributes, such as directly influencing or mediating dimensions of OI, that future research could address through alternative theoretical perspectives and levels of analysis.
Third, participants described a dynamic interaction between OI and BDA adoption, involving iterative transitions between inertia types and partial adoption. Further research could explore whether this process is iterative or resolved in a single stage.
Fourth, the qualitative study found few differences across countries, but further research should examine cultural influences to strengthen external validity.
Fifth, the qualitative section involves a small, non-representative sample, limiting its ability to support statistical generalization. However, the findings contribute to a deeper contextual understanding of the quantitative result.
Sixth, the study examines BDA adoption at the firm level, which limits understanding of how personal-level factors, such as user attitudes, interact with OI. Future research could integrate individual-level frameworks, such as TAM or UTAUT, to provide a more comprehensive view.
Data availability statement
The entire dataset supporting the findings of this study has been made available and can be accessed at https://osf.io/3q589/?view_only=0d100b016b2f4fc3b5d08899869818c7
The authors gratefully acknowledge the reviewers and participants of the 2024 BALAS Conference, which strengthened the development of this manuscript. This study received the BALAS Presidents’ Award for Best Academic Paper (2024) from the Business Association of Latin American Studies (BALAS).
References
- Aboelmaged, M. and Mouakket, S. (2020), “Influencing models and determinants in big data analytics research: a bibliometric analysis”, Information Processing and Management, Vol. 57 No. 4, p. 102234.
- Alkayid, K., Selem, K.M., Shehata, A.E. and Tan, C.C. (2022), “Leader vision, organisational inertia and service hotel employee creativity: role of knowledge-donating”, Current Psychology, Vol. 42 No. 4, pp. 3382-3394.
- Anning-Dorson, T., Baba, F., Zulu, M. and Acheampong, G. (2025), “Data-driven dynamic capabilities in emerging markets: a grounded theory approach to digital transformation in African retail banking”, International Journal of Information Management, Vol. 84, p. 102914.
- Armstrong, J.S. and Overton, T.S. (1977), “Estimating nonresponse bias in mail surveys”, Journal of Marketing Research, Vol. 14 No. 3, pp. 396-402.
- Babalghaith, R. and Aljarallah, A. (2024), “Factors affecting big data analytics adoption in small and medium enterprises”, Information Systems Frontiers, Vol. 26 No. 6, pp. 1-23.
- Babu, M.P. and Sastry, S.H. (2014), “Big data and predictive analytics in ERP systems for automating decision making process”, in 2014 IEEE 5th International Conference on Software Engineering and Service Science, IEEE, pp. 259-262.
- Barlette, Y. and Baillette, P. (2022), “BDA in turbulent contexts: towards organisational change for enhanced agility”, Production Planning and Control, Vol. 33 Nos 2-3, pp. 105-122.
-
Brown, S. (2023), “Survey details data officers’ priorities, challenges for 2023”, available at: Link to the cited article.
» Link to the cited article. - Chen, C.T., Chen, S.C., Khan, A., Lim, M.K. and Tseng, M.L. (2024), “Antecedents of big data analytics and artificial intelligence adoption on operational performance: the ChatGPT platform”, Industrial Management and Data Systems, Vol. 124 No. 7.
- Damanpour, F. and Schneider, M. (2006), “Phases of the adoption of innovation in organisations: effects of environment, organisation and top managers 1”, British Journal of Management, Vol. 17 No. 3, pp. 215-236.
-
Davenport, T. and Bean, R. (2023), “Action and inaction on data, analytics, and AI”, available at: Link to the cited article.
» Link to the cited article. - Economic Commission for Latin America and the Caribbean (ECLAC) (2022), A Digital Path for Sustainable Development in Latin America and the Caribbean, ECLAC.
- El-Haddadeh, R., Fadlalla, A. and Hindi, N.M. (2025), “Big data analytics adoption success: value chain process-level perspective”, Business Process Management Journal, Vol. 31 No. 2, pp. 686-707.
- Gal, D. (2006), “A psychological law of inertia and the illusion of loss aversion”, Judgment and Decision Making, Vol. 1 No. 1, pp. 23-32.
- Godkin, L. and Allcorn, S. (2008), “Overcoming organisational inertia: a tripartite model for achieving strategic organisational change”, The Journal of Applied Business and Economics, Vol. 8 No. 1, pp. 82-96.
- Gopal, P.R.C., Rana, N.P., Krishna, T.V. and Ramkumar, M. (2022), “Impact of big data analytics on supply chain performance: an analysis of influencing factors”, Annals of Operations Research, Vol. 333 Nos 2-3, pp. 769-797.
-
Grover, V., Chiang, R.H.L., Liang, T.-P. and Zhang, D. (2018), “Creating strategic business value from big data analytics: a research framework”, Journal of Management Information Systems, Vol. 35 No. 2, pp. 388-423, doi: 10.1080/07421222.2018.1451951.
» https://doi.org/10.1080/07421222.2018.1451951 - Haag, S. (2014), “Organisational inertia as barrier to firms’ IT adoption–multidimensional scale development and validation”, Smart Sustainability: The Information Systems Opportunity: 20th Americas Conference on Information Systems (AMICS 2014), Curran Associates, pp. 2252-2262.
- Hair, J.F., Hult, G.T.M., Ringle, C. and Sarstedt, M. (2017), A Primer on Partial Least Squares Structural Equation Modeling (PLS-SEM), Sage Publications, p. 384.
- Hannan, M.T. and Freeman, J. (1984), “Structural inertia and organisational change”, American Sociological Review, Vol. 49 No. 2, pp. 149-164.
- Hedberg, B. and Ericson, A. (1997), Insiktstroghet Och Manovertroghet Organisationers Omorientering [Insight Inertia and Action Inertia in Organisational Reorientation]. Blt Hedberg and Se Sjostrand, Från Foretagskriser till Industripolitik (from Organisational Crisis to Industrial Politics), Liber, Malmo, pp. 54-66.
- Huang, H.C., Lai, M.C., Lin, L.H. and Chen, C.T. (2013), “Overcoming organisational inertia to strengthen business model innovation: an open innovation perspective”, Journal of Organisational Change Management, Vol. 26 No. 6, pp. 977-1002.
- Huang, J.C., Lu, C.W., Wen, H.M., Hsieh, C.T. and Wang, H.W. (2020), “The study of organisational inertia, business model innovation and organisational performance in Taiwan financial institutions: organisational learning perspective”, Revista Argentina de Clínica Psicológica, Vol. 29 No. 5, pp. 104-115.
- Hung, J.L., He, W. and Shen, J. (2020), “Big data analytics for supply chain relationship in banking”, Industrial Marketing Management, Vol. 86, pp. 144-153.
- Jahanmir, S.F. and Cavadas, J. (2018), “Factors affecting late adoption of digital innovations”, Journal of Business Research, Vol. 88 No. C, pp. 337-343.
- Kock, N. and Lynn, G.S. (2012), “Lateral collinearity and misleading results in variance-based SEM: an illustration and recommendations”, Journal of the Association for Information Systems, Vol. 13 No. 7, pp. 546-580.
- Li, W., Chen, W., Pang, Q. and Song, J. (2023), “How to mitigate the inhibitory effect of organisational inertia on corporate digital entrepreneurship? ”, Frontiers in Psychology, Vol. 14, p. 1130801.
- Li, Y., Wang, J., Li, X. and Zhao, W. (2007), “Design creativity in product innovation”, The International Journal of Advanced Manufacturing Technology, Vol. 33 Nos 3-4, pp. 213-222.
- Liao, S.H., Fei, W.C. and Liu, C.T. (2008), “Relationship between knowledge inertia, organisational learning and organisational innovation”, Technovation, Vol. 28 No. 4, pp. 183-195.
- Lindell, M.K. and Whitney, D.J. (2001), “Accounting for common method variance in cross-sectional research designs”, Journal of Applied Psychology, Vol. 86 No. 1, p. 114.
- Lutfi, A., Alrawad, M., Alsyouf, A., Almaiah, M.A., Al-Khasawneh, A., Al-Khasawneh, A.L., Alshira’h, A.F., Alshirah, M.H., Saad, M. and Ibrahim, N. (2023), “Drivers and impact of big data analytic adoption in the retail industry: a quantitative investigation applying structural equation modeling”, Journal of Retailing and Consumer Services, Vol. 70 No. C, p. 103129.
-
Manpowergroup (2023), “Expectativas de Empleo Q2”, available at: Link to the cited article.
» Link to the cited article. - Mikalef, P., van de Wetering, R. and Krogstie, J. (2021), “Building dynamic capabilities by leveraging big data analytics: the role of organisational inertia”, Information and Management, Vol. 58 No. 6, pp. 1-17.
- Moradi, E., Jafari, S.M., Doorbash, Z.M. and Mirzaei, A. (2021), “Impact of organisational inertia on business model innovation, open innovation and corporate performance”, Asia Pacific Management Review, Vol. 26 No. 4, pp. 171-179.
- Nedzinskas, Š., Pundzienė, A., Buožiūtė-Rafanavičienė, S. and Pilkienė, M. (2013), “The impact of dynamic capabilities on SME performance in a volatile environment as moderated by organisational inertia”, Baltic Journal of Management, Vol. 8 No. 4, pp. 376-396.
- Orero-Blat, M., Rodríguez, A.L.L. and Palacios-Marqués, D. (2025), “The strategic advantage of innovative organizational culture: an exploratory analysis in digital transformation and big data analytics capabilities”, Journal of Management and Organization, Vol. 31 No. 2, pp. 443-462.
- Podsakoff, P.M., MacKenzie, S.B., Lee, J.Y. and Podsakoff, N.P. (2003), “Common method biases in behavioral research: a critical review of the literature and recommended remedies”, Journal of Applied Psychology, Vol. 88 No. 5, pp. 879-903.
-
Ringle, C.M., Wende, S. and Becker, J.-M. (2022), “SmartPLS 4”, SmartPLS GmbH, Oststeinbek, available at: Link to the website of smartpls.
» Link to the website of smartpls. - Shahbaz, M., Gao, C., Zhai, L., Shahzad, F. and Hu, Y. (2019), “Investigating the adoption of big data analytics in healthcare: the moderating role of resistance to change”, Journal of Big Data, Vol. 6 No. 1, pp. 1-20.
- Siggelkow, N. and Rivkin, J.W. (2005), “Speed and search: designing organisations for turbulence and complexity”, Organization Science, Vol. 16 No. 2, pp. 101-122.
- Simmering, M.J., Fuller, C.M., Richardson, H.A., Ocal, Y. and Atinc, G.M. (2015), “Marker variable choice, reporting, and interpretation in the detection of common method variance: a review and demonstration”, Organizational Research Methods, Vol. 18 No. 3, pp. 473-511.
- Sull, D.N. (1999), “Why good companies go bad?”, Harvard Business Review, Vol. 77 No. 4, pp. 42-52.
- Teofilus, T., Ardyan, E., Sutrisno, T.F., Sabar, S. and Sutanto, V. (2022), “Managing organisational inertia: Indonesian family business perspective”, Frontiers in Psychology, Vol. 13, p. 839266.
- Tu, M. (2018), “An exploratory study of internet of things (IoT) adoption intention in logistics and supply chain management”, The International Journal of Logistics Management, Vol. 29 No. 1, pp. 131-151.
-
United Nations Conference on Trade and Development (UNCTAD) (2021), “Informe sobre la economía digital 2021”, available at: Link to a PDF of the cited article.
» Link to a PDF of the cited article. - Verma, S., Bhattacharyya, S.S. and Kumar, S. (2018), “An extension of the technology acceptance model in the big data analytics system implementation environment”, Information Processing and Management, Vol. 54 No. 5, pp. 791-806.
- Vilgis, V., Jordán, V. and Patiño, A. (2023), “Medición de la economía de Internet en América Latina: los casos del Brasil, Chile, Colombia y México”, ECLAC.
- Youssef, M.A.E.A., Eid, R. and Agag, G. (2022), “Cross-national differences in big data analytics adoption in the retail industry”, Journal of Retailing and Consumer Services, Vol. 64 No. C, p. 102827.
- Yu, J., Taskin, N., Nguyen, C.P., Li, J. and Pauleen, D. (2022), “Investigating the determinants of big data analytics adoption in decision making: an empirical study in New Zealand, China, and Vietnam”, Pacific Asia Journal of the Association for Information Systems, Vol. 14 No. 4, p. 3.
- Zeithaml, V.A., Jaworski, B.J., Kohli, A.K., Tuli, K.R., Ulaga, W. and Zaltman, G. (2020), “A theories-in-use approach to building marketing theory”, Journal of Marketing, Vol. 84 No. 1, pp. 32-51.
- Zhen, J., Cao, C., Qiu, H. and Xie, Z. (2021), “Impact of organisational inertia on organisational agility: the role of IT ambidexterity”, Information Technology and Management, Vol. 22 No. 1, pp. 53-65.
Further reading
- Hedberg, B. and Wolff, R. (2003), “Organizing, learning, and strategizing: from construction to discovery”, in Dierkes, M., Antal, A.B., Child, J. and Nonaka, I. (Eds), Handbook of Organisational Learning and Knowledge, Oxford University Press, Oxford, pp. 535-556.
- Palomino-Tamayo, W. and Timaná, J.S. (2022), “Creating firm value, overcoming organisational inertia through the marketing value chain”, Academia Revista Latinoamericana de Administración, Vol. 35 No. 1, pp. 20-36.
- Shao, Z., Wang, T. and Feng, Y. (2016), “Impact of chief information officer’s strategic knowledge and structural power on enterprise systems success”, Industrial Management and Data Systems, Vol. 116 No. 1, pp. 43-64.
Appendix 1
Appendix 2
Edited by
-
ASSOCIATE EDITOR:
Alessandra Costa