 Evolution of the Population Aging Index in Brazil (1991–2022): temporal analysis and sociodemographic determinants
Abstract
Objective To analyze the evolution of the Population Aging Index (PAI) in Brazil from 1991 to 2022 and to evaluate its association with selected demographic and socioeconomic indicators.
Methods This is an ecological time-series study using data from the Brazilian Demographic Censuses and intercensal estimates from the Brazilian Institute of Geography and Statistics (IBGE). The PAI was calculated as the number of individuals aged ≥60 per 100 aged 0–14. Annual percent change (APC) in PAI was estimated through Prais-Winsten regression. Selected variables included sex ratio, population density, population growth rate, life expectancy, fertility, infant mortality, urbanization, Palma ratio, Gini index, gross domestic product and Human Development Index.
Results The PAI increased from 16.7 in 1991 to 68.4 in 2022, constituting a 300% rise over 30 years. Higher values were concentrated in the South and Southeast, and lower values in the North. The fertility rate and Gini index were negatively associated with PAI-APC in the final model, while GDP showed a positive association. These factors explained 84% of PAI variation across states.
Conclusion Population aging in Brazil has rapidly and unevenly advanced, with faster growth in more developed states. The findings should be interpreted considering that some of the analyzed indicators constitute direct demographic determinants of population aging. Nevertheless, the results highlight the need for intersectoral and regionally tailored public policies to address the challenges posed by accelerated and unequal population aging.
Keywords
Aging; Population Dynamics; Socioeconomic Factors; Health Inequality Indicators; Brazil.
Resumo
Objetivo Analisar a evolução do Índice de Envelhecimento Populacional (IEP) no Brasil entre 1991 e 2022 e avaliar sua associação com indicadores demográficos e socioeconômicos selecionados.
Métodos Estudo ecológico de séries temporais com dados dos Censos Demográficos e estimativas intercensitárias do Instituto Brasileiro de Geografia e Estatística (IBGE). O IEP foi calculado como o número de indivíduos ≥60 anos de idade por 100 com 0–14 anos. A variação percentual anual (APC) foi estimada por regressão de Prais-Winsten. Variáveis selecionadas incluíram razão de sexo, densidade demográfica, taxa de crescimento populacional, expectativa de vida, fertilidade, mortalidade infantil, urbanização, razão de Palma, índice de Gini, Produto Interno Bruto (PIB) e índice de desenvolvimento humano (IDH).
Resultados O IEP aumentou de 16,7 em 1991 para 68,4 em 2022, um crescimento de 300% em 30 anos. Valores mais altos concentraram-se no Sul e Sudeste, e mais baixos no Norte. No modelo final, a taxa de fertilidade e o índice de Gini associaram-se negativamente à APC do IEP, enquanto o PIB mostrou associação positiva. Esses fatores explicaram 84% da variação entre estados.
Conclusão O envelhecimento no Brasil avançou de forma rápida e desigual, com crescimento mais intenso em estados mais desenvolvidos. Os resultados devem ser interpretados considerando que parte dos indicadores analisados constitui determinantes diretos do envelhecimento populacional. Ainda assim, os achados evidenciam a necessidade de políticas públicas intersetoriais e regionalmente orientadas para enfrentar os desafios impostos pelo envelhecimento acelerado e desigual no país.
Palavras-chave
Envelhecimento; Dinâmica Populacional; Fatores Socioeconômicos; Indicadores de Desigualdade em Saúde; Brasil.
INTRODUCTION
Population aging is a demographic phenomenon characterized by an increase in the proportion of older adults in relation to younger age groups in the population’s age structure1. This process has intensified particularly rapidly in recent decades in Brazil. The older adult population increased from approximately three million people in 1960 to about 20 million in 2008, corresponding to a growth of almost 700% in less than 50 years2. This movement occurred in line with the demographic transition, characterized by replacement of a regime of high fertility and mortality rates with another marked by the sustained reduction of these indicators1,2. From this perspective, the Brazilian demographic transition stood out for its speed and scope when compared to that observed in high-income countries2, contributing to imbalances in the dynamics of the country’s social and economic institutions.
This aging process reflects social and economic transformations that occurred throughout the 20th century, including the greater insertion of women into the labor market, associated with a reduction in fertility rates; an expansion of education, with increased average schooling and access to higher education; and advances in public health and technology, which improved living conditions and raised life expectancy at birth3,4. Together, these factors have shaped the country’s current demographic profile characterized by low population growth and greater longevity, posing significant challenges to social and economic development.
The analysis of population aging can be operationalized through the Population Aging Index (PAI), defined as the ratio between the number of people aged 60 or older and the number of individuals aged between zero and 14 years. This indicator allows us to synthesize changes in the age structure and compare aging patterns between regions and over time, being particularly useful for territorial analyses in contexts of accelerated demographic transition.
Population aging in Brazil poses challenges to economic and social systems, with repercussions on the labor market, social security, consumption patterns, and the organization of health systems3,5–8. However, these impacts manifest themselves unevenly among the regions of the country, reflecting differences in demographic and socioeconomic profiles. In this sense, investigating the evolution of the PAI and its association with demographic and socioeconomic indicators allows us to understand how these inequalities are expressed in the dynamics of Brazilian population aging. Given this context, it becomes relevant to analyze the temporal evolution of the Population Aging Index in Brazil and its association with selected demographic and socioeconomic indicators in an integrated way considering the regional heterogeneity of the country. Despite the relevance of the topic, studies that explore these associations over extended periods, especially at the state level, are still limited.
Thus, the objective of this study was to analyze the evolution of the Population Aging Index in Brazil between 1991 and 2022 and to evaluate its association with selected demographic and socioeconomic indicators.
METHODS
This is an ecological time-series study. The data source was the Brazilian Institute of Geography and Statistics (IBGE – https://www.ibge.gov.br/en/home-eng.html). We collected data from the Brazilian Demographic Censuses conducted in the years 1991, 2000, 2010, and 2022, and from estimates for their intervals (1996, 2006, 2016).
The PAI in Brazil is measured as the number of older adults aged 60 or older per 100 children and adolescents aged 0 to 14. We calculated the PAI for each of the 27 Brazilian states for these seven years mentioned (1991, 1996, 2000, 2006, 2010, 2016, and 2022). Next, we used Prais-Winsten regression to estimate the variation in the PAI between 1991 and 2022 (32 years) considering the autocorrelation of the residuals. This analysis generates an annual percentage variation coefficient (APC) with its respective 95% confidence interval (95%CI). When the 95%CI does not include the value zero, it means that the APC is increasing (if positive) or decreasing (if negative); when the 95%CI includes the value zero, it means that the APC is stable during this period.
The contextual factors (covariates) included in the analysis were: sex ratio (number of men divided by the number of women); population density (number of inhabitants per square kilometer); geometric population growth rate (constant rate at which a population changes from one period to the next); life expectancy at birth (average number of years a newborn can expect to live); fertility rate (number of children per woman); infant mortality rate (number of deaths before one year of age divided by the total number of live births); urbanization index (percentage of the population living in urban areas); Palma ratio (ratio of income of the richest 10% to the poorest 40%); Gini coefficient (a statistical measure of dispersion designed to represent income inequality, wealth inequality, or consumption inequality); Gross Domestic Product (GDP – a standard measure of the value added created through the production of goods and services); and Human Development Index (HDI – a statistical index composed of indicators of life expectancy, education, and per capita income).
These covariates were analyzed for the most recent year for which they were available. Most were extracted from the latest IBGE Demographic Census (IBGE, 2022). Otherwise, if the variable was not available in the latest Census, it was extracted from the year 2016 (namely: life expectancy at birth, infant mortality rate, urbanization index, and Palma index).
The analyses were performed in the first half of 2025. Simple and multiple regressions were performed to test the association between each covariate and the variation in the PAI. We categorized each covariate into tertiles for analysis purposes and tested them in both forms (continuous and categorical). Next, we present only the significant association for the variables in tertiles in the Results section, as these explained the greatest variability (R2 coefficient) of the outcome. Variables with a p-value less than 0.20 were kept in the final model, and those with a p-value less than 0.05 had statistical significance. Linear trend tests were also performed.
The study used exclusively secondary, aggregated, and publicly accessible data, without the possibility of individual identification. Therefore, it is exempt from review by a Research Ethics Committee, in accordance with Resolution No. 510 of the National Health Council, of April 7, 2016.
DATA AVAILABILITY
The entire dataset supporting the results of this study is available upon request from the corresponding author, Samuel C. Dumith.
RESULTS
The PAI in Brazil changed from 16.7 in 1991 (ranging from 8.5 in Roraima to 32.5 in Rio de Janeiro) to 68.4 in 2022 (ranging from 27.1 in Roraima to 115.4 in Rio Grande do Sul). This represents an absolute increase of 51.7 percentage points (pp) or a relative increase of 300% over 30 years (Table 1). Among the 27 Brazilian states, the average annual percentage change (APC) for the PAI from 1991 to 2022 was 1.8 (95%CI 1.6 to 2.1), ranging from 0.7 (in Roraima) to 3.2 (in Rio Grande do Sul).
Description of the population aging index (PAI) and the annual percentage change (APC) for each Brazilian state (n=27), 1991 to 2022.
Considering the Brazilian regions, the APC-PAI ranged from an average of 1.1 (SD=0.4) in the North region to 2.8 (SD=0.4) in the South region (Figure 1). It increased almost fourfold between 1991 and 2022 for all five regions, rising from 10 to 40 in the North region, and from 24 and 23 to 96 and 97 for the Southeast and South regions, respectively. This means that there is virtually one older adult (60 years or older) for every child or young person under 15 years old in the Southeast and South regions, as based on the last Census (2022). However, considering the North region (lowest PAI in Brazil), there are approximately two individuals under 15 years old for every individual 60 years or older.
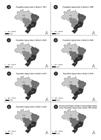
Description of the population aging index (PAI) according to the regional division of Brazil, 1991 to 2022.
The variables associated with the APC-PAI (Annual Percentage Change in the Population Aging Index) in the final statistical model were: fertility rate, Gini coefficient, and GDP (Table 2). We observed a negative association with the fertility rate and the Gini coefficient, meaning that an increase in their tertiles resulted in a lower APC-PAI. On the other hand, there was a positive association with GDP, meaning that each increase in its tertile resulted in a higher APC-PAI. Together, these variables explained 84% (adjusted R2 coefficient) of the variability in the outcome (APC-PAI). The exposure variable most associated with the outcome was the fertility rate, meaning that states in the third tertile (highest fertility rate) showed an average of a 1.2 percentage point (pp) smaller increase in APC-PAI compared to the first tertile (states with the lowest fertility rate).
Crude and adjusted analyses of the annual percentage change (APC) in the population aging index (PAI) associated with contextual factors for the 27 federative units of Brazil – 1991 to 2022.
The other variables included in the statistical analyses (sex ratio, population density, geometric population growth rate, life expectancy at birth, infant mortality rate, urbanization index, Palma index, HDI) did not reach statistical significance (p-value >0.20) and were excluded from the final model.
DISCUSSION
This study provides a comprehensive analysis of trends in the PAI across all Brazilian states from 1991 to 2022, as well as its association with key contextual factors. Key findings reveal that the PAI quadrupled during this period (from 17% to 68%), reflecting an average increase of almost two percentage points (pp) per year. Furthermore, the PAI growth was inversely associated with the fertility rate and the Gini coefficient, and directly associated with GDP. Moreover, the distinct demographic stages of the states are reflected in the PAI of the state of Rio Grande do Sul (for example), which was already higher in 1991 (29.7) than the value presented in Roraima in 2022 (27.1). Taken together, these results highlight the demographic intensification of population aging in Brazil and emphasize the influence of reproductive patterns, social and economic factors on its progression. By identifying the contextual determinants of aging, this study provides evidence that can guide regional planning and formulation of equitable public policies for healthy aging.
A study9 analyzing the period from 1970 to 2010 identified a 268% increase in PAI in Brazil, providing a different temporal perspective from our study, which also highlights the country’s rapid population aging. The authors reported the highest PAI values in the South (54.9) and Southeast (54.6) regions in 2010, while the North had the lowest (21.8), with this regional pattern also being observed in the present study. Although the study did not directly examine variables associated with aging, the authors observed that more developed regions tend to have higher PAI values9. This was confirmed in our analysis, which found a direct relationship between PAI and GDP, and an inverse relationship with the Gini coefficient. The study also presents estimates from the United Nations Population Division, which projected that Brazil would reach a PAI of 68.3 by 2025, a threshold already surpassed in 2022 according to our data.
The fertility transition, one of the components of the demographic transition, represents the shift from a pattern of high and poorly controlled fertility levels to a scenario of birth planning, with a reduction in births and also in neonatal deaths. According to a Brazilian study10, the fertility transition process occurred in different ways both intra- and inter-regionally, highlighting the uniqueness of the country’s demographic dynamics. Some Brazilian states with greater urban and economic development, such as Rio de Janeiro, São Paulo, and Rio Grande do Sul, experienced a slow fertility transition, beginning in 1930 or earlier (given the lack of sufficient records), which is consistent with what occurred in European countries.
However, many states experienced the fertility transition phenomenon in an accelerated manner, starting in the 1960s or 1970s10, when the reduction in the fertility rate was recorded throughout the national territory in a sustained and uninterrupted way. Furthermore, at the inter-regional level, this study10 indicated that the state of Santa Catarina presented homogeneous variation in the fertility rate throughout its territory over the study period, while Minas Gerais was the state with the greatest heterogeneity in its municipalities, being divided into five parts. In other words, even in a socioeconomically developed state, demographic changes occur at different rates according to the microregion.
Another national study1 which also presents an overview of the Brazilian demographic transition indicated that the national fertility rate began to decline from the end of the 1960s, reaching the replacement threshold (which produces zero population growth) in the 2000s. Furthermore, this same study1 compared the decline in the fertility rate in Brazil with that of England: while in England it took 100 years to show a 58% decline (from 5.3 in 1870 to 2.2 in 1970), in Brazil there was a 60% reduction in 30 years (from 5.8 in 1970 to 2.3 in 2000). This study1 reinforces how quickly this rate decreased in Brazil, a middle-income country which has seen rapid narrowing of the age pyramid compared to high-income countries, implying super-accelerated population aging.
Previous studies have shown that population aging in Brazil is more pronounced in states with higher socioeconomic development levels, which is reflected in indicators such as GDP per capita, urbanization, and access to health. In this context, a study4 highlighted the geographically heterogeneous nature of population aging in Brazil. Based on GDP, the most economically developed regions (South and Southeast) have the highest proportions of older adults, in contrast to the lower rates observed in the North and Northeast. A study published in 2021 11 examined the relationship between income inequality and aging in Brazil. Similarly, the authors identified regional heterogeneity in sociodemographic dynamics. Furthermore, their findings revealed an inverse association between income inequality and aging indicators, reinforcing that municipalities with greater income disparities tend to have less favorable aging profiles11.
As reported, our APC-PAI data can be explained by about 80% by the inverse relationship between the fertility rate and the Gini coefficient and positively by GDP. These findings suggest and reinforce the secondary and paradoxical effects of successful economic advancement, such as increased education and economic inclusion of women, rising cost of living, loss of value as an economic reserve for children, and greater access to birth control.12 A global study shows that improvements in female education and access to contraceptives, strongly linked to wealth, are the main drivers of declining birth rates, accelerating the relative aging of the population.13 Thus, this process leads to a reduction in the birth rate across all social strata in wealthier regions with less income disparity, which, combined with better sanitation, urban infrastructure, nutrition, education, and access to healthcare, pulls the age pyramid into an “age rectangle”14-16.
Furthermore, it is important to highlight that the public policies developed in the country were essential to leverage improvement in the quality of life throughout Brazil, serving as a basis for the increase in longevity and the demographic transition. From this perspective, it is crucial to emphasize projects such as the National Immunization Program of 1973, the Unified Health System (Sistema Único de Saúde) and the expansion of the Family Health Strategy (Estratégia Saúde da Família) since 1994, as well as the expansion of access to essential medicines through the National Pharmaceutical Assistance Policy and the Popular Pharmacy Program of Brazil (Política Nacional de Assistência Farmacêutica e do Programa Farmácia Popular do Brasil) created in 2004, given that they constituted fundamental pillars for improving health indicators, increasing longevity and the quality of life of the Brazilian population17,18. Furthermore, expansion and improvement in the education system, also supported by public policies, contributed to increasing human capital, reducing inequalities, and directly influencing demographic dynamics by acting on the determinants of fertility and age structure, postponing entry into the labor market and family formation, and promoting changes in reproductive patterns19.
Alongside population aging, social assistance policies serve as a foundation for mitigating socioeconomic inequalities in advanced ages20, highlighting the Organic Law of Social Assistance (Lei Orgânica da Assistência Social (LOAS) – Law No. 8,742/1993), which established the Continuous Benefit Payment (Benefício de Prestação Continuada - BPC) as a guarantee of minimum income for older adults in vulnerable situations, regardless of social security contributions. Furthermore, the Statute of Older Adults (Estatuto do Idoso) established by Law No. 10,741/2003, constitutes a landmark in the institutional adaptation of the Brazilian State to population aging resulting from the demographic transition by consolidating rights and social protection mechanisms for the population aged 60 or over20.
To our knowledge, this is the first study to quantify the magnitude of variation in the PAI in the Brazilian population over the last three decades. Our estimates included data from all Brazilian states, revealing striking differences and disparities in the population aging process among geographic regions. Furthermore, we identified the contextual factors most strongly associated with population aging in the country. The Gini coefficient was no longer significant, and the association with the fertility rate was reversed. This reversal may reflect that the states with the greatest reductions in fertility were among the poorest, while the richest states experienced slower declines.
The present study suggests that if the APC-PAI (Annual Percentage Change in the Population Aging Index) remains constant, the number of older adults in Brazil will exceed the number of children and adolescents (0 to 14 years) within the next 15 years, which is already observed in some states. These findings emphasize the importance of anticipating demographic transitions and adapting health and social systems to the new population profile. The World Health Organization (WHO)21 defines healthy aging as the process of maintaining functional capacity which enables well-being in old age, highlighting that health systems must be reorganized to meet the needs of aging populations. In this context, population aging not only represents a demographic change, but also a structural challenge for public health planning.
A study using data from the National Health Survey (Pesquisa Nacional de Saúde, 2013) showed how strongly the accumulation of chronic diseases is associated with functional dependence among older adults, reinforcing the need for integrated prevention and care strategies22. Similarly, regional analyses in the Americas indicate that the rapid increase in the proportion of older adults substantially contributes to the burden of non-communicable diseases and to a greater demand for long-term care8,13.
Taken together, these findings highlight that managing population aging requires coordinated measures focused on maintaining functionality and autonomy in old age. This includes strengthening primary healthcare, expanding rehabilitation and long-term care services, and developing community environments that support active and independent living. Viewing population aging from this perspective underscores the need for strategic planning to ensure that increased longevity is accompanied by improved quality of life and system sustainability.
Some limitations of this study should be considered. We did not assess annual changes in PAI over the entire period due to the use of demographic censuses and intercensal population estimates. Thus, we selected seven points in time to ensure more reliable accuracy for trend analysis23. Contextual factors were assessed at a single point in time at the end of the time series (2022), except for life expectancy at birth, infant mortality rate, urbanization index, and Palma index, which were not available in the 2022 census and were obtained from the 2016 census. Furthermore, we used the age of 60 as the cut-off age for calculating PAI, while high-income countries adopt 65, which may compromise the comparability of our estimates with these countries.
CONCLUSION
The results of this study demonstrate a demographic transition process occurring heterogeneously among Brazilian states given their respective singularities in development and urbanization marked by a generalized acceleration over the last few decades. These issues converge with the findings based on the almost 300% increase in the Population Aging Index (PAI) over just three decades, in addition to the disparity in values recorded among the states, reinforcing the existence of distinct scenarios occurring simultaneously in the country. Regarding the analyzed indicators, both the fertility rate and the Gini coefficient showed an inverse association with the PAI, while the Gross Domestic Product of each state showed a positive association. Therefore, it is crucial to understand the different sociodemographic dynamics to effectively meet the specific population demands of each region, uniting public policies and studies focused on the analysis of structural factors in the fields of health, education, and social assistance as a fundamental strategy to understand and respond to the challenges posed by the rapid aging of the Brazilian population.
References
- 1 Carvalho JAM, Garcia RA. O envelhecimento da população brasileira: um enfoque demográfico. Cad Saude Publica. 2003;19(3):725-33. Disponível em: https://doi.org/10.1590/s0102-311x2003000300005
- 2 Xi JY, Lin X, Hao YT. Measurement and projection of the burden of disease attributable to population aging in 188 countries, 1990-2050: A population-based study. J Glob Health. 2022;12.Disponível em: https://doi.org/10.7189/jogh.12.04093
- 3 Faria R, Spode P. O envelhecimento populacional brasileiro sob uma perspectiva regional e urbana. GEOUSP [Internet]. 2025;28:e221106. Disponível em: https://doi.org/10.11606/issn.2179-0892.geousp.2024.221106 Acesso em 9 de janeiro de 2026.
- 4 Gonçalves A, Alves LC. Idade prospectiva e as novas medidas de envelhecimento populacional: indicadores para o Brasil e suas cinco regiões. Rev Bras Estud Popul [Internet]. 2025;41:1–24. Disponível em: https://doi.org/10.20947/s0102-3098a0278
-
5 Organisation for Economic Co-operation and Development. OECD economic surveys: Brazil 2018 [Internet]. Paris: OECD; 2018. Disponível em: https://doi.org/10.1787/9789264290716-pt
» https://doi.org/10.1787/9789264290716-pt -
6 Camarano AA. Novo regime demográfico: uma nova relação entre população e desenvolvimento? Rio de Janeiro: Instituto de Pesquisa Econômica Aplicada (IPEA); 2014. Disponível em: http://repositorio.ipea.gov.br/handle/11058/3288. Acessado em 9 de janeiro de 2026 Acessado em 9 de janeiro de 2026.
» http://repositorio.ipea.gov.br/handle/11058/3288. Acessado em 9 de janeiro de 2026 Acessado em 9 de janeiro de 2026. - 7 Zanon RR, Moretto AC, Rodrigues RL. Envelhecimento populacional e mudanças no padrão de consumo e na estrutura produtiva brasileira. Rev Bras Estud Popul. 2013;30(Supl):S45-67.Disponível em: https://doi.org/10.1590/s0102-30982013000400004
- 8 Hambleton IR, Caixeta R, Jeyaseelan SM, Luciani S, Hennis AJM. The rising burden of non-communicable diseases in the Americas and the impact of population aging: a secondary analysis of available data. The Lancet Regional Health - Americas. 2023;21(100483):100483. Disponível em: https://doi.org/10.1016/j.lana.2023.100483
- 9 Closs VE, Schwanke CHA. Evolução do índice de envelhecimento no Brasil, nas suas regiões e unidades federativas no período de 1970 a 2010. Revista Brasileira de Geriatria e Gerontologia. 2012;15(3):443–58. Disponível em: https://doi.org/10.1590/s1809-98232012000300006
- 10 Gonçalves GQ, Carvalho JAM de, Rodríguez Wong LL, Turra CM. A A transição da fecundidade no Brasil ao longo do século XX – uma perspectiva regional. Revista Brasileira de Estudos de População. 2019 Dec 30;36:1–34. Disponível em: https://doi.org/10.20947/S0102-3098a0098
- 11 Duque AM, Peixoto MVS, Lima SVMA, Santos AD, Ribeiro CJN, Costa JGR, et al. Modelagem espacial da desigualdade de renda e envelhecimento populacional no Brasil. Research, Society and Development. 2021;10(7):e8010716433. Disponível em: https://doi.org/10.33448/rsd-v10i7.16433
-
12 Doepke M, Hannusch A, Kindermann F, Tertilt M. The Economics of Fertility: A New Era [Internet]. Cambridge, MA: National Bureau of Economic Research; 2022 Apr [acesso em 2026 Jan 9]. Disponível em: https://doi.org/10.3386/w29948
» https://doi.org/10.3386/w29948 - 13 Bhattacharjee N v, Schumacher AE, Aali A, Abate YH, Abbasgholizadeh R, Abbasian M, et al. Global fertility in 204 countries and territories, 1950–2021, with forecasts to 2100: a comprehensive demographic analysis for the Global Burden of Disease Study 2021. The Lancet [Internet]. 2024 May;403(10440):2057–99. Disponível em: https://doi.org/10.1016/s0140-6736(24)00550-6
- 14 Nespolo JM, Bordin R, Gouvêa MA. Envelhecimento populacional: um estudo da rede global cidades e comunidades amigáveis à pessoa idosa. OBSERVATÓRIO DE LA ECONOMÍA LATINOAMERICANA. 2024;22(7):e5562–e5562. Disponível em: https://doi.org/10.55905/oelv22n7-012
- 15 Macêdo V, Egypto PV, Costa CA, Cristina L, Costa S. Desafios do envelhecimento populacional para o sistema de saúde. Brazilian Journal of Implantology and Health Sciences. 2025;7(8):377–88. Disponível em: https://doi.org/10.36557/2674-8169.2025v7n8p377-388
- 16 Projected Demographic Effects of International Migration, 2015-2050. Popul Dev Rev. 2018;44(2):407–10. Disponível em: https://doi.org/10.1111/padr.12151
- 17 Dolores M, Teixeira AD, Ferreira-Batista NN, Moreno-Serra R. Assessment of the association between the Brazilian family health strategy and adult mortality. Health Policy and Planning. 2022;37(4):461–71. Disponível em: https://doi.org/10.1093/heapol/czac011
- 18 Almeida ATC de, Sá EB de, Vieira FS, Benevides RP de S e. Impacto do Programa Farmácia Popular do Brasil sobre a saúde de pacientes crônicos. Rev Saude Publica [Internet]. 2019;53. Disponível em: https://doi.org/10.30968/rbfhss.2023.144.0911
- 19 Duarte HFFL, Teixeira EC. Efeito do nível de escolaridade sobre a fecundidade no Brasil. Economia & Região [Internet]. 2021;9(1):167–85. . Disponível em: https://doi.org/10.5433/2317-627x.2021v9n1p167
- 20 Sobrinho LCSL, Mendes ALAC, Lima AAMR, Vieira FC, Mendes MSOC, Cavalcanti TAS, et al. Envelhecimento populacional e feminização da velhice no contexto da atenção à saúde do idoso no Brasil. Brazilian Journal of Health Review. 2024;7(2): Disponível em: https://doi.org/10.34119/bjhrv7n2-207
- 21 Rudnicka E, Napierała P, Podfigurna A, Męczekalski B, Smolarczyk R, Grymowicz M. The World Health Organization (WHO) approach to healthy ageing. Maturitas [Internet]. 2020;139(139):6–11. Disponível em: https://doi.org/10.1016/j.maturitas.2020.05.018
-
22 Júnior WMR, Ferreira LN, Molina-Bastos CG, Bispo JP, Reis HFT, Goulart BNG. Prevalence of functional dependence and chronic diseases in the community-dwelling Brazilian older adults: an analysis by dependence severity and multimorbidity pattern. BMC Public Health [Internet]. 2024; 24(1):140. Disponível em: https://doi.org/10.1186/s12889-023-17564-w
» https://doi.org/10.1186/s12889-023-17564-w - 23 Antunes JLF, Cardoso MRA. Uso da análise de séries temporais em estudos epidemiológicos. Epidemiologia e Serviços de Saúde [Internet]. 2015;24(3):565–76. Disponível em: https://doi.org/10.5123/s1679-49742015000300024
Edited by
-
Edited by
Cristian Arnecke Schröder