 Machine learning–based prediction of long-term farm economic performance: financial, risk, and operational indicators
ABSTRACT:
This study aimed to assess the possibilities of predicting the future development of farms and to identify indicators capable of predicting the success of a farm and its potential risks. This study uses data from Czech farms from 1997 to 2023, which includes financial statements and other production and economic data. Farms are divided into six categories based on a combination of the average four-year return on assets (ROA) and profitability stability. The forecast is carried out using the Random Forest (RF) methodology. The study confirmed the predictability of the future development of farms with an accuracy of 88 %. An essential result of the study is the necessity of using volatility indicators. Operational indicators significantly improve the reliability of the prediction. As regards year-on-year fluctuations in financial ratios, the use of their multi-year average is more appropriate. A recursive representative classification tree was developed and the number of variables needed to classify a company was reduced to five. For the correct classification of a company, the value and volatility of ROA, return on sales, and diversification of production focus are sufficient.
Keywords:
Agricultural enterprises; Financial Health; Profitability prediction; Random Forest
Introduction
From the point of view of estimating future development, agriculture is a specific, hard-to-predict area. The sector is highly dependent on external factors, especially on highly volatile sales prices (Harwood et al., 1999; Meuwissen et al., 2001) leading to sharp, significant year-on-year changes in the profitability of the sector (Špička et al., 2009; Díaz-Bonilla, 2016; Lee et al., 2016). Additional specifics of agricultural enterprises include biological character (Céu and Gaspar, 2022), dependence on climatic conditions (Fan et al., 2024), dependence on local weather fluctuations (Di Falco and Chavas, 2006), high volatility of yields (Špička et al., 2009), and high fixed costs (Sedláček, 2010). The inhomogeneity of production focus can also be a problem for forecasting. Under the conditions of Central Europe, with decreasing altitude, the share of plant production increases, and the crop structure changes (Lososová and Zdeněk, 2013). Each commodity has its price development, specific asset structure, and different asset utilization levels. The use of assets and achieved profitability are also influenced by other factors (company size, legal form of the business, etc. - more detailed in e.g., Bojnec and Fertő, 2020; 2021; 2024; Fertő et al., 2024). All these factors make the reliability of predicting the future development of farms problematic.
Existing prediction models can be divided into two categories. The first category of models predicts profitability, financial health, or bankruptcy (Purves et al., 2015; Rajin et al., 2016; Stojanović and Drinić, 2017; Prusak, 2018), and the second focuses on risk estimation (Harwood et al., 1999; Coble et al., 2000; Goodwin et al., 2000; Špička et al., 2009). Both approaches have their shortcomings and limitations.
This study aimed to create an innovative prediction model that combines existing approaches to predicting farm profitability and potential risks while respecting the industry's uniqueness. The intention is to eliminate the influence of external factors as much as possible so that the model provides the best possible estimate of successful management.
The novelty of our approach lies in several changes compared to existing models. The research team defined threshold for successful business as maintaining an above-average ranking over the long term, and the selection of independent variables was also changed. As a result, the effects of the external environment were filtered out while maintaining the influence of management quality.
Materials and Methods
Theoretical Backgrounds
The economic development of farms has received extensive attention in the literature due to the specifics of agriculture. Recent studies focus on assessing the viability and sustainability of farms (Barnes et al., 2015; Latruffe et al., 2016; Špička et al., 2019; Coppola et al., 2020; Hlavsa et al., 2020; Ribašauskienė et al., 2024). Studies investigating factors influenced by farm size (e.g., Bojnec and Fertő, 2020; 2021; 2024) and assessing technical efficiency (e.g., Čechura et al., 2022; Fan et al., 2024; Eder, 2025) are common.
Research on predictors of farm financial health has focused mainly on quantitative variables and financial ratios (Céu and Gaspar, 2022). Particularly well-known studies include Altman (1968; 1983) or Ohlson (1980). However, there is a lack of research on specific variables related to agricultural production structure, growth, and risks (Céu and Gaspar, 2022). The accuracy of prediction models decreases when applied to a different industry, period, or economic environment (Gavurova et al., 2017; Karas et al., 2017). That is why models specific to individual countries or sectors are emerging (Purves et al., 2015; Rajin et al., 2016; Stojanović and Drinić, 2017; Prusak, 2018; Fiala et al., 2020). The research demonstrated low predictive ability caused by inappropriate boundaries of categories, as well as indicators, and their high volatility (Kopta, 2009; Srebro et al., 2021).
One of the most extensive international questionnaires was carried out within the Agri Bench-mark Cash Crop Project. The farmers (regardless of the region) cited price volatility as the riskiest factor (Chibanda et al., 2020). Several studies dealt with price volatility, the shape of its distribution (Harwood et al., 1999; Goodwin et al., 2000; Špička et al., 2009; Goodwin et al., 2018), and correlation between the price of commodities and their yield (Weisensel and Schoney, 1989; Coble et al., 2000). Proper risk analysis of yields does not provide clear results, and neither is the normality of distribution clear (Annan et al., 2013; Zhang, 2017). The frequent mistake made in studies on yields volatility is using spatially aggregated data instead of holdings data (Špička et al., 2009; Just and Weninger, 1999).
Unexpected price volatility and changing environmental conditions can make it harder for farmers to decide what to cultivate. These decisions are crucial to securing their revenue (Lee et al., 2016). There is a need to determine whether price variations respond to cyclical and shorter-term movements or result from a changing trend reflecting adjustments in long-term fundamentals that must be correctly understood (Díaz-Bonilla, 2016).
External conditions affect the profitability of farms, but economic performance among farms operating under similar conditions may vary considerably. Financial results are usually attributed to differences in management (Rougoor et al., 1998). They note that management processes can only be checked to a certain extent, as stochastic elements, such as weather, pest and disease incidence, market fluctuations, soil and climatic conditions, and political interventions can all influence agriculture. The tendency of farms towards worse or better economic results draws attention to the growing influence of external factors, especially prices and climatic conditions (Střeleček et al., 2011; Lososová and Zdeněk, 2013). In general, external factors significantly influence the year-on-year comparison, and the impact of management quality can be observed in the inter-company comparison.
Data
This study used data from the long-term collected database of Czech farms from 1997 to 2017, which includes financial statements (balance sheet and profit/loss statement) and other production and economic data. The sample included 247 farms that had participated in the survey for at least eight consecutive years. The prediction was determined based on the first four years of monitoring, followed by a further four years to verify the accuracy of the model. The individual farm could be included in the sample repeatedly if the prediction periods did not overlap. A total of 714 cases were obtained, 600 companies were used to create the model, and 114 companies were used to test the model. The model was back-tested on 54 companies (2018-2023 data) to verify the stability of the model over time.
Hypotheses
The study is focused on the possibility of predicting the profitability of farms. During the research, compiling a sufficiently reliable model that would predict future value of profitability was impossible. The problem was in the year-on-year trend. In years when there was a year-on-year increase in profit in the entire sector, the model underestimated the actual profitability; in cases where there was a decrease in profit in agriculture, the model overestimated the values calculated.
Hypothesis H1: Due to the fluctuation of financial indicators, it is more appropriate to use their multi-year average as input indicators. This extension of the observation period is consistent with studies pointing out that classical statistical prediction models are subject to several problems related to using only a single observation (i.e., one annual account) for each firm in the estimation samples (Dirickx and Van Landeghem, 1994; Shumway, 2001).
Hypothesis H2: The inclusion of operational indicators increases the accuracy of the prediction. The predictive ability of non-financial indicators in combination with financial indicators was investigated by Liang et al. (2016), Jones et al. (2017), and Doumpos et al. (2017). Non-financial indicators are indicators of the company's management method, macroeconomic factors, and other indicators specific to the industry and companies. Research uniformly confirms increased predictive power after using these indicators (Purves et al., 2015).
Hypothesis H3: The inclusion of risk indicators is necessary for the prediction of companies at risk of profitability fluctuations. The suitability of such an adjustment was pointed out, for example, by Dambolena and Khoury (1980), who used three- or four-year volatility for prediction. Four-year volatility was also used for prediction by Li and Rahgozar (2012).
Classification of farms
The classification of farms incorporated the following assumptions. An average return on assets (ROA) for four consecutive years was established following the basic success rate criterion of each farm monitored. Given the high year-on-year variability in profit/loss and its considerable dependence on external conditions, overall success was measured in relative terms, i.e., by the farm's rank: 25 % of farms with the highest profitability were considered successful, and 25 % of the farms with the lowest profitability were considered unsuccessful. The remaining farms were classified as average. The stability of their profitability was regarded as a second criterion of their success rate, i.e., farms were considered problematic if their ranking dropped by 50 % or more in at least one of the years monitored in comparison with their usual position. The combination of these two risks led to the determination of the following six groups.
Group 1: Unprofitable farms (145 cases) include 25 % of the farms with the lowest four-year average profitability, while profitability had to reach negative values.
Group 2: Average farms with profit fluctuations (41 cases) having average four-year profitability, but their ROA had dropped at least once, and the company was ranked among the quarter of the worst farms.
Group 3: Average farms (243 cases) having average four-year profitability and no significant profitability drop during the reference period.
Group 4: Above average farms (73 cases). The company was ranked among the 25 % with the highest four-year profitability but its relative ranking had dropped by at least 25 % at least once.
Group 5: Above average farms with profit fluctuations (63 cases) had above-average four-year profitability, and the ROA had dropped by more than 50 % at least once, and the farms had been assessed as below-average.
Group 6: Excellent farms (35 cases). This group was included additionally to describe the most successful farms. An excellent farm was among the 25 % of farms with the highest four-year profitability and 25 % of the most profitable farms in each year of the four-year period.
Independent variables
The independent variables were divided into four groups. The first group (p) included financial ratios, specifically ROA (p1 = Net Profit / Assets), return on sales (p2 = Net Profit / Sales), return on fixed assets (p3 = Net Profit / Fixed assets), assets turnover ratio (p4 = Sales / Asset), fixed assets turnover ratio (p5 = Sales / Fixed Assets), current assets turnover ratio (p6 = Sales / Current Assets), debt ratio (p7 = Debt / Assets), debt to cash flow (p8 = Debt / Operating Cash Flow), debt to sales (p9 = Debt / Sales), current ratio (p10 = Current assets / Short-term liabilities), quick ratio (p11 = (Receivables + Financial assets) / Short-term liabilities), write-off ratio (p12 = Accumulated depreciation / Input price of property) and fixed assets to total assets (p13). The values of these indicators were calculated from the one year and as an average over a four-year period. Selected ratios show significant differences between at least two groups of farms (tested by the Kruskal-Wallis's Analysis of Variance).
The second group (v) includes volatility indicators. It is obvious that if the success of businesses is defined by their riskiness, some risk indicators must be applied as the independent variables. The volatility was calculated as the standard deviation over a four-year period. Specifically, the following were selected: volatility of ROA (v1), volatility of return on sales (v2), volatility of return on fixed assets (v3), volatility of assets turnover ratio (v4), volatility of fixed assets turnover ratio (v5), volatility of current assets turnover ratio (v6).
In the third group (d), indicators measure the revenues and profit per hectare. The tests for these variables showed greater differences between the defined groups than for classic financial ratios. The indicators used were profit per hectare (d1), revenue per hectare (d2), debt per hectare (d3), assets per hectare (d4), labour productivity (d5). This group also includes altitude (d6), which fundamentally affects the way of farming.
The fourth group (k) of indicators can be designated as operating indicators and includes the yield on four dominant agricultural commodities. These are yields on wheat (k6), barley (k7), oilseed rape (k8), and milk yield (k9). To distinguish production intensity, the costs of the production base of these commodities were included. In particular, the costs per dairy cow (k1), and costs per hectare of land (k4) were thus calculated. Given the effect of inflation, individual years were converted to 1997 constant prices through the agricultural producer price index (CSO, 2023). This group also includes the diversification of sales, which was measured by the share of the three dominant commodities in total sales (k5).
Random Forest
The data matrix was randomly divided into two parts - a training part (included circa 84 % of cases) and a testing part. The Random Forest (RF) algorithm by Breiman (2001) was then applied to the training data matrix. This method was chosen on account of the character of the input data (no normality, correlation between independent variables, etc.). The stepwise model construction was evaluated based on error reduction.
Random Forest algorithm is basically a tree algorithm combining several trees in a specific way. Through their combination, followed by voting, better predictive properties are achieved than in the case of using only one classification tree. RF had superior forecasting accuracy with commonly used classifiers in the classification of financial distress data (Tanaka et al., 2016; Shen et al., 2020). The principle of the method used can be described as follows: by using bagging, a new random selection D1 is created based on the data matrix D having n rows and p columns while 1/3 of the cases are not included in the D1. These excluded cases were used for the non-deviated estimate of misclassification - this is the out-of-bag selection. The classification tree on the D1 was "grown". However, during its growth, only q variables were used in each node split where q << p applied. The choice in the q set of variables used was random. As a rule, q was determined as approximately for the classification RF. Full-grown trees from individual D1, D2, …, Dm data files were not pruned. The final forecast was then obtained by "voting" of the individual classification trees thus obtained.
In this way, a set of voting trees was created. Subsequently, several different methods and techniques were used to identify the most important variables, i.e., such variables that contribute as much as possible to the correct classification of cases: distribution of the minimum depths of variables during which the node of a variable was split; a number of trees where the root of the classification tree was split by a given variable; the total number of nodes in which the trees are split by a given variable; change in average accuracy and impurity in nodes due to a given variable (as measured by the Gini coefficient). Through the selected variables, a "representative classification" tree was constructed using binary recursion.
Results
The accuracy of the classification model
The prediction error calculated in the training set is shown in Table 1. The overall prediction accuracy of model based on current financial data was only 63 %. The incorrect classification is evident for unprofitable companies and companies at risk of negative profitability. If the one year's financial data was replaced by a four-year average, the classification error dropped to 24.8 % (valid H1). The improvement was particularly evident in predicting companies at risk of negative profitability. Here, the error dropped from 34.5 to just 9 %. The ability to predict companies at risk of profitability fluctuations remained low (the error rate exceeds 73 and 84 %). Next, financial ratios were supplemented by operational indicators and the prediction improved for all groups (valid H2). The overall error rate dropped from 24.8 to 18 %. However, detecting companies at risk of volatility was still impossible. Group 2 had an error rate of 44 %, and group 5 even 66.7 %. By including volatility, the total error rate fell to 10.8 % (valid H3). The error rate of companies at risk of volatility fluctuations fell to 12.7 %. The group of excellent companies became the least predictable group, with an error rate of 17.14 %.
Variables having the strongest effect
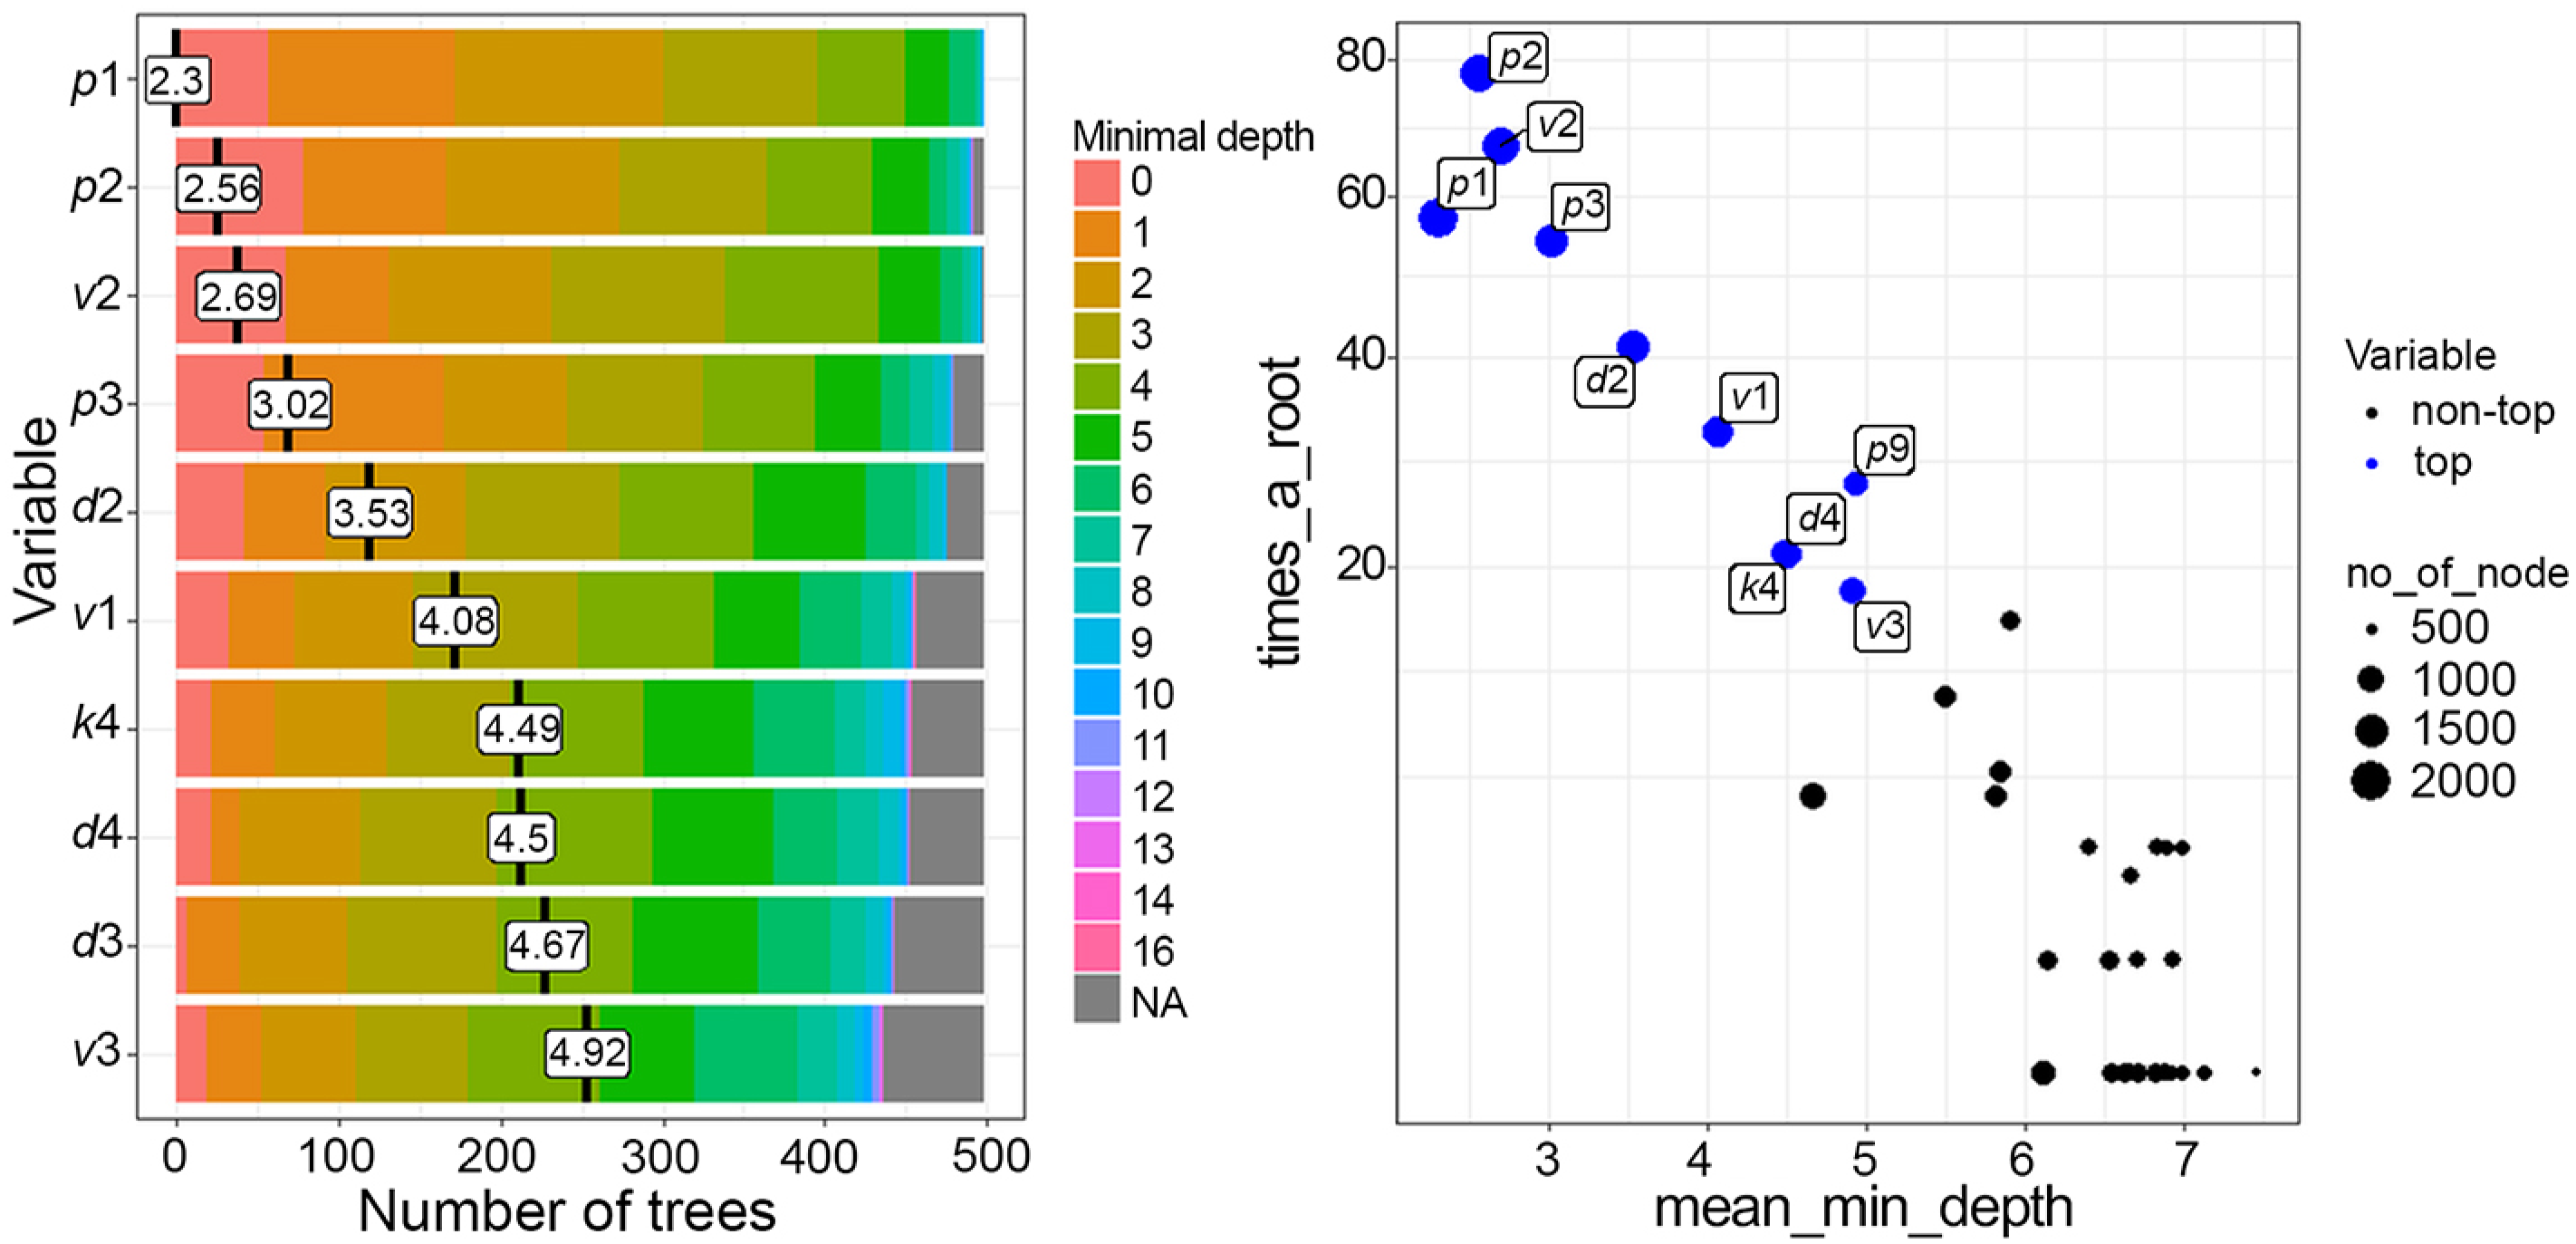
Distribution of the minimum depths for the first ten identified variables among the trees of the "grown" forest from the training data set is shown in Figure 1A. The average depth for each variable is indicated by a vertical line with a value designation. The x-axis values range from zero to the maximum number of trees grown where any variable was used for classification. The results reveal that the most important variables used in classification are represented by p1, p2, v2, p3, d2, v1, d4, k4, d3, v3 and k5.
A) The minimal depth for the first ten identified variables; B) The relationship between depth, the number of times the variable is selected as a root, and the number of nodes. p1 = net profit / assets; p2 = net profit / sales; p3 = net profit / fixed assets; p9 = debt / sales; v1 = volatility of p1; v2 = volatility of p2; v3 = volatility of p3; k4 = costs per hectare of land; d2 = revenue per hectare; d3 = debt per hectare; d4 = assets per hectare; NA = not available.
The relationship between the three characteristics (average depth in which case the node of a given variable was used, the number of trees where the classification tree root is split by a given variable, and the total number of nodes where the trees are split by that variable) for each variable is shown in Figure 1B. The variables that achieved the best possible values for these three characteristics were then highlighted. These results corroborated the results provided by the first method. Again, the following variables were identified as the most influential: p1, p2, v2, p3, d2, v1, d4, k4, v3.
The third way of evaluating the influence of individual variables is based on the decrease in average accuracy and impurity in nodes (measured by the Gini coefficient). The results are shown in Table 2, showing the first 20 variables. The influence of individual variables was similar to the previous findings.
Classification tree by recursive splitting
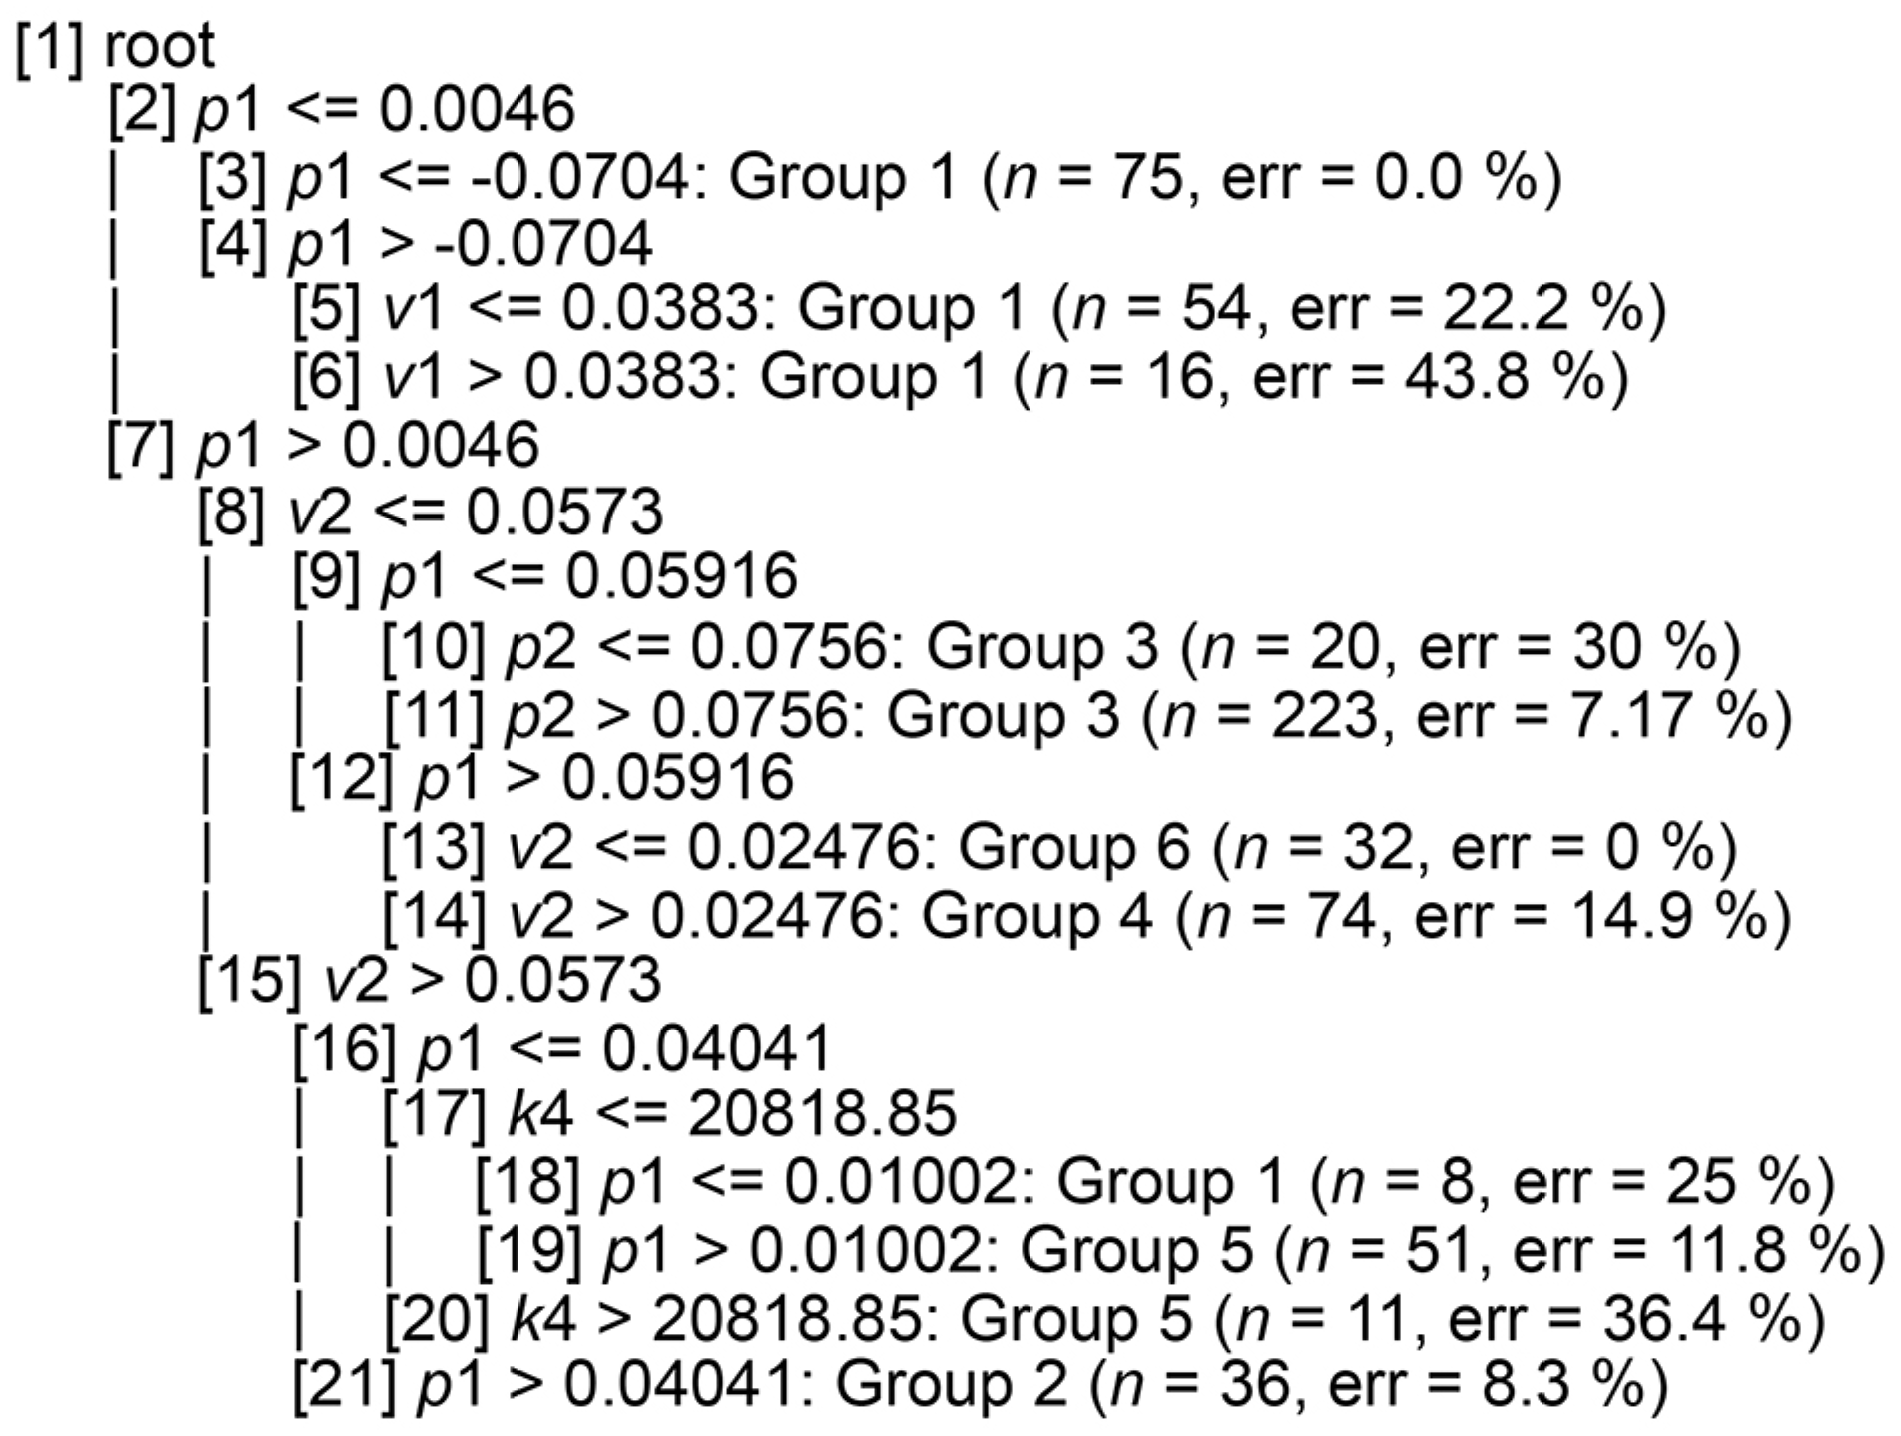
For easier interpretation, the classification tree was then derived using the "identified variables" and recursive binary splitting. The resulting structure is apparent from Figure 2. The number of variables needed to classify a holding dropped to five. For a proper classification it is necessary to know the ROA, return on sales, volatility of ROA, and volatility of return on sales and the costs per hectare of land. The given tree shows that the average four-year profitability, as well as its volatility, is relatively steady and the situation in the predicted period can be estimated only from the values achieved in the period monitored.
Tree graph. p1 = net profit / assets; v1 = volatility of p1; p2 = net profit / sales; v2 = volatility of p2; k4 = costs per hectare of land; n = number of observations; err = error rate.
Model testing
The next step in the analysis was to verify the model on the test data. The classification error was reduced by gradually incorporating the long-term average, operational, and variability indicators (Table 3). The lowest success rate was achieved by using current financial ratios. While the error rate was 36 % on the training set, it increased to 46 % on the test set. Replacing current financial data with their four-year average led to a decrease in the error rate in the test set to 34 %. Including operational indicators further reduced the error rate to 27 %. However, it was again confirmed that only companies threatened by negative profitability can be predicted. Companies threatened by profitability fluctuations are not detected. The final model (including financial ratios, operational, and volatility variables) achieved an error rate of 12.3 %. Companies threatened by profitability fluctuations can be predicted only with the inclusion of volatility. The reliability of the model was also tested over time (for the period 2018-2023). Unfortunately, there were only 54 businesses with available data. Of this amount, 44 were correctly classified. This represented a success rate of 81.48 %.
Discussion
The study demonstrates that farm success is relatively stable over time, with many enterprises maintaining consistent long-term rankings while some experience significant profitability fluctuations. The research shows that these categories of enterprises can be identified, and their future development predicted. Using the RF algorithm, the classification accuracy in the test sample was approximately 88 %, consistent even during verification testing from 2018 to 2023, confirming the model's reliability.
The model showed low accuracy in extreme categories, i.e., the most profitable and loss-making enterprises. Unprofitable enterprises were defined by their database position and negative profitability. Predicting profits in absolute values remains questionable, as authors failed to create a model that would predict profit with sufficient accuracy. Literature also lacks consensus on profit predictability, e.g., Graham et al. (2005) found that 80 % of managers believed volatility reduces profit predictability, while Dichev and Tang (2009) suggested that profits would be stable without economic shocks, and they confirmed the predictive power of past profit volatility against the persistence of current profit. These findings in British companies were confirmed by Frankel and Litov (2009). Our results align with these studies, highlighting the necessity of volatility indicators in the model. Without them, predicting categories affected by profit fluctuations is impossible. In the reduced model, volatility indicators constituted two of the five inputs, confirming the assumptions (Dambolena and Khoury, 1980; Li and Rahgozar, 2012) of their predictive usefulness.
The hypothesis that a multi-year average is better for determining farm success than the current year alone was confirmed. Using four-year average profitability provided the highest level of prediction accuracy. Shorter periods increased error rates for volatile companies, while more extended periods reduced accuracy for low-profitability and above-average companies.
Operational indicators positively impacted model reliability. Purves et al. (2015) used these indicators to predict agricultural enterprise development. Our indicators focused on production intensity, natural conditions, and diversification. The most effective predictors were the share of main commodities, costs per hectare of land, and altitude. A narrow production focus increased profitability fluctuation risks, confirming findings by Guvele (2001), Di Falco and Perrings (2003), and Pellegrini and Tasciotti (2014).
Profitability was a decisive financial ratio. ROA, profitability of sales, and fixed assets significantly influenced classification. Similar results were noted by Klepac and Hampel (2017) and Fertő et al. (2024). Other financial ratios had lower predictive ability, with no predictive ability for activity ratios - Altman (2002) eliminated the total assets turnover ratio from his model, and Boďa and Úradníček (2019) noted lower predictive power for activity indicators due to high inter-company volatility. The dependence between the activity ratios and company's production focus was demonstrated by Lososová and Zdeněk (2013).
Indebtedness and liquidity did not predict future development. The correlation between profitability and liquidity is often debated, with mixed results - Ehiedu (2014) hypothesises a positive correlation between ROA and liquidity; Saleem and Rehman (2011) note a low dependence on most profitability indicators. In agriculture, liquidity depends more on production focus (Střeleček et al., 2011). Most studies indicate a negative correlation between profitability and indebtedness (Gabrić, 2015; Maxim, 2021), Muscettola and Naccarato (2016) found correlation that was negative in successful sectors but positive in failed sectors. Due to historical factors, indebtedness depends on legal form in Czech agriculture (Aulová and Hlavsa, 2013).
Using per-hectare indicators led to higher prediction reliability. Revenue per hectare, asset per hectare, and debt per hectare were effective predictors. This may be due to better consideration of production intensity or shortcomings in Czech national accounting. If the first reason were valid, then using per-hectare indicators to predict future development would have general validity. It would also be possible to recommend them for other models. The impact of accounting methods on financial statement explanatory power was discussed by Drábková (2018) and Sedláček (2010). Czech standards do not include leased or subsidised property in the balance sheet (Střeleček et al., 2010; Zdeněk et al., 2024), which distorts financial statements. The higher predictive ability of per-hectare indicators might not apply to International Financial Reporting Standards-accounting companies despite providing a more accurate financial view (Basu et al., 1998; Ashbaugh and Pincus, 2001; Beaver et al., 2012; Elad, 2004; Argilés-Bosch et al., 2012).
The idea that business success could be predicted from yield indicators was not confirmed. Above-average yields did not necessarily lead to higher profits, and farms with different intensities could achieve similar profitability. For example, a positive relationship between yield per hectare and profitability is assumed by Cornia (1985), but Hyblova and Skalicky (2018) found mixed results. The influence of company size was highlighted by Chrastinová (2008), and studies on crop production confirmed the ambiguous effect of production intensity on profitability (Krpalkova et al., 2016; Gołaś, 2017).
The focus on Czech farms brings to light a possible limitation of the usability of some of the results. The model is entirely usable only for agricultural farms. The findings regarding the low predictive ability of activity, liquidity, and debt indicators are based on the specifics of farms in Central Europe and may not be generally valid. Similarly, the findings that the success and threats of farms are relatively stable factors, and their future development can be reliably predicted but can be applied only to Czech companies. On the other hand, other results can be generalized (with a certain amount of caution) and used for further research. The prediction of the relative success of a company (as given by the company's rank) can be beneficial in industries with a strong influence from external factors (i.e., in a situation that does not allow for the prediction of absolute success). The advantage of this model is that it can predict the company's future development so that the influence of external factors is eliminated, and the model best estimates the success of management - a significant finding in terms of the form of independent variables. Using a four-year average can lead to a significantly better prediction than its current value in certain industries. The results also showed the importance of using volatility to predict future development. Based on financial indicators without volatility, it was not possible to identify companies at risk of profitability fluctuations. This finding may also be important in other highly volatile industries. Using adjusted per-hectare ratios allows for better benchmarking, especially in countries where accounting systems could distort financial statements. It is critical for consultants and banks when comparing different business models. Governments can use this research to better target subsidies or support schemes - focusing on farms at risk due to volatility or structural disadvantages (e.g., undiversified production).
Data availability statement
Data will be available upon request via email.
Acknowledgments
This article was supported by institutionally funded research at the University of South Bohemia, Faculty of Economics, Department of Accounting and Finances (RVO160).
References
-
Altman EI. 1968. Financial ratios, discriminant analysis and the prediction of corporate bankruptcy. The Journal of Finance 23: 589-609. https://doi.org/10.2307/2978933
» https://doi.org/10.2307/2978933 - Altman EI. 1983. Corporate Financial Distress: A Complete Guide to Predicting, Avoiding, and Dealing with Bankruptcy. 1ed. John Wiley & Sons, Hoboken, NJ, USA.
- Altman EI. 2002. Bankruptcy, Credit Risk, and High Yield Junk Bonds. 1ed. Wiley-Blackwell, Hoboken, NJ, USA.
-
Annan F, Tack J, Harri A, Coble K. 2013. Spatial Pattern of Yield Distributions: Implications for Crop Insurance. American Journal of Agricultural Economics 96: 253-268. https://doi.org/10.1093/ajae/aat085
» https://doi.org/10.1093/ajae/aat085 -
Argilés-Bosch JM, Aliberch AS, Blandón JG. 2012. A Comparative Study of Difficulties in Accounting Preparation and Judgement in Agriculture Using Fair Value and Historical Cost for Biological Assets Valuation. Revista de Contabilidad 15: 109-142. https://doi.org/10.1016/S1138-4891(12)70040-7
» https://doi.org/10.1016/S1138-4891(12)70040-7 -
Ashbaugh H, Pincus M. 2001. Domestic Accounting Standards, International Accounting Standards, and the Predictability of Earnings. Journal of Accounting Research 39: 417-434. https://doi.org/10.1111/1475-679X.00020
» https://doi.org/10.1111/1475-679X.00020 -
Aulová R, Hlavsa T. 2013. Capital Structure of Agricultural Businesses and its Determinants. Agris on-line Papers in Economics and Informatics 5: 23-36. https://doi.org/10.22004/ag.econ.152688
» https://doi.org/10.22004/ag.econ.152688 -
Barnes AP, Hansson H, Manevska-Tasevska G, Shrestha SS, Thomson SG. 2015. The influence of diversification on long-term viability of the agricultural sector. Land Use Policy 49: 404-412. https://doi.org/10.1016/j.landusepol.2015.08.023
» https://doi.org/10.1016/j.landusepol.2015.08.023 -
Basu S, Hwang L, Jan C-L. 1998. International variation in accounting measurement rules and analysts’ earnings forecast errors. Journal of Business Finance and Accounting 25: 1207-1247. https://doi.org/10.1111/1468-5957.00234
» https://doi.org/10.1111/1468-5957.00234 -
Beaver WH, Correia M, McNichols MF. 2012. Do differences in financial reporting attributes impair the predictive ability of financial ratios for bankruptcy? Review of Accounting Studies 17: 969-1010. https://doi.org/10.1007/s11142-012-9186-7
» https://doi.org/10.1007/s11142-012-9186-7 - Boďa M, Úradníček V. 2019. Predicting Financial Distress of Slovak Agricultural Enterprises. Ekonomický časopis 67: 426-452.
-
Bojnec Š, Fertő I. 2020. Testing the validity of Gibrat's law for Slovenian farms: cross-sectional dependence and unit root tests. Economic Research-Ekonomska Istraživanja 33:1280-1293. https://doi.org/10.1080/1331677X.2020.1722722
» https://doi.org/10.1080/1331677X.2020.1722722 -
Bojnec Š, Fertő I. 2021. Does human capital play an important role in farm size growth? The case of Slovenia. New Medit 20: 57-69. https://doi.org/10.30682/nm2101d
» https://doi.org/10.30682/nm2101d -
Bojnec Š, Fertő I. 2024. Financial constraints and nonlinearity of farm size growth. Journal of Advances in Management Research 21: 153-172. https://doi.org/10.1108/JAMR-02-2023-0053
» https://doi.org/10.1108/JAMR-02-2023-0053 -
Breiman L. 2001. Random forests. Machine Learning 45: 5-32. https://doi.org/10.1023/A:1010933404324
» https://doi.org/10.1023/A:1010933404324 -
Čechura L, Žáková Kroupová Z, Lekešová M. 2022. Productivity and efficiency in Czech agriculture: Does farm size matter? Agricultural Economics – Czech 68: 1-10. https://doi.org/10.17221/384/2021-AGRICECON
» https://doi.org/10.17221/384/2021-AGRICECON -
Céu MS, Gaspar RM. 2022. Vegetative cycle and bankruptcy predictors of agricultural firms. Agricultural Economics – Czech 68: 445-454. https://doi.org/10.17221/206/2022-AGRICECON
» https://doi.org/10.17221/206/2022-AGRICECON -
Chibanda C, Agethen K, Deblitz C, Zimmer Y, Almadani MI, Garming H, et al. 2020. The Typical Farm Approach and Its Application by the Agri Benchmark Network Agriculture 10: 646. https://doi.org/10.3390/agriculture10120646
» https://doi.org/10.3390/agriculture10120646 -
Chrastinová Z. 2008. Economic differentiation in Slovak agriculture. Agricultural Economics – Czech 54: 536-545. https://doi.org/10.17221/262-AGRICECON
» https://doi.org/10.17221/262-AGRICECON -
Coble KH, Heifner RG, Zuniga M. 2000. Implications of Crop Yield and Revenue Insurance for Producer Hedging. Journal of Agricultural and Resource Economics 25: 432-452. https://doi.org/10.22004/ag.econ.30895
» https://doi.org/10.22004/ag.econ.30895 -
Coppola A, Scardera A, Amato M, Verneau F. 2020. Income Levels and Farm Economic Viability in Italian Farms: An Analysis of FADN Data. Sustainability 12: 4898. https://doi.org/10.3390/su12124898
» https://doi.org/10.3390/su12124898 -
Cornia GA. 1985. Farm size, land yields and the agricultural production function: An analysis for fifteen developing countries. World Development 13: 513-534. https://doi.org/10.1016/0305-750X(85)90054-3
» https://doi.org/10.1016/0305-750X(85)90054-3 -
Czech Statistical Office [CSO]. 2023. Producer prices. CSO, Prague, Czechia. Available at: https://csu.gov.cz/prices-inflation [Accessed Sept 15, 2023]
» https://csu.gov.cz/prices-inflation -
Dambolena IG, Khoury SJ. 1980. Ratio Stability and Corporate Failure. The Journal of Finance 35: 1017-1026. https://doi.org/10.1111/j.1540-6261.1980.tb03517.x
» https://doi.org/10.1111/j.1540-6261.1980.tb03517.x -
Di Falco S, Perrings C. 2003. Crop Genetic Diversity, Productivity and Stability of Agroecosystems. A Theoretical and Empirical Investigation. Scottish Journal of Political Economy 50: 207-216. https://doi.org/10.1111/1467-9485.5002006
» https://doi.org/10.1111/1467-9485.5002006 -
Di Falco S, Chavas J-P. 2006. Crop genetic diversity, farm productivity and the management of environmental risk in rainfed agriculture. European Review of Agricultural Economics 33: 289-314. https://doi.org/10.1093/eurrag/jbl016
» https://doi.org/10.1093/eurrag/jbl016 -
Díaz-Bonilla E. 2016. Volatile Volatility: Conceptual and Measurement Issues Related to Price Trends and Volatility. p. 35-57. In: Kalkuhl M, von Braun J, Torero M. eds. Food Price Volatility and Its Implications for Food Security and Policy. Springer, Cham, Switzerland. https://doi.org/10.1007/978-3-319-28201-5_2
» https://doi.org/10.1007/978-3-319-28201-5_2 -
Dichev ID, Tang VW. 2009. Earnings volatility and earnings predictability. Journal of Accounting and Economics 47: 160-181. https://doi.org/10.1016/j.jacceco.2008.09.005
» https://doi.org/10.1016/j.jacceco.2008.09.005 - Dirickx Y, Van Landeghem G. 1994. Statistical Failure Prevision Problems. Tijdschrift voor Economie en Management 39: 429-462.
-
Doumpos M, Andriosopoulos K, Galariotis E, Makridou G, Zopounidis C. 2017. Corporate failure prediction in the European energy sector: A multicriteria approach and the effect of country characteristics. European Journal of Operational Research 262: 347-360. https://doi.org/10.1016/j.ejor.2017.04.024
» https://doi.org/10.1016/j.ejor.2017.04.024 -
Drábková Z. 2018. CFEBT Risk Triangle as a Tool for Detecting and Evaluating Risks of Accounting Records: a Case Study. Acta Universitatis Agriculturae et Silviculturae Mendelianae Brunensis 66: 747-754. https://doi.org/10.11118/actaun201866030747
» https://doi.org/10.11118/actaun201866030747 -
Eder A. 2025. The Effect of Land Fragmentation on Risk and Technical Efficiency of Austrian Crop Farms. Journal of Agricultural Economics 76: 391-404. https://doi.org/10.1111/1477-9552.12626
» https://doi.org/10.1111/1477-9552.12626 - Ehiedu VC. 2014. The Impact of Liquidity on Profitability of Some Selected Companies: The Financial Statement Analysis (FSA) Approach. Research Journal of Finance and Accounting 5: 81-90.
-
Elad C. 2004. Fair value accounting in the agricultural sector: some implications for international accounting harmonization. European Accounting Review 13: 621-641. https://doi.org/10.1080/0963818042000216839
» https://doi.org/10.1080/0963818042000216839 -
Fan Y, Guoyong W, Riaz N, Radlińska K. 2024. Technical efficiency and farm size in the context of sustainable agriculture. Agricultural Economics – Czech 70: 446-456. https://doi.org/10.17221/158/2024-AGRICECON
» https://doi.org/10.17221/158/2024-AGRICECON -
Fertő I, Bojnec Š, Iwasaki I, Shida Y. 2024. Why do corporate farms survive in Central and Eastern Europe? Agricultural Systems 218: 103965. https://doi.org/10.1016/j.agsy.2024.103965
» https://doi.org/10.1016/j.agsy.2024.103965 - Fiala R, Hedija V, Dvořák J, Jánský J. 2020. Are profitable firms also financially healthy? Empirical evidence for pig-breeding sector. Custos e Agronegocio 16: 173-201.
-
Frankel R, Litov L. 2009. Earnings persistence. Journal of Accounting and Economics 47: 182-190. https://doi.org/10.1016/j.jacceco.2008.11.008
» https://doi.org/10.1016/j.jacceco.2008.11.008 - Gabrić D. 2015. Empirical Analysis Of The Profitability And Indebtedness In Listed Companies - Evidence From The Federation Of B&H. Economic Review - Journal of Economics and Business 13: 35-51.
-
Gavurova B, Packova M, Misankova M, Smrcka L. 2017. Predictive potential and risks of selected bankruptcy prediction models in the Slovak business environment. Journal of Business Economics and Management 18: 1156-1173. https://doi.org/10.3846/16111699.2017.1400461
» https://doi.org/10.3846/16111699.2017.1400461 -
Gołaś Z. 2017. Determinants of milk production profitability of dairy farms in the EU member states. Problems of Agricultural Economics 3: 19-40. https://doi.org/10.5604/00441600.1245843
» https://doi.org/10.5604/00441600.1245843 - Goodwin BK, Roberts MC, Coble KH. 2000. Measurement of Price Risk in Revenue Insurance: Implications of Distributional Assumptions. Journal of Agricultural and Resource Economics 25: 195-214.
-
Goodwin BK, Harri A, Rejesus RM, Coble KH. 2018. Measuring Price Risk in Rating Revenue Coverage: BS or No BS? American Journal of Agricultural Economics 100: 456-478. https://doi.org/10.1093/ajae/aax083
» https://doi.org/10.1093/ajae/aax083 -
Graham JR, Harvey CR, Rajgopal S. 2005. The economic implications of corporate financial reporting. Journal of Accounting and Economics 40: 3-73. https://doi.org/10.1016/j.jacceco.2005.01.002
» https://doi.org/10.1016/j.jacceco.2005.01.002 -
Guvele CA. 2001. Gains from crop diversification in the Sudan Gezira scheme. Agricultural Systems 70: 319-333. https://doi.org/10.1016/S0308-521X(01)00030-0
» https://doi.org/10.1016/S0308-521X(01)00030-0 - Harwood J, Heifner R, Coble KH, Perry J, Somwaru A. 1999. Managing Risk in Farming: Concepts, Research, and Analysis. Economic Research Service, Washington, DC, USA.
-
Hlavsa T, Spicka J, Stolbova M, Hlouskova Z. 2020. Statistical analysis of economic viability of farms operating in Czech areas facing natural constraints. Agricultural Economics – Czech 66: 193-202. https://doi.org/10.17221/327/2019-AGRICECON
» https://doi.org/10.17221/327/2019-AGRICECON -
Hyblova E, Skalicky R. 2018. Return on sales and wheat yields per hectare of European agricultural entities. Agricultural Economics – Czech 64: 436-444. https://doi.org/10.17221/209/2017-AGRICECON
» https://doi.org/10.17221/209/2017-AGRICECON -
Jones S, Johnstone D, Wilson R. 2017. Predicting Corporate Bankruptcy: An evaluation of Alternative Statistical Frameworks: An Evaluation of Alternative Statistical Frameworks. Journal of Business Finance and Accounting 44: 3-34. https://doi.org/10.1111/jbfa.12218
» https://doi.org/10.1111/jbfa.12218 -
Just RE, Weninger Q. 1999. Are Crop Yields Normally Distributed? American Journal of Agricultural Economics 81: 287-304. https://doi.org/10.2307/1244582
» https://doi.org/10.2307/1244582 -
Karas M, Režňáková M, Pokorný P. 2017. Predicting bankruptcy of agriculture companies: validating selected models. Polish Journal of Management Studies 15: 110-120. https://doi.org/10.17512/pjms.2017.15.1.11
» https://doi.org/10.17512/pjms.2017.15.1.11 -
Klepac V, Hampel D. 2017. Predicting financial distress of agriculture companies in EU. Agricultural Economics – Czech 63: 347-355. https://doi.org/10.17221/374/2015-AGRICECON
» https://doi.org/10.17221/374/2015-AGRICECON -
Kopta D. 2009. Possibilities of financial health indicators used for prediction of future development of agricultural enterprises. Agricultural Economics – Czech 55: 111-125. https://doi.org/10.17221/589-AGRICECON
» https://doi.org/10.17221/589-AGRICECON -
Krpalkova L, Cabrera VE, Kvapilik J, Burdych J. 2016. Dairy farm profit according to the herd size, milk yield, and number of cows per worker. Agricultural Economics – Czech 62: 225-234. https://doi.org/10.17221/126/2015-AGRICECON
» https://doi.org/10.17221/126/2015-AGRICECON -
Latruffe L, Diazabakana A, Bockstaller C, Desjeux Y, Finn J, Kelly E, et al. 2016. Measurement of sustainability in agriculture: a review of indicators. Studies in Agricultural Economics 118: 123-130. https://doi.org/10.7896/j.1624
» https://doi.org/10.7896/j.1624 -
Lee H, Bogner C, Lee S, Koellner T. 2016. Crop selection under price and yield fluctuation: Analysis of agro-economic time series from South Korea. Agricultural Systems 148: 1-11. https://doi.org/10.1016/j.agsy.2016.06.003
» https://doi.org/10.1016/j.agsy.2016.06.003 - Li J, Rahgozar R. 2012. Application of the Z-Score Model with Consideration of Total Assets Volatility in Predicting Corporate Financial Failures from 2000-2010. Journal of Accounting and Finance 12: 11-19.
-
Liang D, Lu C-C, Tsai C-F, Shih G-A. 2016. Financial ratios and corporate governance indicators in bankruptcy prediction: A comprehensive study. European Journal of Operational Research 252: 561-572. https://doi.org/10.1016/j.ejor.2016.01.012
» https://doi.org/10.1016/j.ejor.2016.01.012 -
Lososová J, Zdeněk R. 2013. Development of farms according to the LFA classification. Agricultural Economics – Czech 59: 551-562. https://doi.org/10.17221/66/2013-AGRICECON
» https://doi.org/10.17221/66/2013-AGRICECON - Maxim LG. 2021. The impact of capital intensity, indebtedness and the size of retail companies on profitability. International Journal of Multidisciplinary and Current Educational Research 3: 107-114.
-
Meuwissen MPM, Huirne RBM, Hardaker JB. 2001. Risk and risk management: an empirical analysis of Dutch livestock farmers. Livestock Production Science 69: 43-53. https://doi.org/10.1016/S0301-6226(00)00247-5
» https://doi.org/10.1016/S0301-6226(00)00247-5 -
Muscettola M, Naccarato F. 2016. The Casual Relationship Between Debt and Profitability: The Case of Italy. Athens Journal of Business and Economics 2: 17-32. https://doi.org/10.30958/ajbe.2-1-2
» https://doi.org/10.30958/ajbe.2-1-2 -
Ohlson JA. 1980. Financial Ratios and the Probabilistic Prediction of Bankruptcy. Journal of Accounting Research 18: 109-131. https://doi.org/10.2307/2490395
» https://doi.org/10.2307/2490395 -
Pellegrini L, Tasciotti L. 2014. Crop diversification, dietary diversity and agricultural income: empirical evidence from eight developing countries. Canadian Journal of Development Studies / Revue Canadienne d’études Du Développement 35: 211-227. https://doi.org/10.1080/02255189.2014.898580
» https://doi.org/10.1080/02255189.2014.898580 -
Prusak B. 2018. Review of Research into Enterprise Bankruptcy Prediction in Selected Central and Eastern European Countries. International Journal of Financial Studies 6: 60. https://doi.org/10.3390/ijfs6030060
» https://doi.org/10.3390/ijfs6030060 -
Purves N, Niblock SJ, Sloan K. 2015. On the relationship between financial and non-financial factors: A case study analysis of financial failure predictors of agribusiness firms in Australia. Agricultural Finance Review 75: 282-300. https://doi.org/10.1108/AFR-04-2014-0007
» https://doi.org/10.1108/AFR-04-2014-0007 -
Rajin D, Milenković D, Radojević T. 2016. Bankruptcy prediction models in the Serbian agricultural sector. Economics of Agriculture 63: 89-105. https://doi.org/10.5937/ekoPolj1601089R
» https://doi.org/10.5937/ekoPolj1601089R -
Ribašauskienė E, Volkov A, Morkūnas M, Žičkienė A, Dabkiene V, Štreimikienė D, et al. 2024. Strategies for increasing agricultural viability, resilience and sustainability amid disruptive events: An expert-based analysis of relevance. Journal of Business Research 170: 114328. https://doi.org/10.1016/j.jbusres.2023.114328
» https://doi.org/10.1016/j.jbusres.2023.114328 -
Rougoor CW, Trip G, Huirnc RBM, Renkema JA. 1998. How to define and study farmers’ management capacity: theory and use in agricultural economics. Agricultural Economics 18: 261-272. https://doi.org/10.1111/j.1574-0862.1998.tb00504.x
» https://doi.org/10.1111/j.1574-0862.1998.tb00504.x - Saleem Q, Rehman RU. 2011. Impacts of liquidity ratios on profitability (Case of oil and gas companies of Pakistan). Interdisciplinary Journal of Research in Business 1: 95-98.
-
Sedláček J. 2010. The methods of valuation in agricultural accounting. Agricultural Economics – Czech 56: 59-66. https://doi.org/10.17221/1487-AGRICECON
» https://doi.org/10.17221/1487-AGRICECON -
Shen F, Liu Y, Wang R, Zhou W. 2020. A dynamic financial distress forecast model with multiple forecast results under unbalanced data environment. Knowledge-Based Systems 192: 105365. https://doi.org/10.1016/j.knosys.2019.105365
» https://doi.org/10.1016/j.knosys.2019.105365 -
Shumway T. 2001. Forecasting Bankruptcy More Accurately: A Simple Hazard Model. The Journal of Business 74: 101-124. https://doi.org/10.1086/209665
» https://doi.org/10.1086/209665 -
Špička J, Boudný J, Janotová B. 2009. The role of subsidies in managing the operating risk of agricultural enterprises. Agricultural Economics – Czech 55: 169-180. https://doi.org/10.17221/17/2009-AGRICECON
» https://doi.org/10.17221/17/2009-AGRICECON -
Špička J, Hlavsa T, Soukupová K, Štolbová M. 2019. Approaches to estimation the farm-level economic viability and sustainability in agriculture: A literature review. Agricultural Economics – Czech 65: 289-297. https://doi.org/10.17221/269/2018-AGRICECON
» https://doi.org/10.17221/269/2018-AGRICECON -
Srebro B, Mavrenski B, Arsić VB, Knežević S, Milašinović M, Travica J. 2021. Bankruptcy Risk Prediction in Ensuring the Sustainable Operation of Agriculture Companies. Sustainability 13: 7712. https://doi.org/10.3390/su13147712
» https://doi.org/10.3390/su13147712 -
Stojanović T, Drinić L. 2017. Applicability of Z-score Models on the Agricultural Companies in the Republic of Srpska (Bosnia and Herzegovina). Agro-knowledge Journal 18: 227-236. https://doi.org/10.7251/AGREN1704227S
» https://doi.org/10.7251/AGREN1704227S -
Střeleček F, Lososová J, Zdeněk R. 2010. The relations between the rent and price of agricultural land in the EU countries. Agricultural Economics – Czech 56: 558-568. https://doi.org/10.17221/130/2010-AGRICECON
» https://doi.org/10.17221/130/2010-AGRICECON -
Střeleček F, Lososová J, Zdeněk R. 2011. Economic results of agricultural enterprises in 2009. Agricultural Economics – Czech 57:103-117. https://doi.org/10.17221/175/2010-AGRICECON
» https://doi.org/10.17221/175/2010-AGRICECON -
Tanaka K, Kinkyo T, Hamori S. 2016. Random forests-based early warning system for bank failures. Economics Letters 148: 118-121. https://doi.org/10.1016/j.econlet.2016.09.024
» https://doi.org/10.1016/j.econlet.2016.09.024 - Weisensel WP, Schoney RA. 1989. An Analysis of the Yield-Price Risk Associated with Specialty Crops. Western Journal of Agricultural Economics 14: 293-299.
-
Zdeněk R, Lososová J, Svoboda J. 2024. How accounting for investment subsidies influences financial performance: an empirical analysis of IAS 20 and Czech accounting legislation. Proceedings of Rijeka School of Economics 42: 509-532. https://doi.org/10.18045/zbefri.2024.2.1
» https://doi.org/10.18045/zbefri.2024.2.1 -
Zhang YY. 2017. A Density-Ratio Model of Crop Yield Distributions. American Journal of Agricultural Economics 99: 1327-1343. https://doi.org/10.1093/ajae/aax021
» https://doi.org/10.1093/ajae/aax021
Edited by
-
Edited by:
Thomas Kumke https://orcid.org/0000-0001-5492-1612