
 Sanitary intelligence and decision-making: Integrated Sanitary Assessment Model for Hospitals
ABSTRACT
This article aims to present the Integrated Hospital Sanitary Assessment Model (MASIH). Its methodological construction took place in two stages, namely: the construction of three indices for hospital evaluation based on potential risks identified in sanitary inspections and the definition of a graphical panel to represent the indices alongside patient safety and infection control data. With the development of MASIH, it became possible to graphically represent the Aggregated Potential Risk Index, the Sanitary Regularity Index, and the Heterogeneity Index, along with patient safety and hospital infection data. The model represents an innovation in the National Sanitary Surveillance System by introducing methods that, for the first time, enable the integration of sanitary inspection, infection control, and patient safety data. This integration enhances Sanitary Surveillance by improving the evaluation and decision-making process while also laying the foundation for the use of artificial intelligence to identify patterns among inspection, infection, and patient safety indicators. The model has been presented and is currently in the implementation phase by the National Sanitary Surveillance Agency.
KEYWORDS
Sanitary surveillance; Risk management; Health services research; Patient safety; Infection control.
RESUMO
Este artigo tem como objetivo apresentar o Modelo de Avaliação Sanitária Integrada de Hospitais (Masih). Sua construção metodológica se deu em duas etapas, a saber: construção de três índices para avaliação de hospitais considerando os riscos potenciais identificados nas inspeções sanitárias; e definição de um painel gráfico para representação dos índices e dos dados de segurança do paciente e controle de infecção. Com o desenvolvimento do Masih, foi possível a representação gráfica contemplando o Índice Agregado de Risco Potencial, o Índice de Regularidade Sanitária e o Índice de Heterogeneidade, além dos dados de segurança do paciente e de infecção hospitalar. O modelo representa uma inovação no Sistema Nacional de Vigilância Sanitária com a introdução de métodos que possibilitam, pela primeira vez, integrar dados de inspeção sanitária, controle de infecção e segurança do paciente. Essa integração contribui com a Vigilância Sanitária para melhorar o processo de avaliação e tomada de decisão, além de estabelecer as bases para utilização de inteligência artificial, visando à identificação de padrões entre os indicadores de inspeção, infecção e segurança do paciente. O modelo foi apresentado e está em fase de implantação pela Agência Nacional de Vigilância Sanitária.
PALAVRAS-CHAVE
Vigilância sanitária; Gestão de risco; Pesquisa sobre serviços de saúde; Segurança do paciente; Controle de infecções.
Introduction
In Brazil, sanitary surveillance actions are carried out by the National Sanitary Surveillance System (SNVS), composed of the National Sanitary Surveillance Agency (ANVISA) and by state and municipal services, with the assistance of official laboratories1. Such actions constitute a duty to protect health, through state intervention, which aims to prevent possible harm, aggravation or risks to the health of the population and to provide greater safety2,3.
The definition of Sanitary Surveillance (VISA), described in Law No. 8080/90, explicitly states its mission to work to control health risks, this being the guiding factor for the actions of the SNVS. To control risks, the SNVS develops a set of inspection, educational, and regulatory actions across a wide range of sectors, including food; health products; medicines; sanitizing products; hygiene products, perfumes, and cosmetics; health services; and a variety of services related to health, in addition to sanitary control of ports, airports, and borders4.
Among the services within the scope of sanitary surveillance, we highlight the Hospital, a health institution that offers continuous care, with patient hospitalization for diagnosis, treatment and rehabilitation, and provides specialized and highly complex care, representing an essential component in the Health Care Network (RAS)5.
Hospitals are highly complex organizations, characterized by the intensive use of technology and the joint work of different professional areas in an interdisciplinary environment. Their central function is to provide care to patients in acute or chronic situations that may develop instability or complications, requiring continuous monitoring in an inpatient setting. In these spaces, actions are developed aimed at health promotion, disease prevention, diagnosis, treatment, and rehabilitation processes. In parallel, hospitals also play an essential role in education, professional training, research, and the analysis of new technologies applied to healthcare6.
Given the importance of hospitals, Ordinance No. 33906 was published in 2013, establishing the National Hospital Care Policy (PNHOSP) within the scope of the Unified Health System (SUS), and establishing among the guidelines of this policy the guarantee of hospital care quality and patient safety, monitoring and evaluation. In order for these guidelines to be met, the SNVS has non-transferable responsibilities, such as the regulation, control, and monitoring of health risks in hospital units.
In order to fulfill this mission, the VISA needs effective means that can enhance its actions6.
The analysis of the quality of hospital services has been gaining relevance in the health sector globally, driven by the demands of funders, managers, professionals, and society itself. In this context, the creation and application of different methodologies have become common, associated with the pursuit of greater transparency in investments, the control of increasingly high healthcare costs, the provision of fair and adequate care, as well as the reduction of discrepancies observed in clinical practices7. Quality of care outcome measurements are increasingly integrated into hospital performance assessments to identify opportunities for improvement. In-hospital mortality, readmissions, and length of stay, for example, are three outcome metrics frequently used to assess the quality of care in hospitals8.
With regard to hospital evaluations, the National Program for the Evaluation of Health Services (PNASS)9, launched in 2005 by the Ministry of Health, stands out as an evaluation instrument linked to the transfer of funds to local managers. The PNASS is composed of three distinct evaluation instruments: a checklist of verification items, a questionnaire directed at users, and a set of indicators constructed from various databases or information systems fed by the establishments, such as, for example, the Outpatient Information System (SIA) and the Hospital Information System (SIH)9. This is an important tool for evaluating health services, with the objective of assessing specialized care facilities, both outpatient and inpatient. The evaluation covers the dimensions of structure, process, outcome, care delivery, risk management, and user satisfaction with the care received9,10.
In Brazil, there are also initiatives within the regulated sector itself, namely healthcare services, aimed at evaluating and improving the quality of services provided. Examples include hospital accreditation programs, certifications, and patient satisfaction surveys7. Furthermore, noteworthy are the evaluations developed by health regulatory authorities, such as the National Supplementary Health Agency (ANS), which, through the Operator Qualification Program, compulsorily evaluates health plan operators using indicators, resulting in the Supplementary Health Performance Index (IDSS), which is now published through a dynamic panel with results displayed in graphs and tables11. Other ANS initiatives are being developed, such as the Hospital Quality Monitoring Program in Supplementary Health, a voluntary program aimed at general hospitals with the objective of monitoring, evaluating, and disseminating the results of 14 indicators classified into three quality domains: effectiveness, efficiency, and safety12.
In England, the Care Quality Commission (CQC) is the independent regulator of health and adult social care. Since 2021, it has used a pillar-based strategy, among which is smarter regulation, directing resources to where they can have the greatest impact, focusing on risk and areas of poor care, to ensure effective, proportionate and efficient regulation13. When inspecting hospitals, it focuses on eight priority services: urgent and emergency care, medical assistance, surgery, intensive care, maternity and gynecology, services for children and young people, end-of-life care, and finally, outpatient services and diagnostic imaging13.
Since 2024, the CQC has maintained five key questions in its assessment framework (safe, effective, caring, responsive to people’s needs, well-conducted), and within each of these, a set of quality statements, which are commitments that healthcare services must fulfill to provide high-quality, patient-centered care13. Each evaluated quality statement receives a score on a scale of 1 to 4, where: 1 - evidence shows significant deficiencies; 2 - evidence shows some deficiencies; 3 - evidence shows a good standard; and 4 - evidence shows an exceptional standard. The scores of the quality statements are then used to generate the key question score, calculated as a percentage by summing the scores of the quality statements and dividing by the number of statements multiplied by the maximum possible score (4). At the key question level, the percentage value translates into the following classification: excellent (88 to 100%); good (63 to 87%); requires improvement (39 to 62%); and inadequate (38% or less)13.
To ensure that areas of low quality do not go unnoticed, CQC uses the following rules in its classification. If the key question score is within the ‘good’ range, but one or more of the quality statement scores are 1, the classification will be limited to ‘requires improvement’. Whereas if the key question score is within the ‘excellent’ range, but one or more of the quality statement scores are 1 or 2, the classification will be limited to ‘good’13.
To obtain aggregated overall service ratings, CQC considers the 5 key questions to be equally important and weighted equally when aggregating. At least 2 of the 5 key questions would normally need to be rated as excellent, and 3 key questions rated as good before an aggregate rating of excellent can be awarded. There are a number of combinations of ratings that will lead to a good rating. The overall service rating will typically be good if there are no inadequate key question ratings and no more than one key question rating that requires improvement. If 2 or more of the key questions are rated as ‘requires improvement’, the overall rating will typically be ‘requires improvement’. If 2 or more of the key questions are rated as inadequate, the overall rating will typically be inadequate. The evidence collected during inspections supports assessments of the quality of care and the production of reports published by the CQC, which also include an overall hospital rating13.
Currently, ANVISA adopts a qualitative/quantitative methodology to evaluate hospital services, allowing for a comprehensive analysis of inspection indicators and data production. This data is available to Visa professionals, facilitating the identification of areas that need improvement and the implementation of effective intervention strategies. Furthermore, regular inspections conducted by Visa seek compliance with sanitary regulations, encouraging the adoption of safe and effective practices14.
Fulfilling one of its essential functions as coordinator of the SNVS, ANVISA, through its General Management of Technology in Health Services (GGTES), launched the National Project for Harmonization of Sanitary Inspection Actions in Health Services and Services of Interest to Health in 2019. The project aims to improve inspection and supervision activities, as well as promote effective monitoring of these actions. For the SNVS, the project provides sanitary inspection tools known as Objective Inspection Guidelines (ROI), which are developed based on the current Regulatory Framework and using the Potential Risk Assessment Model (MARP)14-16. In addition to representing a paradigm shift in the sanitary inspection process within the SNVS, ANVISA developed a Business Intelligence (BI) Panel that allows for the monitoring of inspection actions, offering access to real and up-to-date data on the sanitary situation of health services throughout the country, facilitating decision-making and the implementation of continuous improvements in health services. At the end of 2024, this project was awarded 1st place in the finalist projects category of the ANVISA 25 Years Award.
In addition to managing the risks identified in sanitary inspection actions, Visa develops important actions in the areas of hospital infection control and patient safety. In the context of infection control, ANVISA coordinates the National Program for the Prevention and Control of Healthcare-Associated Infections (PNPCIRAS)17, and has developed national actions in partnership with the Health Secretariats of states, the Federal District, and municipalities, and specialists throughout the country, to carry out surveillance and monitoring of these health problems, as well as to implement actions for the prevention, investigation, and control of infections and infectious outbreaks in health services. The PNPCIRAS aims to reduce, nationwide, the incidence of Healthcare-Associated Infections (HAIs) and Antimicrobial Resistance (AMR) in health services through the implementation of evidence-based infection prevention and control practices. To this end, strategic goals and actions have been defined17.
With regard to patient safety, the National Patient Safety Program (PNSP)18, established by the Ministry of Health through Ordinance GM/MS No. 529/201319, aims to contribute to the improvement of healthcare in all health establishments throughout the national territory, considering that incidents associated with healthcare and, in particular, adverse events (incidents with harm to the patient) represent high morbidity and mortality in health systems18.
Similarly, aiming at the proper management of healthcare risks and the reinforcement of patient safety, ANVISA published the Collegiate Board Resolution (RDC) No. 36/201320, which establishes actions for patient safety in health services and provides other measures, regulating aspects of patient safety, such as the implementation of Patient Safety Nuclei (NSP), the mandatory notification of adverse events, and the preparation of the Patient Safety Plan (PSP)20.
Based on the Integrated Plan of Surveillance Management for Patient Safety in Healthcare Services (2021-2025), ANVISA developed the National Patient Safety Practices Assessment strategy, aimed at hospitals with Intensive Care Units (ICUs). This initiative is carried out in partnership with the NSP of health surveillance of states, the Federal District and municipalities, and the State, District and Municipal Coordination offices of infection control, and aims to promote a culture of safety, emphasizing risk management, quality improvement and the application of best practices in healthcare services21. The tool used in the evaluation has 21 structure and process indicators, based on RDC No. 36/201320, and is made available through an electronic form for completion by the NSPs and the Hospital Infection Control Committee (CCIH), which must also attach specific supporting documentation for the assessed indicators. After this stage, the NSP Visa and the Coordination offices of infection control in the states, the Federal District, and municipalities analyze the forms and documentation, and provide feedback to the evaluated hospitals, giving a deadline for review before the consolidation of local results. The next step involves the NSP Visa and the Coordination teams conducting on-site evaluations in a sample of participating services to verify evidence of the implementation of the indicators assessed as compliant in the document review. Finally, the consolidated results are sent to ANVISA for final consolidation and publication of the national report21.
Although the actions are carried out by the SNVS and a dataset already exists for the areas of sanitary inspection, infection control, and patient safety, this information is not integrated. This gap hinders a comprehensive assessment of the hospital, which is a healthcare facility comprised of a set of in-house or outsourced services that possess unique characteristics and may represent different risk levels due to their heterogeneity. A major challenge for the Visa lies in the difficulty of issuing a single sanitary license, since each sector of the hospital is evaluated individually and has its own potential risks.
It is necessary to develop a methodology that allows for an integrated evaluation of the hospital unit, taking into account sanitary aspects, including the potential individual risks of each sector, issues related to patient safety, and hospital-acquired infections. However, to date, the literature review conducted does not indicate any work in this area, with only specific evaluations of each area being observed.
Therefore, the objective of this article is to present the Integrated Hospital Sanitary Assessment Model (MASIH) with the perspective of generating indices that integrate the MARP/ROI inspection data from the various hospital sectors and an integrated graphical representation of inspection data, patient safety, and infection control.
The MASIH project was presented to GGTES/ANVISA at the end of 2024; the proposal was accepted and it is currently in the implementation phase.
Material and methods
A methodological study was developed during the 2020/2025 doctoral program at the National Institute for Quality Control in Health, comprising two stages: construction of three indices for evaluating hospitals considering the potential risks identified in sanitary inspections, and definition of a graphic panel to represent the indices and patient safety and infection control data.
A literature review was conducted between January 2023 and April 2025, with the aim of understanding hospital assessment programs and identifying the main components considered, with emphasis on the areas of risk management, infection control, and patient safety. To this end, the search was conducted using the databases of the Capes/MEC Periodicals portal, PubMed, and the Virtual Health Library (Bireme) using the following descriptors in Portuguese: “Vigilância Sanitária”, “Gerenciamento de Risco”, “Avaliação de Serviço de Saúde”, “Segurança do Paciente”, “Controle de Infecção”; and in English: “Health Surveillance”, “Risk Management”, “Health Services Research”, “Patient Safety”, “Infection Control”. Whenever possible, the focus was on articles published in the past ten years.
Research was also conducted on the websites of regulatory bodies, such as ANVISA and CQC, finding public hospital evaluation reports on the latter.
The following steps were taken to develop the MASIH:
-
Development of three indices: Aggregate Potential Risk Index (APRI), Sanitary Regularity Index (SRI), and Heterogeneity Index (HI);
-
Proposal for a graphical representation of the indices with the aim of enabling an integrated analysis of hospital risk, but without losing important information from the sectors that compose the hospital;
-
Proposal for an integrated graphical representation of the indices listed in the previous step and the patient safety and infection control data provided by ANVISA for the research;
-
Conducting analyses of the panels with the aim of making adjustments or improvements.
The study focused on the hospital setting, and through collaboration with GGTES/ANVISA, it was possible to utilize data available in the Harmonization of Sanitary Inspections Project related to the sectors of ICU (Intensive Care Unit), Operating Room (OR), Central Sterile Supply Department (CSSD), and Dialysis, for the period from 2020 to 2024. These sectors were selected due to their higher criticality compared to other hospital services, and because they have the largest volume of MARP/ROI evaluation data, in addition to being the sectors most closely related to patient safety and infection control data.
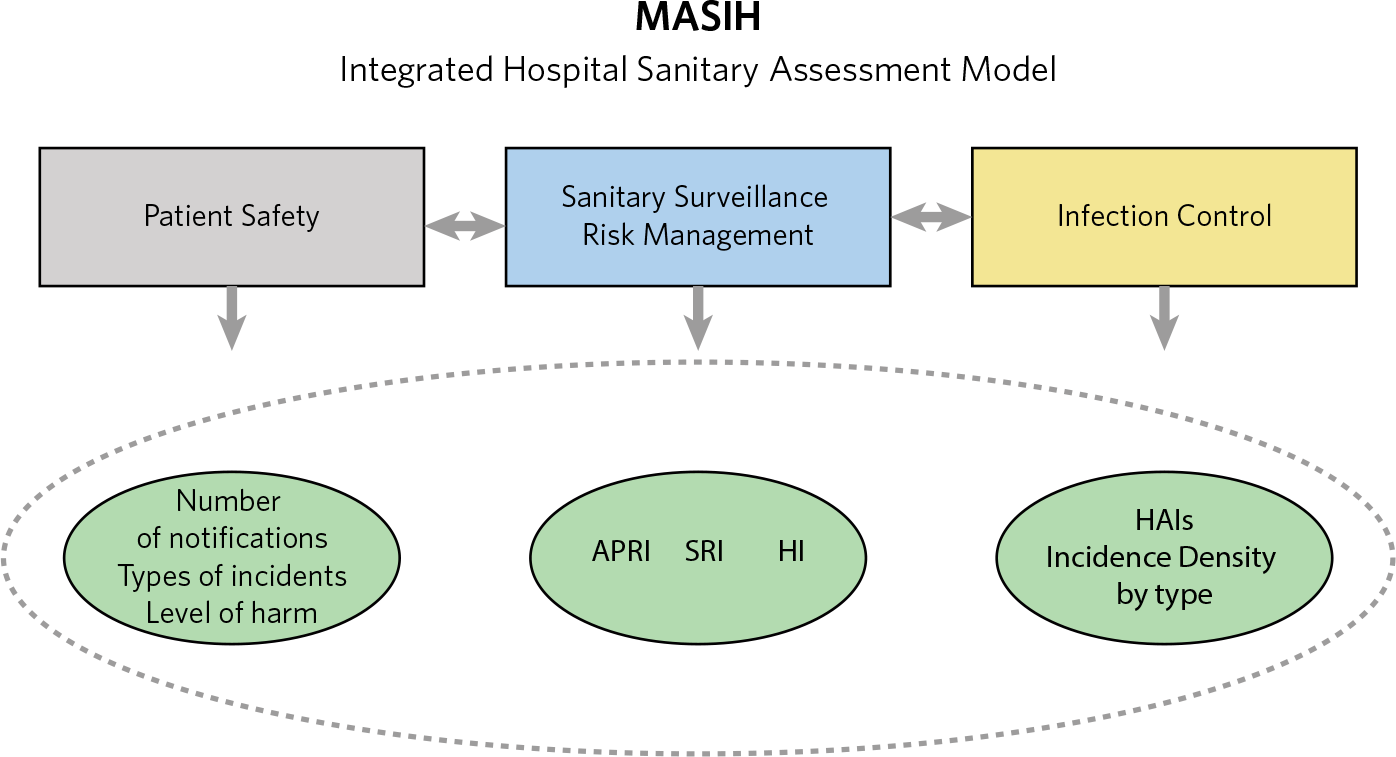
For the graphical representation in the Power BI Panel, patient safety and infection control data were considered, such as the number of notifications, notification status (sent, completed, under review, under correction, under investigation), incident types, incidents by degree of harm and year of use, infection incidence densities by type, and data generated from inspections using the MARP/ROI methodology.
Following the theoretical development of MASIH and the mathematical definition of its indices (APRI, SRI, and HI), a meeting was held with GGTES to present the proposal and, if accepted, evaluate the possible implementation of a Power BI Panel on the ANVISA website.
The proposal of MASIH was accepted by GGTES; and, for the operationalization of the implementation on the ANVISA website, GGTES requested specialized technical support from consultant Dr. Igor Garcia for the development of a BI Panel that would integrate patient safety data, infection control data, and data from sanitary inspections carried out with MARP/ROI. The development has been completed and is currently in the implementation phase.
Results
The MARP/ROI methodology was developed for specific assessments of each sector. It is not possible to sum different assessments to obtain an average value and identify it as a potential risk, since a simple average can mask significant discrepancies between hospital sectors. To advance the MARP/ROI methodology, which is consolidated in the SNVS through the ANVISA Harmonization Project since 2020, the MASIH was developed with three indices, aggregating data to improve the overall hospital assessment.
The first index, named APRI, was developed to enable the calculation of a single value containing data on the potential risks of various sectors that make up a hospital. Using an analogy with physics, APRI can be thought of similarly to an object’s mass center, which is an abstract point representing where all the mass of an object would be if reduced to a single point, with the point being defined as the sum of the product of each mass point of the object multiplied by the distance to its center divided by the sum of the masses. Similarly, the APRI is a point that symbolizes the sum of the product of all potential risks by their respective risk weighting factors representing the potential lethality of each service, divided by the sum of these factors, making it possible to normalize the different potential risks. Thus, if the Potential Risk (PR) of a service could be expressed by a single value, that would be the Index of Aggregate Potential Risk (IAPR), as defined below in equation 1.
Where:
n = number of sectors evaluated; f = weighting factors; PR = Potential Risk.
To define the weighting factors that will be applied to each evaluated sector, it is necessary to consider the criticality and potential impact on the hospital. For this study, the APRI will be applied to the four sectors considered to be of greatest criticality in the Hospital: the ICU (Intensive Care Unit), the OR (Operating Room), the CSSD (Central Sterile Supply Department), and Dialysis, which will therefore receive the same weighting factor, with a value of 1.
If less critical areas, such as inpatient units, hospital laundry, or nutrition services, are included, their weighting factors should be defined and applied to the APRI calculation, since the same potential risk value in different areas represents different risk conditions. For example, an ICU assessed with a potential risk of 0.5 represents a much more serious condition than an inpatient unit assessed with the same potential risk value. Therefore, in order to represent the various services of a hospital on the same graph, it is necessary to normalize these values, weighting them with the risk factor of those units.
In addition to developing the APRI, it is important to provide an analysis that contextualizes potential risks in the evaluated sectors, in order to provide a deep understanding of the hospital’s reality. In this sense, a second index was developed, named SRI, which aims to express, as a percentage, the level of regulatory compliance of the evaluated services.
In the MARP/ROI methodology, indicators are classified on a scale from zero to five, with three describing the sanitary requirement. Values lower than five represent sanitary violations (zero, one, and two), while higher values (four and five) indicate conditions that exceed the requirements established by the standard. Thus, based on this classification, the MARP acceptability ranges within the potential risk area are defined as acceptable, tolerable, and unacceptable. If all indicator ratings are at level three, an acceptable potential risk value of 0.049 (~0.05) is determined; if the value of the selected responses in the ROI is zero, we will have an unacceptable potential risk (1.0); and if the value is 5, the residual risk will be 0.007.
Based on these potential risk values, the Index of Sanitary Regularity (ISR) related to the level of compliance with sanitary standards is defined as follows, in equation 2.
Where:
PR(Medium) = Medium Potential Risk.
Therefore, if the hospital’s services are evaluated using indicators with a response of three, the medium potential risk value will be 0.05, resulting in an SRI of 100%. Similarly, using the MARP/ROI limit ranges, the SRI varies from 5% to 104%, showing that the service can have a higher acceptance level than compliance with the standard (104%) when the medium potential risk value is the minimum value (0.007), and a minimum level of compliance with the standard of 5% when the hospital’s medium potential risk is evaluated at the maximum value (1.00), similar to the residual potential risk, which is never zero.
The SRI is graphically represented using scatter plots, allowing for the establishment of acceptable ranges, classified as follows: between 70 and 104%, acceptable; between 40 and 70%, tolerable; and below 40%, unacceptable.
The third index developed was the HI, used to consider the differences between the various sectors in the overall evaluation of the hospital. When the potential risk values of the different hospital services are represented, the dispersion of these values will indicate how different the hospital’s practices are. In this way, the Index of Heterogeneity (IH) will indicate how dispersed the potential risk values of the hospital sectors are, as defined below in equation 3.
Where:
PR(Max) = Maximum Potential Risk; PR(Medium) = Medium Potential Risk; PR(Mín) = Minimum Potential Risk.
The desirable situation for potential risk assessment in a hospital is that there is the greatest uniformity of risk among sectors and a high level of regulatory compliance. The HI indicates whether there are extremes in the assessments of the hospital’s sectors, because even with a good APRI and a sanitary regularity index classified in the acceptable range, it is possible that some sectors may have a potential risk classification in the tolerable or even unacceptable range.
In addition to developing indices to enable the evaluation of the Hospital considering the specificities of its component sectors, one of the innovations of this work is the proposal of a graphical representation for an overall analysis of the hospital.
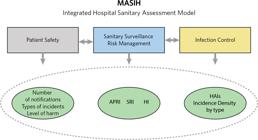
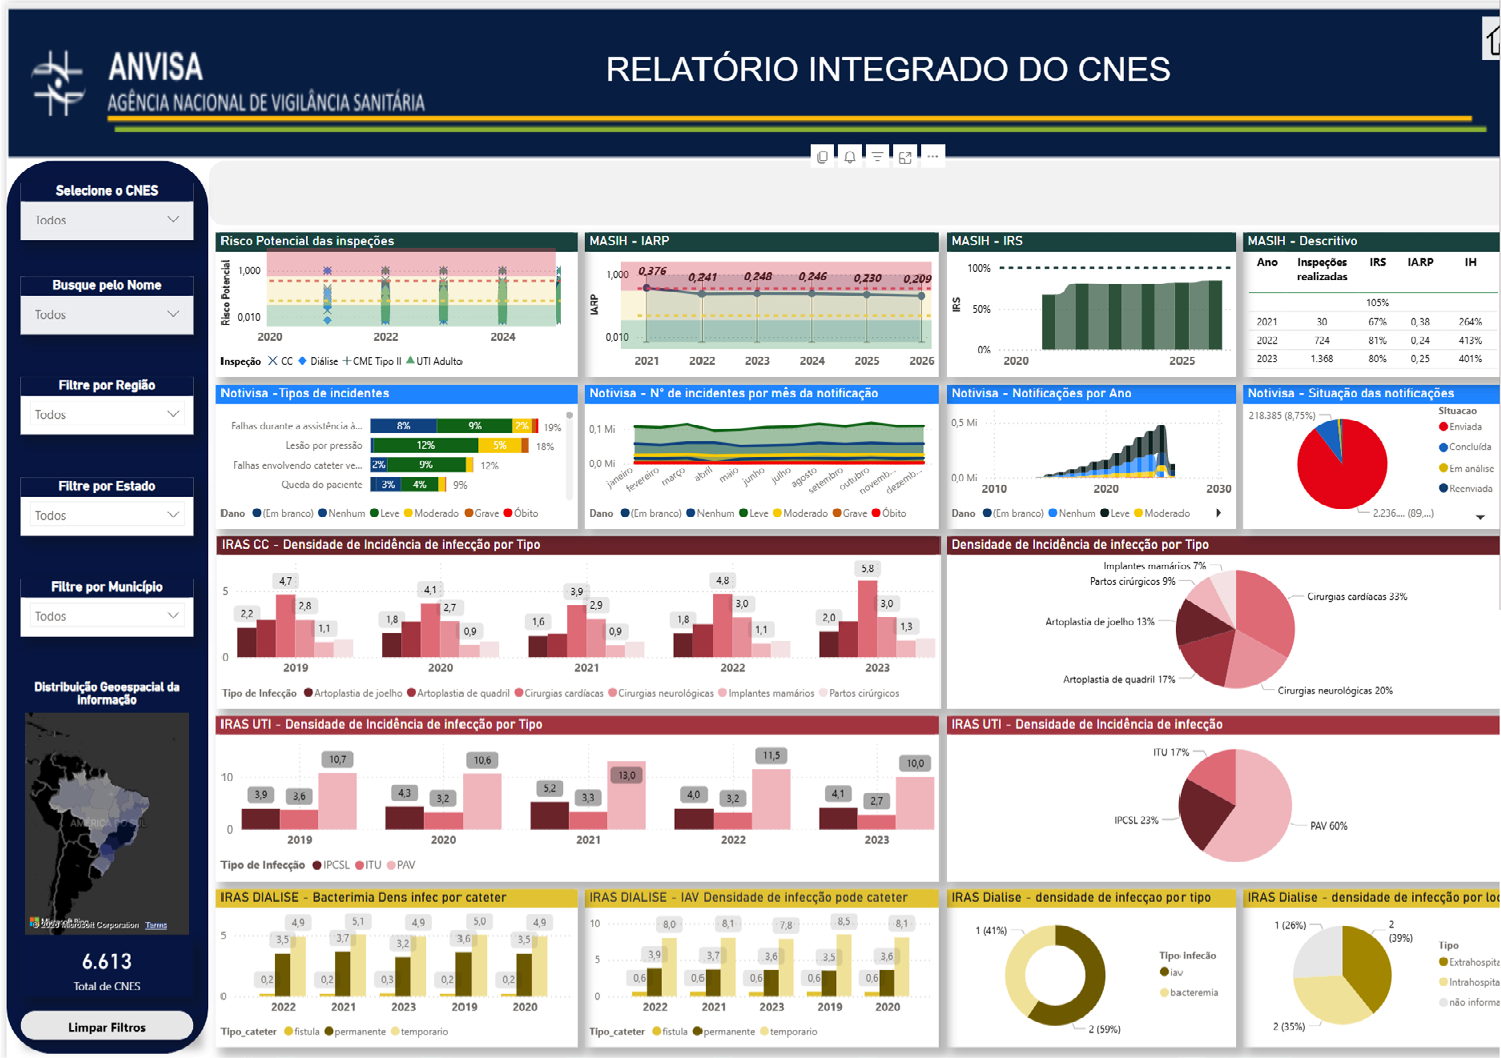
In this sense, an information panel was designed that offers a graphical representation of the MASIH indices integrated with graphs related to patient safety and infection control data. The development of the panel’s programming was carried out using Microsoft’s Power BI tool by ANVISA consultant, Dr. Igor Garcia.
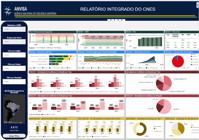
Patient safety data, such as the number of notifications, types of incidents by degree of harm, year of notification, and number of incidents per month, are presented on the panel in an integrated manner with sanitary inspection data represented by the MASIH indices, as well as HAIs (Healthcare-Associated Infections) data, which provide information on infection incidence density by type. This innovation allows for a joint analysis of this data, offering health surveillance professionals and managers a wealth of information for more informed decision-making and assisting in the more efficient allocation of resources.
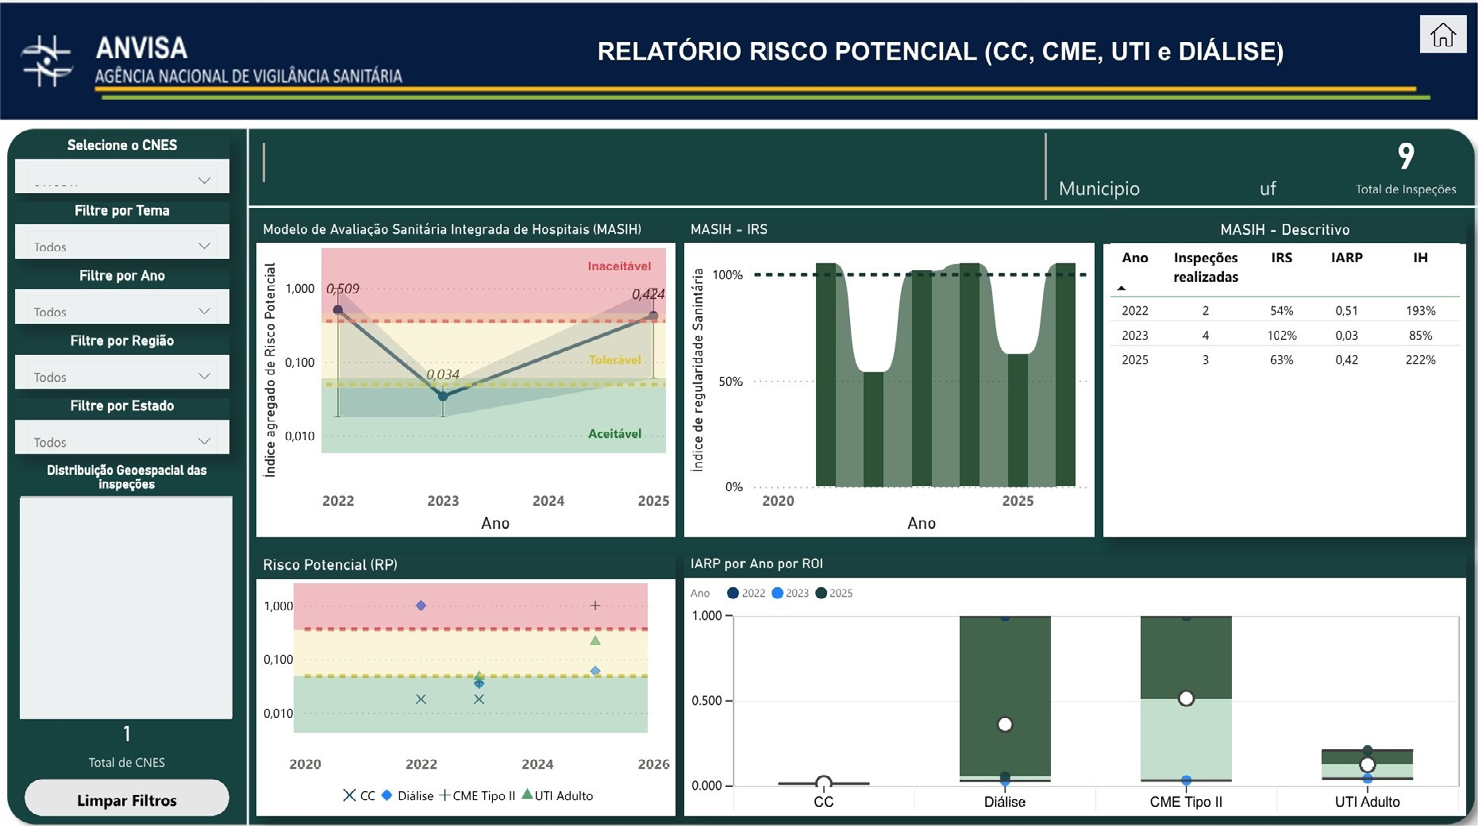
Figure 3 below shows an enlarged view of the sanitary inspection data, obtained through APRI, which allows for verification of the hospital’s overall assessment each year based on the potential risk values of the sectors.
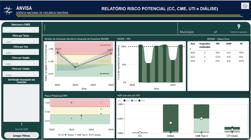
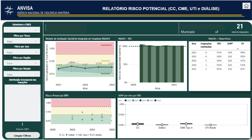
Through the integrated panel, it is possible to quickly understand the overall state of the evaluated hospital, as well as identify discrepancies between evaluated sectors, highlighting, through the HI, those that present a significantly different potential risk from the average, that is, exceptionally good or bad sectors.
Discussion
Currently, ANVISA, through the National Project for Harmonization of Sanitary Inspections, adopts the MARP/ROI methodology to evaluate some hospital sectors and has enabled the production of sanitary surveillance data through the analysis of sanitary inspection indicators. This data is information produced by the state and municipal Visa during inspections and can substantially contribute to improving their decision-making, as the data available to Visa’s professionals facilitates the identification of areas that need improvement and the implementation of effective planning and intervention strategies.
Through the BI panel developed within the Harmonization Project, the Visas monitor inspections carried out with the MARP/ROI tool throughout the country, representing a significant advancement for the National Sanitary Surveillance System (SNVS). However, the Project’s evaluations compare the temporal evolution of the same hospital services, such as the ICU over time, or the potential risk of ICUs in various hospitals. There was no unified representation of the potential risks of the various sectors of a hospital, nor indices to evaluate the hospital in an aggregated way with quantitative comparison indicators, and it did not allow for a comprehensive view of the hospital.
MASIH was created to fill this gap because, through APRI, it brings added value to the hospital’s representation, and, based on HI, it indicates the importance of considering specific assessments of the sectors that make up the hospital unit, given the diversity of risks in each of them. Similarly to the methodology developed and practiced in the UK’s CQC, the sectors need to be taken into consideration, and not just the hospital as a whole.
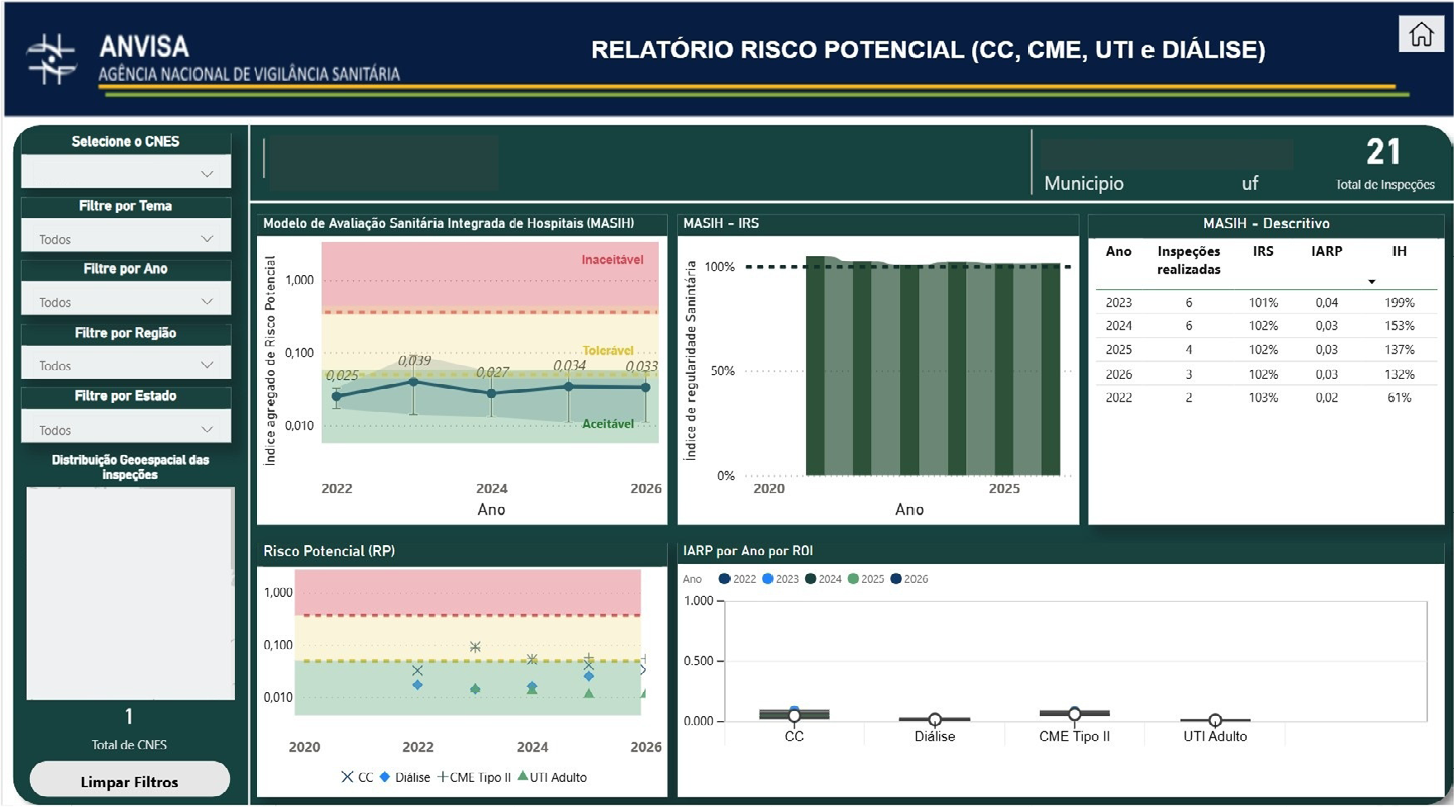
As illustrated in figure 4, it can be seen that, although in some situations the APRI values are quite close - such as 0.025 in 2022 and 0.027 in 2024 - the assessments carried out in the hospital may reveal sectors with significantly different potential risk classifications. This variation is represented by the HI.
On the other hand, patient safety monitoring and hospital infection control programs have many actions developed by Visa and monitor their information separately, with existing databases and tools published on ANVISA’s websites related to patient safety.
The inspection actions carried out by Visa are closely related to the control of healthcare-associated infections (HAIs), since the structure and processes of critical sectors, such as the ICU (Intensive Care Unit), Operating Room (OR), Central Sterile Supply Department (CSSD), and Dialysis, are priority areas of Visa’s work. Sanitary surveillance focuses on ensuring that these sectors follow hygiene and safety standards established in the regulatory framework and that are fundamental for the prevention of HAIs.
Thus, in addition to the development of the three indices (APRI, SRI, and HI), which allow for a global view of the hospital, the integration of patient safety, infection control, and sanitary inspection data into a Power BI Panel is an innovation from MASIH that will increasingly contribute to the development of actions in these areas and assist the Brazilian National Sanitary Surveillance Agency (ANVISA) in making qualified and data-driven decisions regarding sanitary surveillance. It should be noted that the Power BI Panel programming was developed for ANVISA by researcher Dr. Igor Garcia.
It is necessary to highlight the importance of the data generated by the Visas, which are very rich, especially those from sanitary inspections. In many Brazilian sanitary surveillance services, this data is lost after the completion of the sanitary permit processes, becoming part of an inactive archive. The Harmonization of Inspections project and the graphical panels developed within the scope of ANVISA change this reality, as the records of inspections carried out by the SNVS become part of a large database, allowing for consultation of the historical potential risk of these services over the years.
Conclusions
Based on the results and discussions of this project, it was possible to verify that the objectives of presenting MASIH, with the perspective of generating indices that integrate the MARP/ROI inspection data from the various sectors of the hospital and an integrated graphical representation of inspection data, patient safety, and infection control, were achieved.
The MASIH system represents a significant innovative milestone in the SNVS (National Sanitary Surveillance System), introducing technologies that, for the first time, enabled the integration of data that, despite being centralized in the same General Management of ANVISA (GGTES), were located in different Management units (Health Services Surveillance and Monitoring Management - GVIMS and Health Services Regulation and Sanitary Control Management - GRECS) and had never been presented together. With this integration, the SNVS will have a technological tool that presents results graphically and quantitatively, enabling better evaluation and decision-making, including sanitary licensing.
The implementation of MASIH will enable the continuation of technological developments, including the use of Artificial Intelligence (AI), to identify patterns and find possible relationships between the inspection indicators included in the ROI and occurrences related to patient safety and hospital-acquired infections. Identifying these possible relationships may establish connections between cause (non-compliance with a standard item) and consequence (hospital-acquired infection, death, fall), broadening the concept of potential risk and strengthening the importance of regulations for effective patient safety.
-
Financial support:
Non-existent
Data availability:
The research data is contained within the manuscript itself
References
-
1 Presidência da República (BR). Lei no 9.782, de 26 de janeiro de 1999. Define o Sistema Nacional de Vigilância Sanitária, e dá outras providências [Internet]. Diário Oficial da União, Brasília, DF. 1999 jan 27 [acesso em 2026 abr 2]; Seção I:1. Disponível em: https://www.planalto.gov.br/ccivil_03/leis/l9782.htm
» https://www.planalto.gov.br/ccivil_03/leis/l9782.htm -
2 Alencar MLSM, Bacelar VMB, Magajewski F, et al. Qualificação das ações de vigilância sanitária: harmonização e descentralização. Vigilância Sanitária em Debate. 2019;7(4):111. DOI: https://doi.org/10.22239/2317-269x.01401
» https://doi.org/10.22239/2317-269x.01401 -
3 De Seta MH, Oliveira CVDS, Pepe VLE. Proteção à saúde no Brasil: O sistema nacional de vigilância sanitária. Ciênc saúde coletiva. 2017;22(10):3225-34. DOI: https://doi.org/10.1590/1413-812320172210.16672017
» https://doi.org/10.1590/1413-812320172210.16672017 -
4 Presidência da República (BR). Lei nº 8.080, de 20 de setembro de 1990. Dispõe sobre as condições para a promoção, proteção e recuperação da saúde, a organização e o funcionamento dos serviços correspondentes e dá outras providências [Internet]. Diário Oficial da União, Brasília, DF. 1990 set 20 [acesso em 2026 abr 2]; Seção I:1. Disponível em: https://www.planalto.gov.br/ccivil_03/LEIS/L8080.htm
» https://www.planalto.gov.br/ccivil_03/LEIS/L8080.htm -
5 Da Silva JAA, Costa EA, Lucchese G. Unified health system 30th birthday: Health surveillance. Ciênc saúde coletiva. 2018;23(6):1953-62. DOI: https://doi.org/10.1590/1413-81232018236.04972018
» https://doi.org/10.1590/1413-81232018236.04972018 -
6 Ministério da Saúde (BR). Portaria nº 3.390, de 30 de dezembro de 2013. Institui a Política Nacional de Atenção Hospitalar (PNHOSP) no âmbito do Sistema Único de Saúde (SUS), estabelecendo-se as diretrizes para a organização do componente hospitalar da Rede de Atenção à Saúde (RAS) [Internet]. Diário Oficial da União, Brasília, DF. 2013 dez 31 [acesso em 2026 abr 2]; Seção I:1. Disponível em: https://bvsms.saude.gov.br/bvs/saudelegis/gm/2013/prt3390_30_12_2013.html
» https://bvsms.saude.gov.br/bvs/saudelegis/gm/2013/prt3390_30_12_2013.html -
7 Machado JP, Martins ACM, Martins MS. Avaliação da qualidade do cuidado hospitalar no Brasil: uma revisão sistemática. Cad Saúde Publica. 2013;29(6):1063-82. DOI: https://doi.org/10.1590/S0102-311X2013000600004
» https://doi.org/10.1590/S0102-311X2013000600004 -
8 Arega B, Mengistu M, Mersha A, et al. Evaluation of hospital quality of care outcomes in a teaching hospital in Ethiopia: a retrospective database study. BMJ Open. 2024;14(9):e082908. DOI: https://doi.org/10.1136/bmjopen-2023-082908
» https://doi.org/10.1136/bmjopen-2023-082908 -
9 Ministério da Saúde (BR), Secretaria Executiva, Departamento de Regulação, Avaliação e Controle de Sistemas. PNASS: Programa Nacional de Avaliação de Serviços de Saúde [Internet]. Brasília, DF; 2015 [acesso em 2026 abr 2]. Disponível em: https://catalogo.ipea.gov.br/uploads/605_1.pdf
» https://catalogo.ipea.gov.br/uploads/605_1.pdf -
10 Chaves LA, Malta DC, Jorge AO, et al. Programa Nacional de Avaliação dos Serviços de Saúde (PNASS) 2015-2016: uma análise sobre os hospitais no Brasil. Rev Bras Epid. 2021;24:1-13. DOI: https://doi.org/10.1590/1980-549720210002
» https://doi.org/10.1590/1980-549720210002 -
11 Leite F, Gleriano JS, Dias BM. Índice de Desempenho da Saúde Suplementar: análise comparativa da mudança de metodologia de avaliação. Res Soc Dev. 2022;11(14):1-15. DOI: https://doi.org/10.33448/rsd-v11i14.36231
» https://doi.org/10.33448/rsd-v11i14.36231 -
12 Agência Nacional de Saúde Suplementar (BR). Classificação Global da Qualidade Hospitalar Consórcio de Indicadores de Qualidade Hospitalar [Internet]. 2024 [acesso em 2025 abr 14]. Disponível em: https://www.gov.br/ans/pt-br/arquivos/assuntos/prestadores/qualiss-programa-de-qualificacao-dos-prestadores-de-servicos-de-saude-1/copy_of__Projeto_Indicadores__Classificao_Global_da_Qualidade_Hospitalar_1.pdf
» https://www.gov.br/ans/pt-br/arquivos/assuntos/prestadores/qualiss-programa-de-qualificacao-dos-prestadores-de-servicos-de-saude-1/copy_of__Projeto_Indicadores__Classificao_Global_da_Qualidade_Hospitalar_1.pdf -
13 Care Quality Commission. 13-full_book_assessing-quality-and-performance-1744734607 [Internet]. [acesso em 2025 abr 14]. Disponível em: https://www.cqc.org.uk/guidance-regulation/providers/assessment/assessing-quality-and-performance
» https://www.cqc.org.uk/guidance-regulation/providers/assessment/assessing-quality-and-performance -
14 Agência Nacional de Vigilância Sanitária (BR). Projeto Melhoria do Processo de Inspeção Sanitária em Serviços de Saúde e de Interesse para a Saúde [Internet]. [acesso em 2025 abr 14]. Disponível em: https://www.gov.br/anvisa/pt-br/assuntos/servicosdesaude/projeto-de-melhoria-do-processo-de-inspecao-sanitaria-em-servicos-de-saude-e-de-interesse-para-a-saude/harmonizacao-de-roteiros-objetivos-de-inspecao-roi
» https://www.gov.br/anvisa/pt-br/assuntos/servicosdesaude/projeto-de-melhoria-do-processo-de-inspecao-sanitaria-em-servicos-de-saude-e-de-interesse-para-a-saude/harmonizacao-de-roteiros-objetivos-de-inspecao-roi -
15 Freitas VLSM, Leandro KC, Navarro MVT. O Olhar do Benefício além do Risco: construindo um Novo Paradigma em Vigilância Sanitária. Rev Bras Fis Med. 2019;13:128-137. DOI: https://doi.org/10.29384/rbfm.2019.v13.n1.p128-137
» https://doi.org/10.29384/rbfm.2019.v13.n1.p128-137 -
16 Navarro MVT. Conceito e controle de riscos à saúde em radiodiagnóstico: uma abordagem de vigilância sanitária [tese na Internet]. Salvador: Universidade Federal da Bahia; 2007 [acesso em 2026 abr 2]. Disponível em: https://repositorio.ufba.br/bitstream/ri/10399/1/5555555555555.pdf
» https://repositorio.ufba.br/bitstream/ri/10399/1/5555555555555.pdf -
17 Agência Nacional de Vigilância Sanitária (BR). Programa Nacional de Prevenção e Controle de Infecções Relacionadas à Assistência à Saúde (PNPCIRAS) 2021 a 2025 [Internet]. Brasília, DF. 2021 mar 5 [acesso em 2026 abr 2]. Disponível em: https://www.gov.br/anvisa/pt-br/centraisdeconteudo/publicacoes/servicosdesaude/publicacoes/pnpciras_2021_2025.pdf
» https://www.gov.br/anvisa/pt-br/centraisdeconteudo/publicacoes/servicosdesaude/publicacoes/pnpciras_2021_2025.pdf -
18 Ministério da Saúde (BR); Fundação Oswaldo Cruz; Agência Nacional de Vigilância Sanitária. Documento de referência para o Programa Nacional de Segurança do Paciente [Internet]. Brasília, DF: Ministério da Saúde; 2014 [acesso em 2026 abr 2]. 40 p. il. Disponível em: https://bvsms.saude.gov.br/bvs/publicacoes/documento_referencia_programa_nacional_seguranca.pdf
» https://bvsms.saude.gov.br/bvs/publicacoes/documento_referencia_programa_nacional_seguranca.pdf -
19 Ministério da Saúde (BR). Portaria GM/MS nº 529, de 1º de abril de 2013. Institui o Programa Nacional de Segurança do paciente (PNSP) [Internet]. Diário Oficial da União, Brasília, DF. 2013 abr 1 [acesso em 2026 abr 2]; Seção I:1. Disponível em: https://bvsms.saude.gov.br/bvs/saudelegis/gm/2013/prt0529_01_04_2013.html
» https://bvsms.saude.gov.br/bvs/saudelegis/gm/2013/prt0529_01_04_2013.html -
20 Agência Nacional de Vigilância Sanitária (BR). Resolução da Diretoria Colegiada no 36, de 25 de julho de 2013. Institui ações para a segurança do paciente em serviços de saúde e dá outras providências [Internet]. Diário Oficial da União, Brasília, DF. 2013 jul 26 [acesso em 2026 abr 2]; Seção I: 1. Disponível em: https://bvsms.saude.gov.br/bvs/saudelegis/anvisa/2013/rdc0036_25_07_2013.html
» https://bvsms.saude.gov.br/bvs/saudelegis/anvisa/2013/rdc0036_25_07_2013.html -
21 Agência Nacional de Vigilância Sanitária (BR). Plano Integrado para a Gestão Sanitária da Segurança do Paciente em Serviços de Saúde 2021-2025 [Internet]. Brasília, DF. 2021 mar 5 [acesso em 2026 abr 2]. Disponível em: https://www.gov.br/anvisa/pt-br/centraisdeconteudo/publicacoes/servicosdesaude/publicacoes/plano-integrado-2021-2025-final-para-publicacao-05-03-2021.pdf
» https://www.gov.br/anvisa/pt-br/centraisdeconteudo/publicacoes/servicosdesaude/publicacoes/plano-integrado-2021-2025-final-para-publicacao-05-03-2021.pdf
Edited by
-
Editor in charge:
Maura Vanessa Silva Sobreira, Universidade do Estado do Rio Grande do Norte (UERN), Caicó (Rio Grande do Norte/RN), Brasil. Lattes: http://lattes.cnpq.br/4231913524179274 - Orcid: https://orcid.org/0000-0001-6804-4198 - e-mail: maurasobreira@ufrn.br

 Source: Own elaboration.
 Source: Own elaboration.
 Source: Own elaboration.
 Source: Own elaboration.